Power BI Tutorial - Working with Power BI Dashboards
Posted by Superadmin on August 20 2020 04:24:50
Working with Power BI Dashboards
This Power BI tutorial section is about the Dashboard creation, adding content, deleting items etc.
- Dashboard Actions
- Add Reports to a Dashboard
- Add Title to Dashboard
- How to Add Image to Dashboard
- Add Video to Dashboard
- Add Web Content to Dashboard
- Dashboard Settings
- Delete a Dashboard
- Pin Report to a Dashboard
Power BI Dashboard Actions
Let me show you the Power BI Dashboard Actions and their uses. Before we start exploring the list of dashboard actions in power bi, let me show you the existing dashboards in my Power BI workspace.
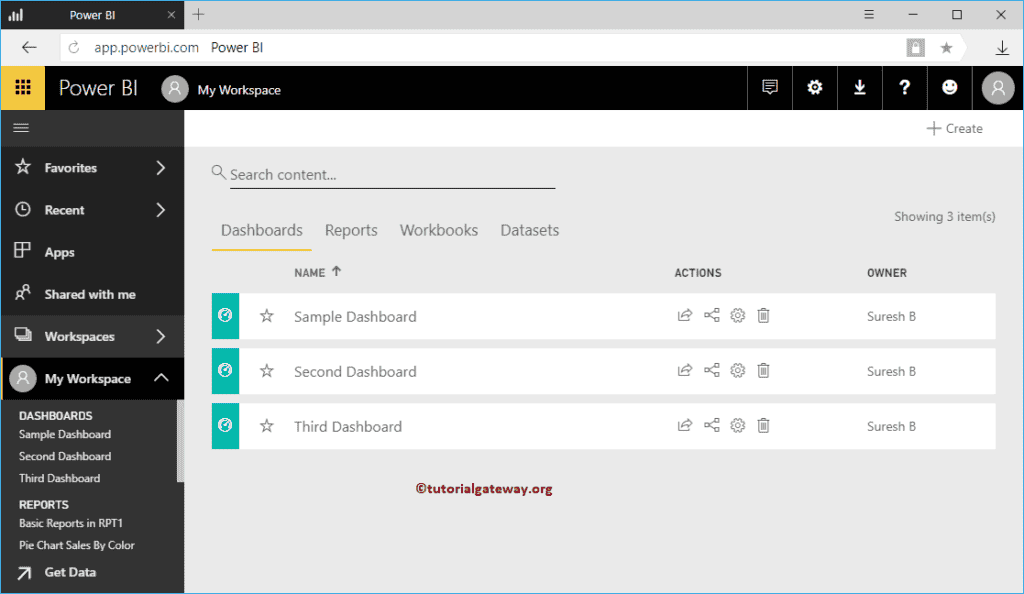
To view them, please click on the Power BI My Workspace, and then go to the dashboards tab. From the screenshot below, you can see that there are six dashboards.
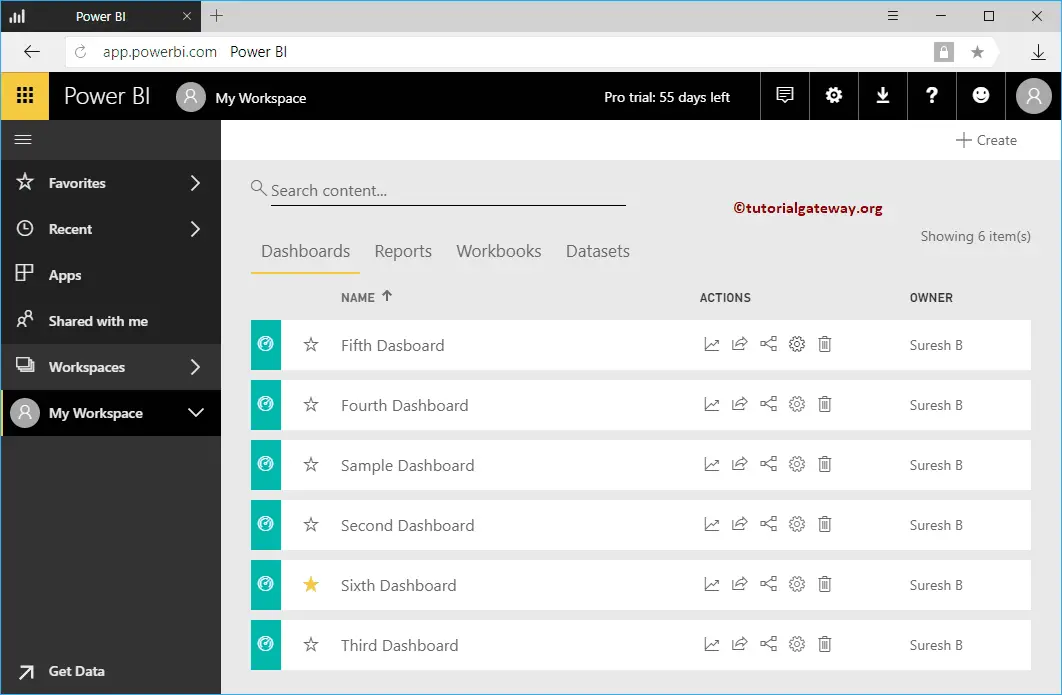
Power BI Dashboard Actions
In this example, we use the Sixth Dashboard to demonstrate the Power BI dashboard actions.
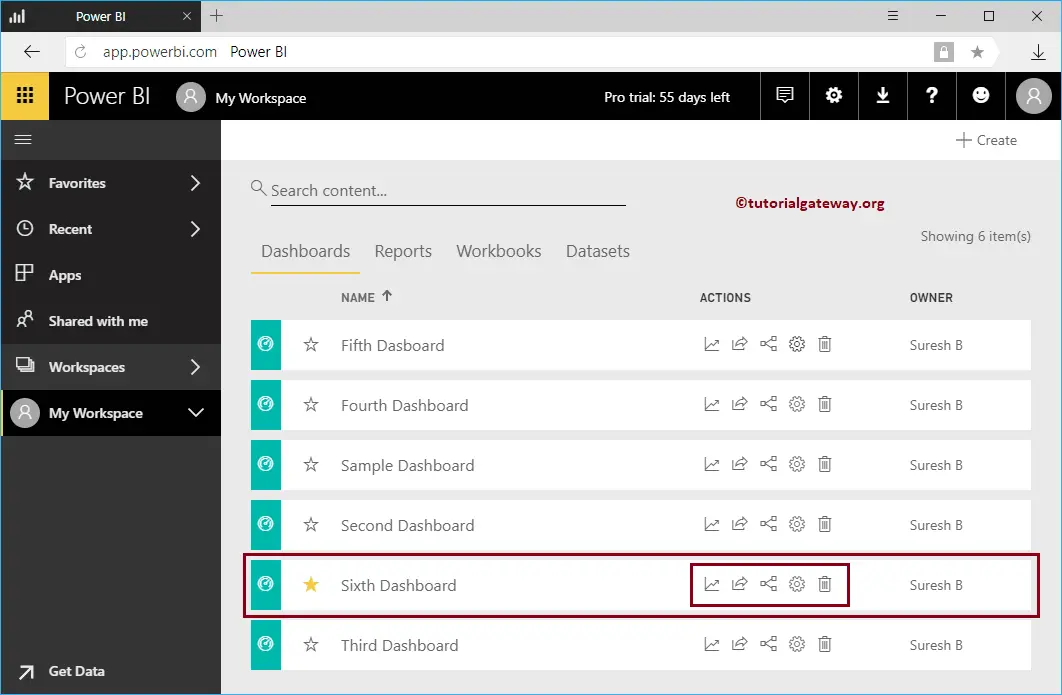
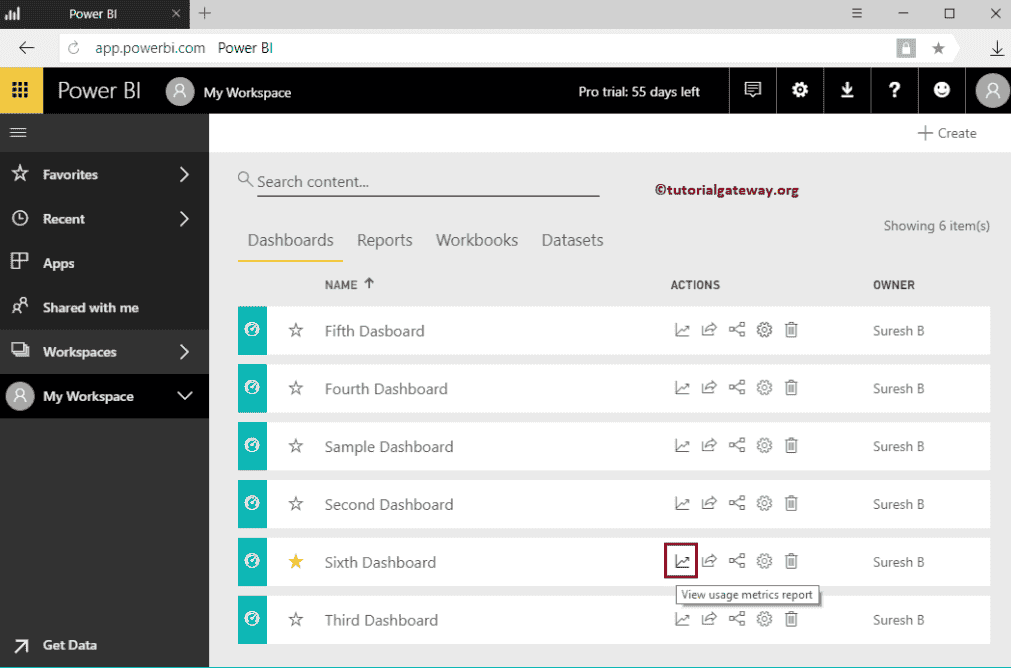
View Usage Metrics Report of a Power BI Dashboard
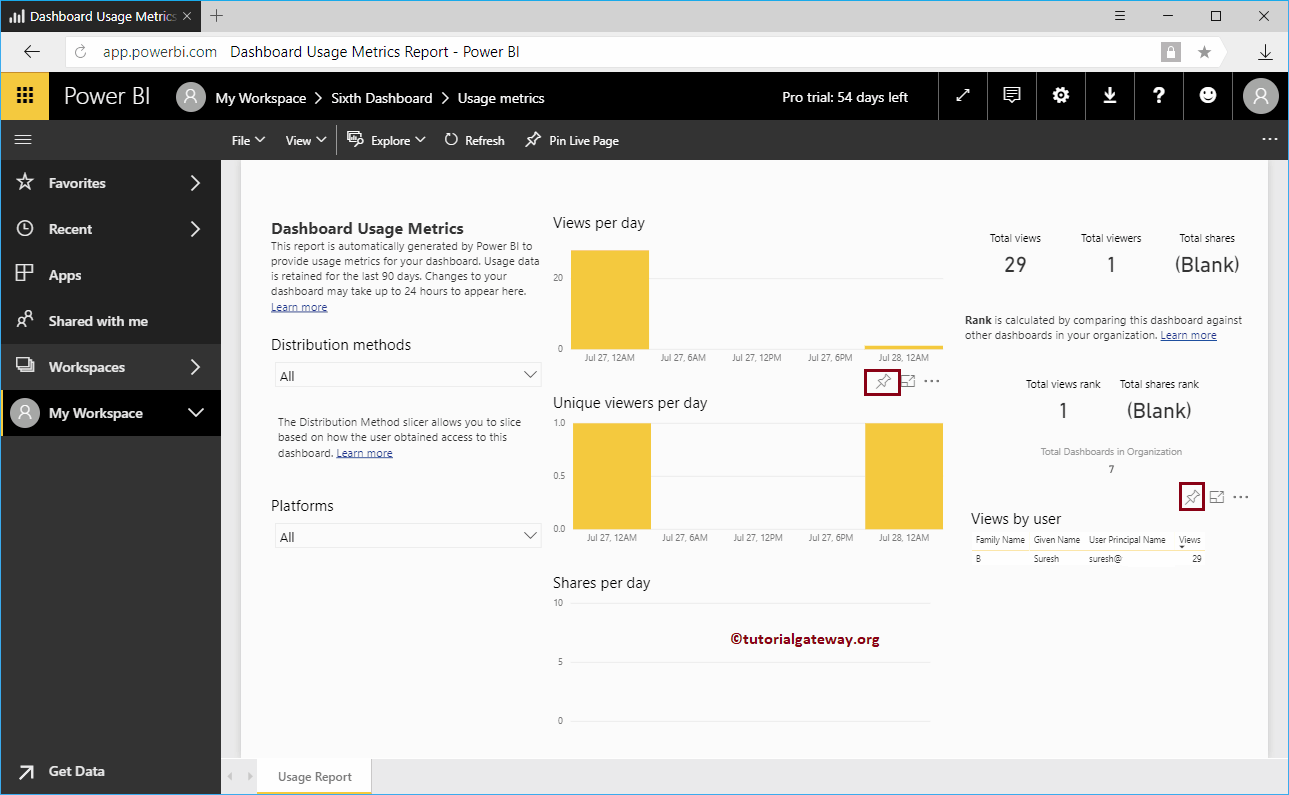
This button helps you to view the usage metric of a Power BI dashboard in a report format. Let me hit that button.
From the screenshot below, you can see the report displaying the Views per day by the user, etc. You can also pin these reports to your main Power BI dashboard.
Share Power BI Dashboard
Use this button to share this dashboard across the organization. Let me hit this button.
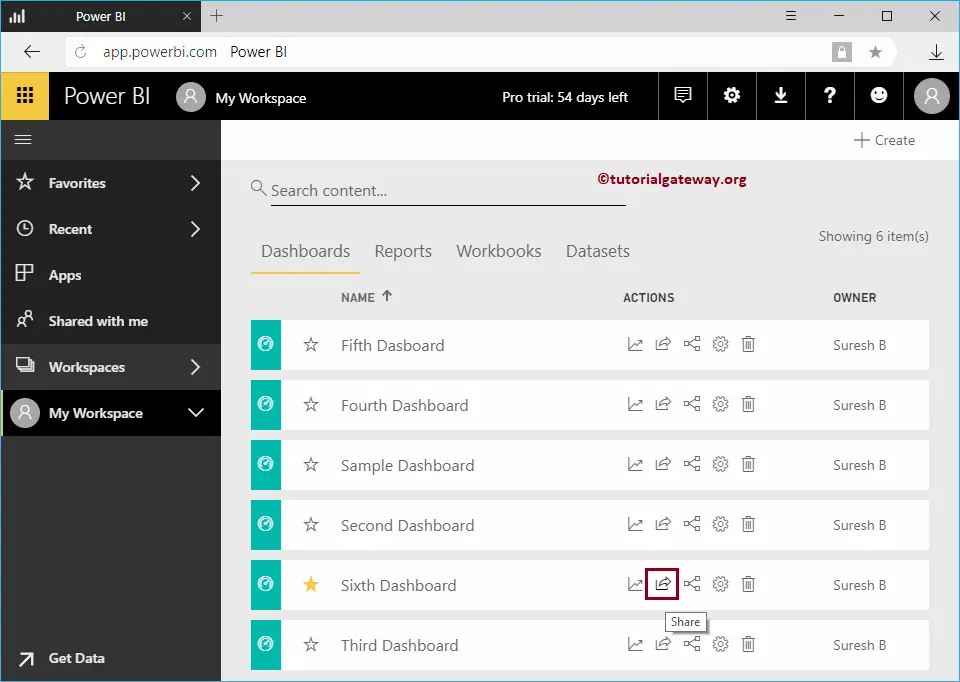
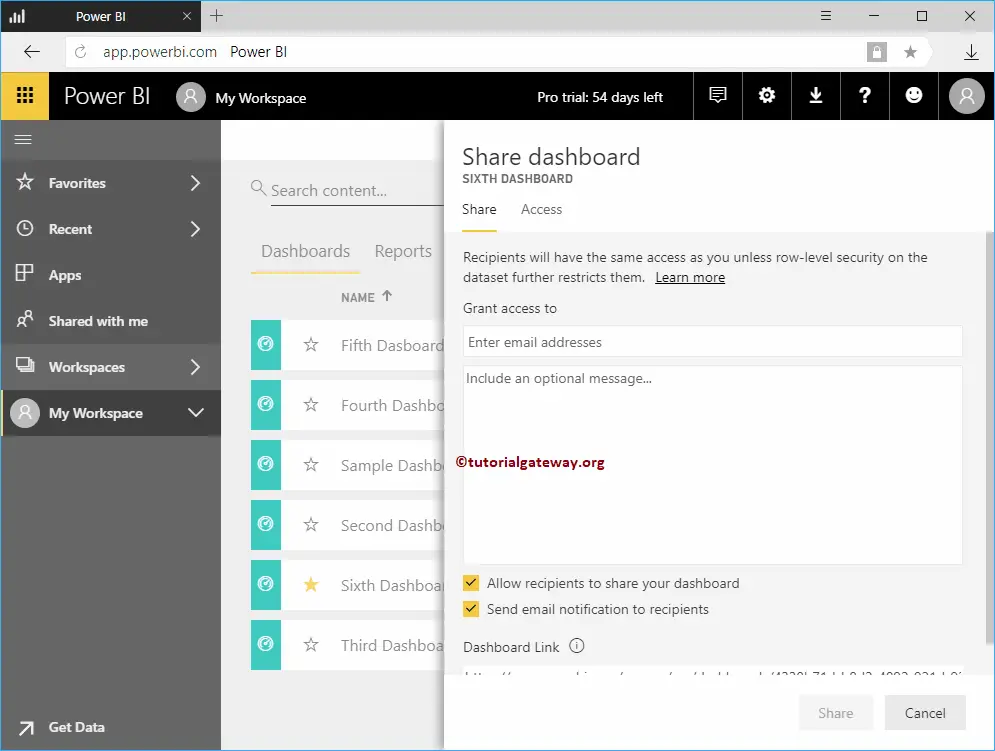
I am clicking the share button to open the following window. I suggest you refer to Share a Dashboard article to understand the options.
View Related Items of a Power BI Dashboard
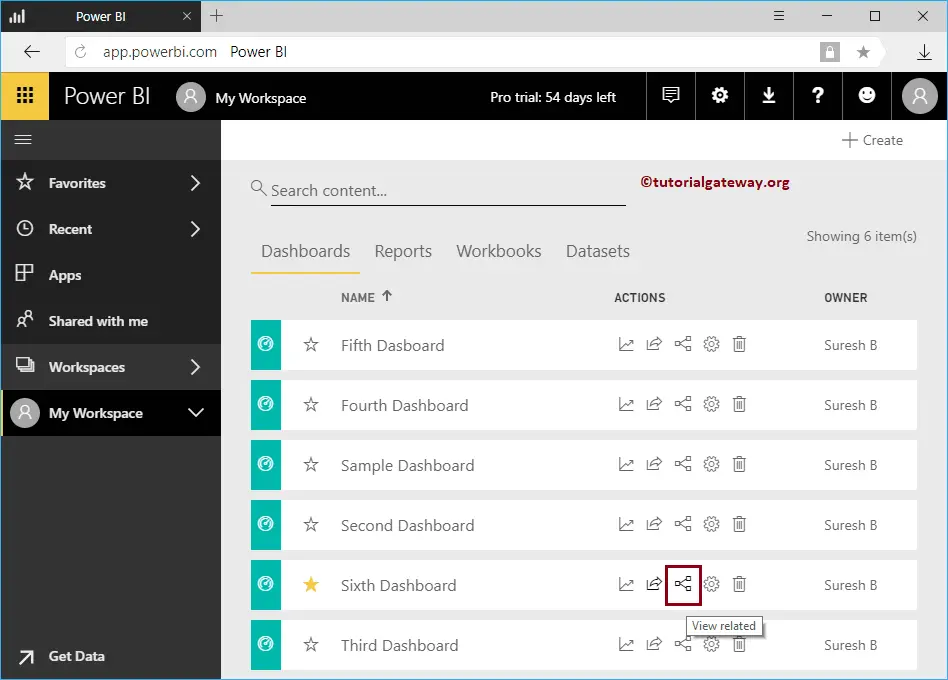
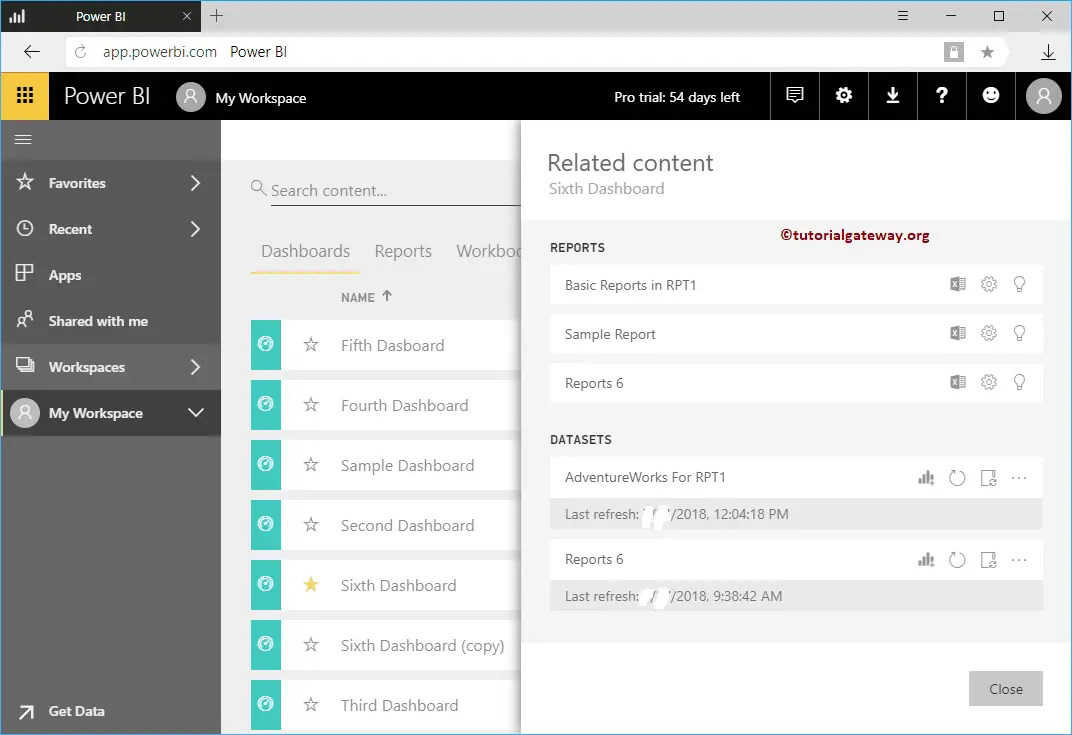
This button helps you see the items that are related (that we used to build this dashboard) to this dashboard.
From the screenshot below, you can see this dashboard created using two datasets and three different reports.
Power BI Dashboard Settings
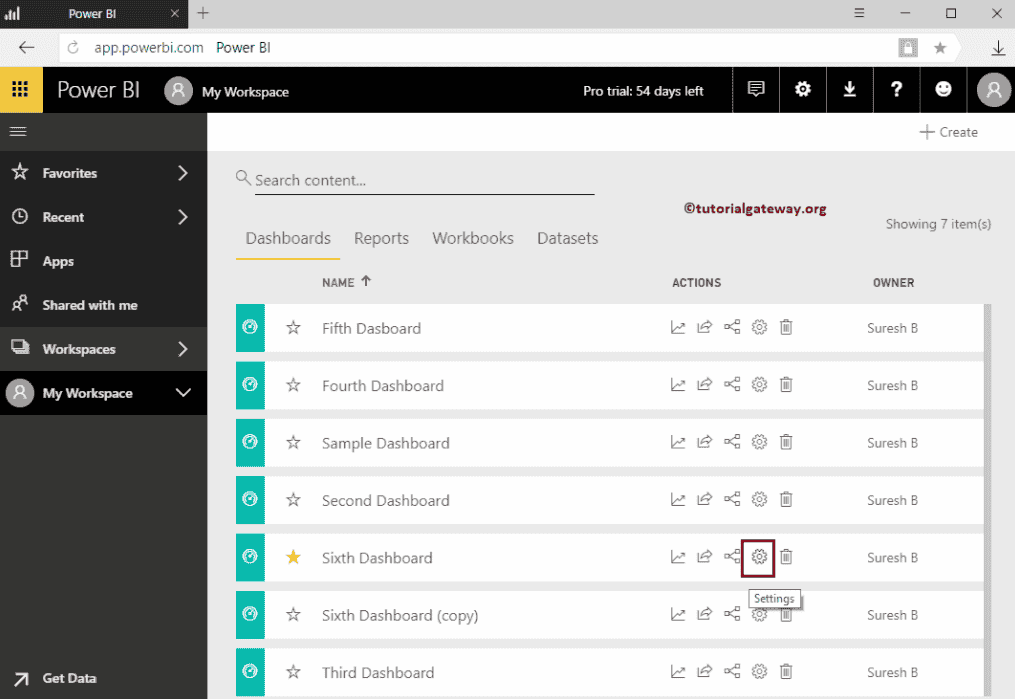
You can alter the Power BI dashboard settings using this option. I suggest you refer to Dashboard Setting’s article under these settings.
Delete Power BI Dashboard
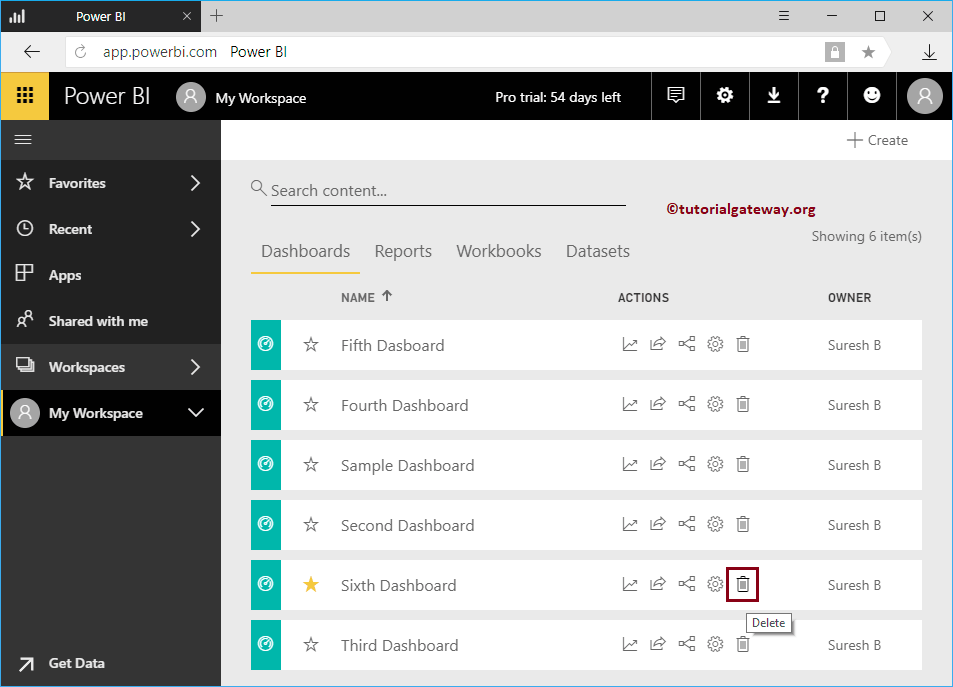
This button helps you to delete the unwanted Power BI dashboard from your workspace. I suggest you refer to Delete a Dashboard article.
Add Reports to Power BI Dashboard
How to add reports to Power BI dashboard with a practical example?. Before we get into the actual Add Reports to Power BI Dashboard example, let me show you the dashboards that are available in my workspace.
TIP: I suggest you refer to Create a Power BI Dashboard article to understand the steps involved in creating a Power BI dashboard.
Navigate yourself to see the list of available reports inside your workspace.
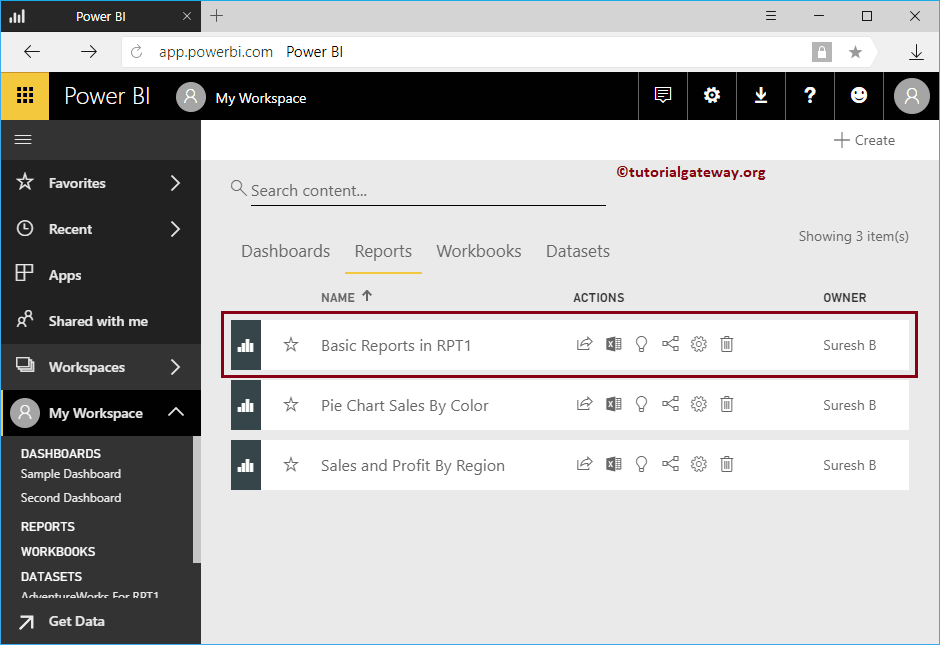
How to add Reports to Power BI Dashboard
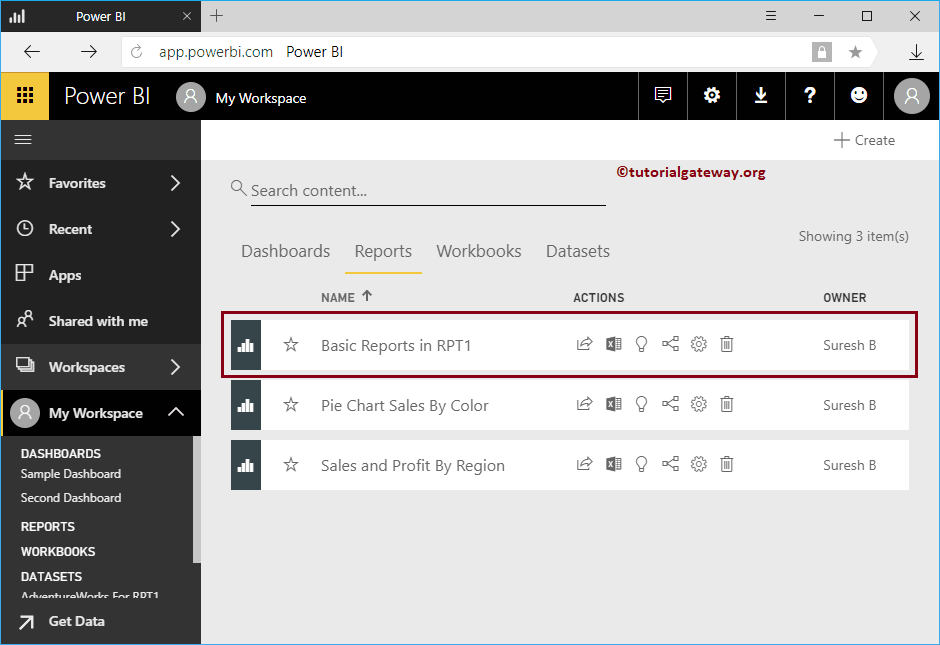
In this example, we are going to use the Basic reports in RPT 1 report. So, click on this report to see the pages available in this report.
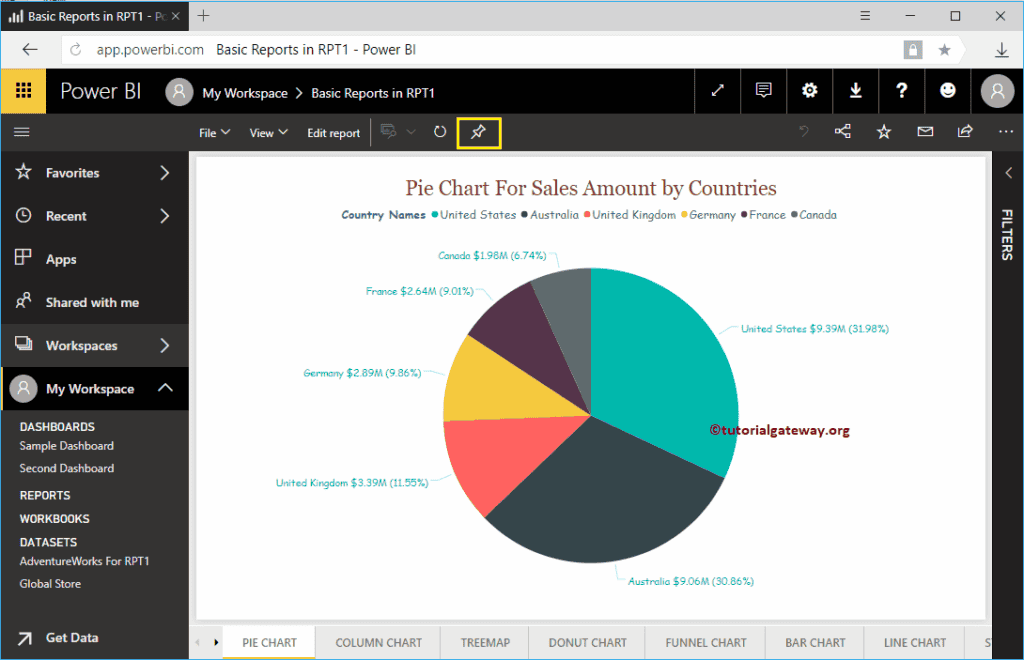
Now you can see the pages inside the selected report. Let me add this Pie Chart to our dashboard.
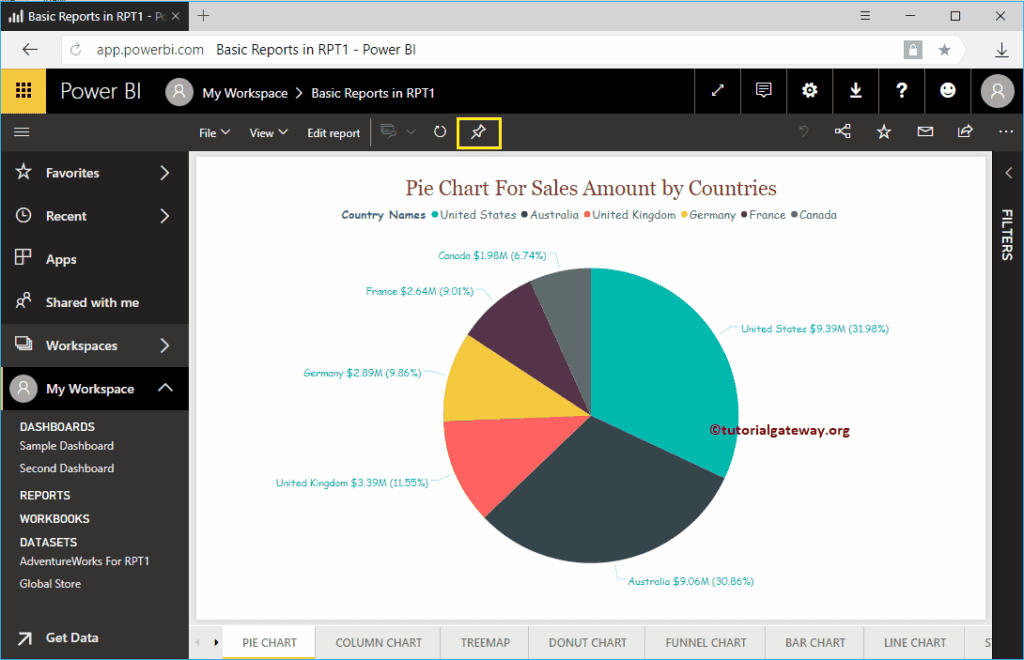
Click on the Pin Live Page button that we have shown in the screenshot below.
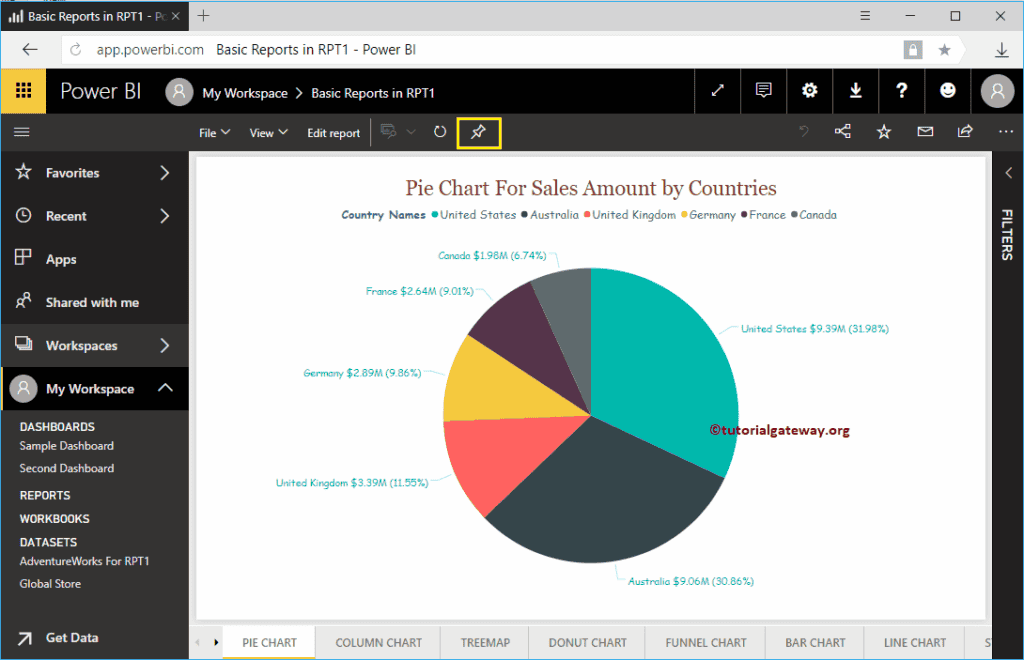
Clicking that button opens the following window.
- Preview: It shows you the preview of the selected report.
- Existing dashboard: If you want to add this report to an existing dashboard, then you have to select this option.
- New Dashboard: If you want to create a new dashboard for this report, then you have to select this option.
- Drop down Menu: Use this drop-down box to select the dashboard.
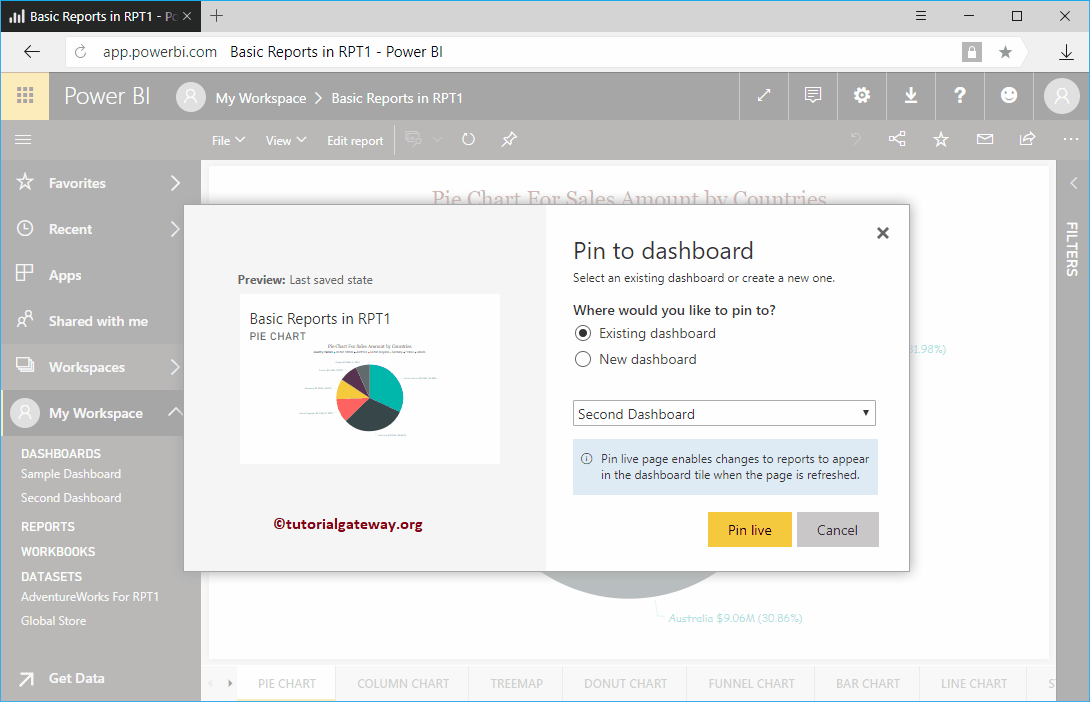
Add Reports to Existing Power BI Dashboard
In this example, we are selecting the Existing Power BI dashboard option. Next, we selected the Sample dashboard
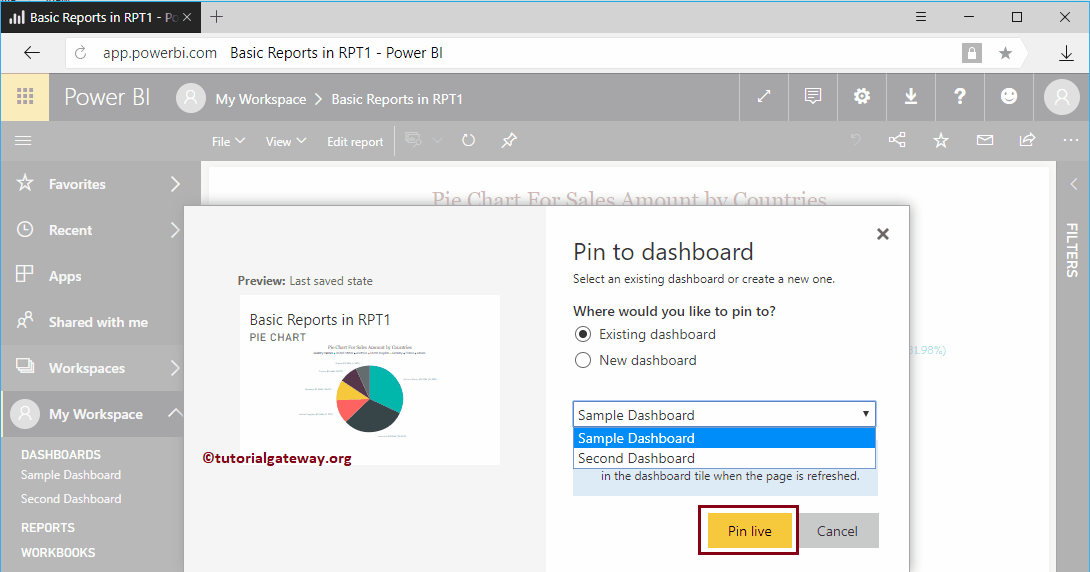
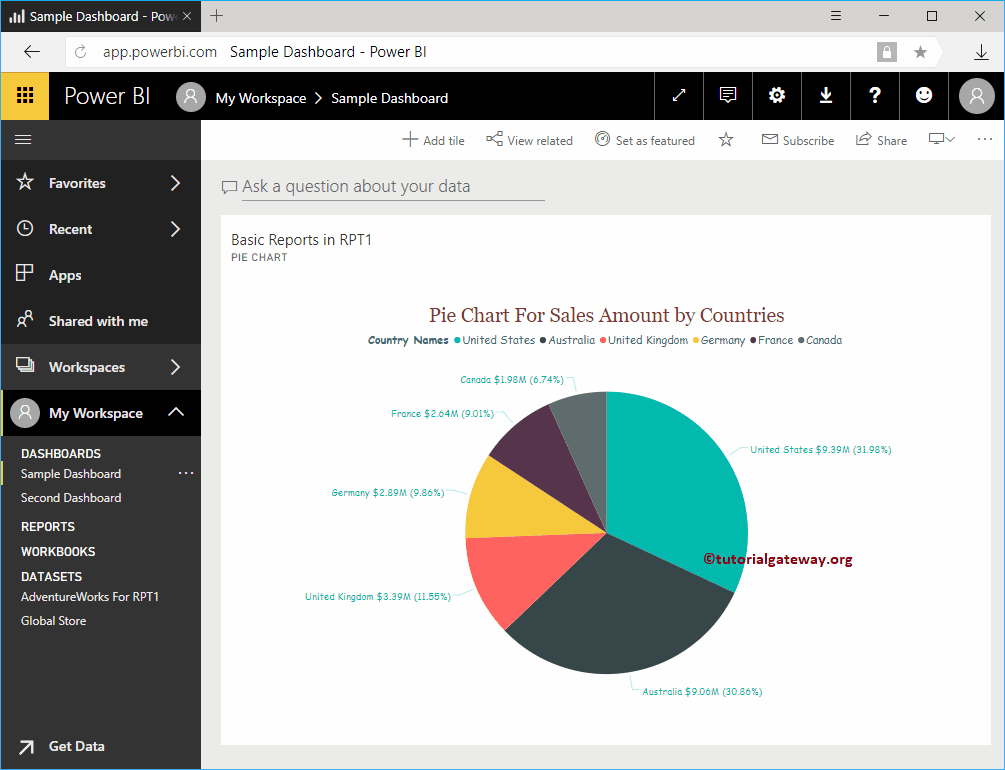
Clicking the Pin Live button adds a report to the sample dashboard. Let me open my Sample Dashboard.
Similarly, you can add multiple reports to a single dashboard.
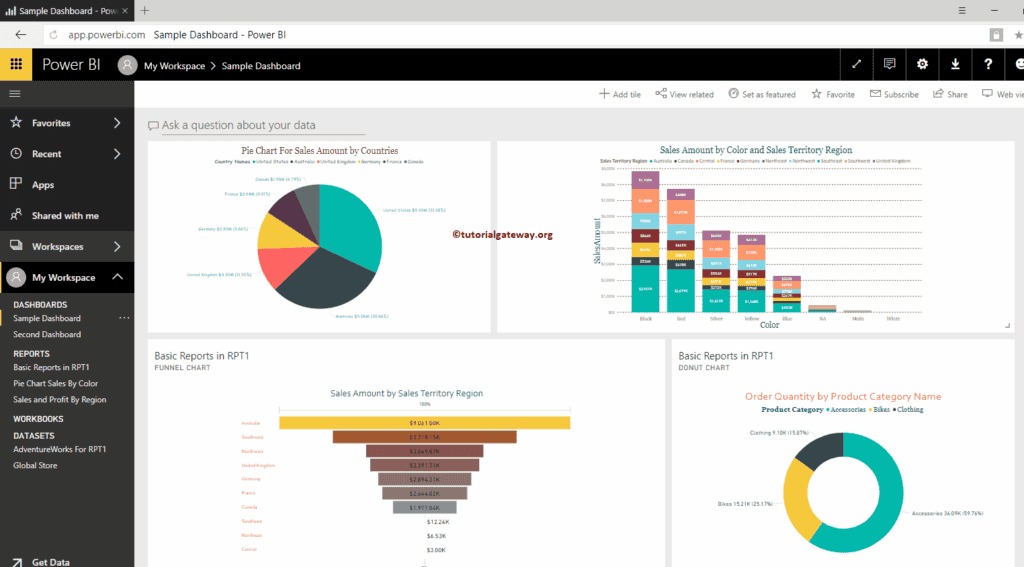
You can use your mouse cursor to adjust the size and position of a report inside your dashboard. Let me adjust for your reference.
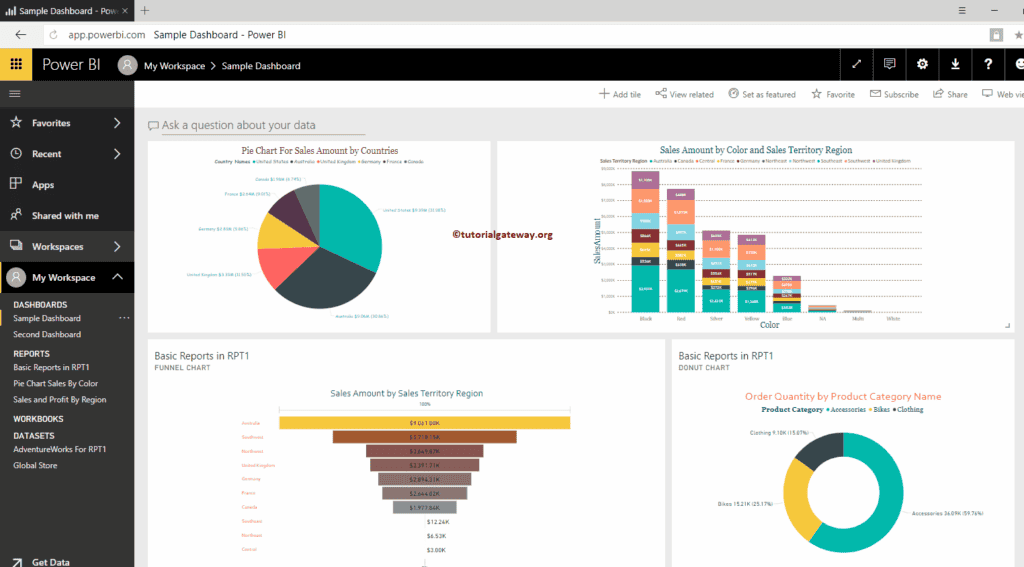
Now you can see all the available reports
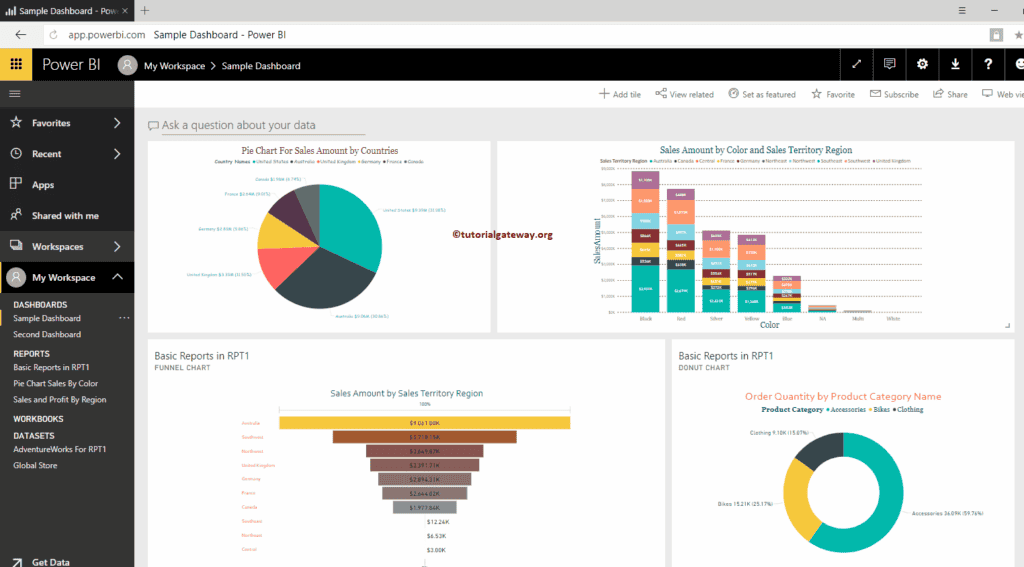
Add Reports to New Power BI Dashboard
In this example, we are going to add reports to the existing Power BI dashboard. So, we are selecting the New dashboard option.
It replaces the drop-down box with the text box. You have to provide your new dashboard name in this text box.
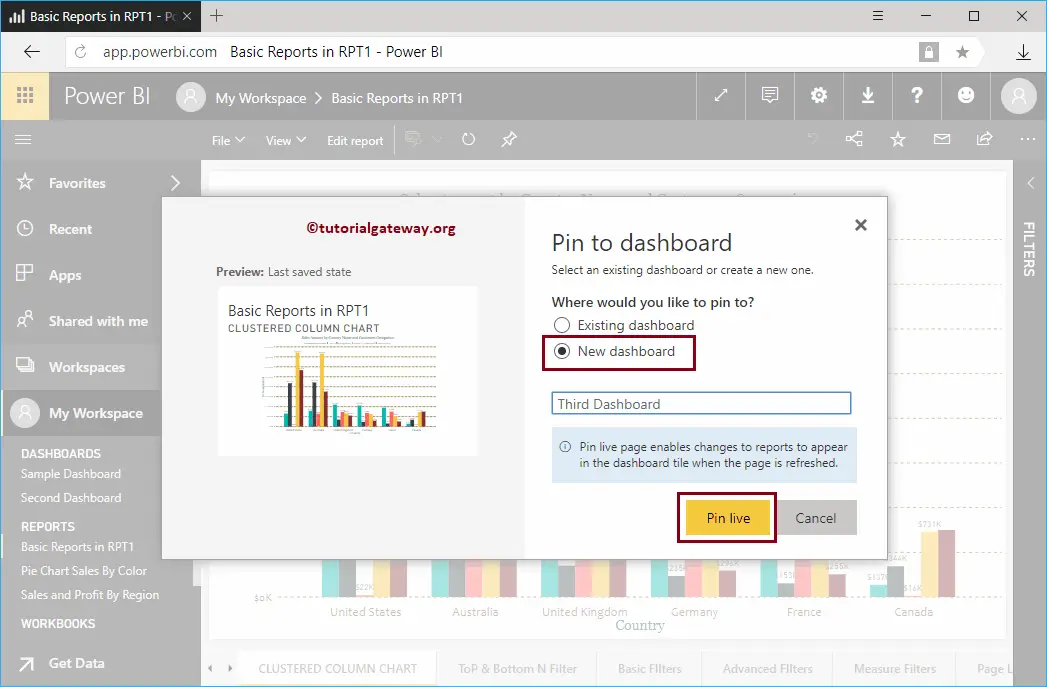
Now you can see the Clustered Column chart inside your third dashboard.
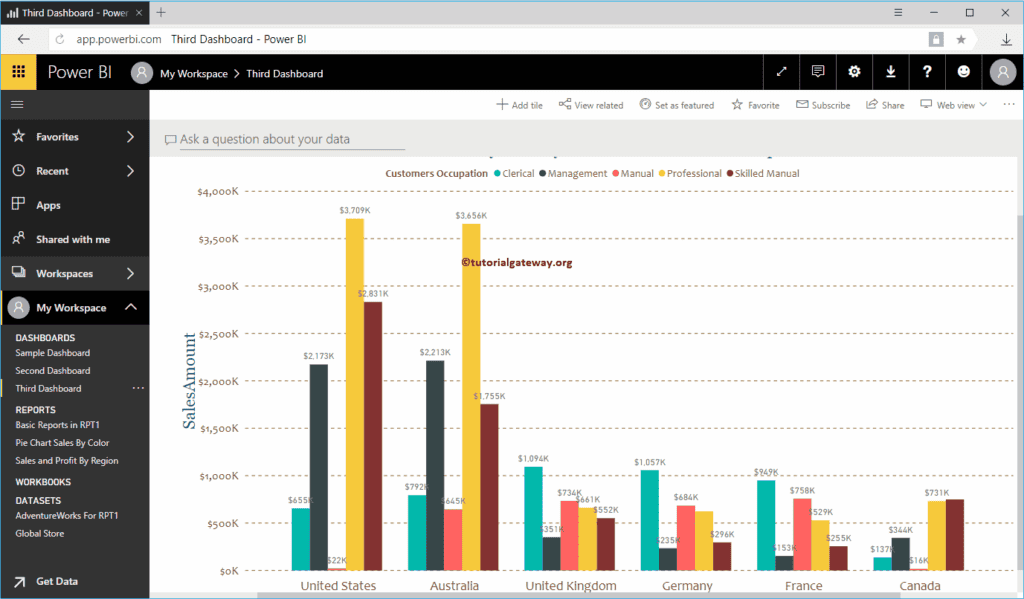
Let me navigate to My Workspace -> and Dashboards tab to see the dashboards. As you can see, it is displaying the Third Dashboard that we created earlier.
Add Title to Power BI Dashboard
How to add title to Power BI dashboard with an example?. For this Add Title to Power BI Dashboard demonstration, we are going to use the Sixth dashboard.
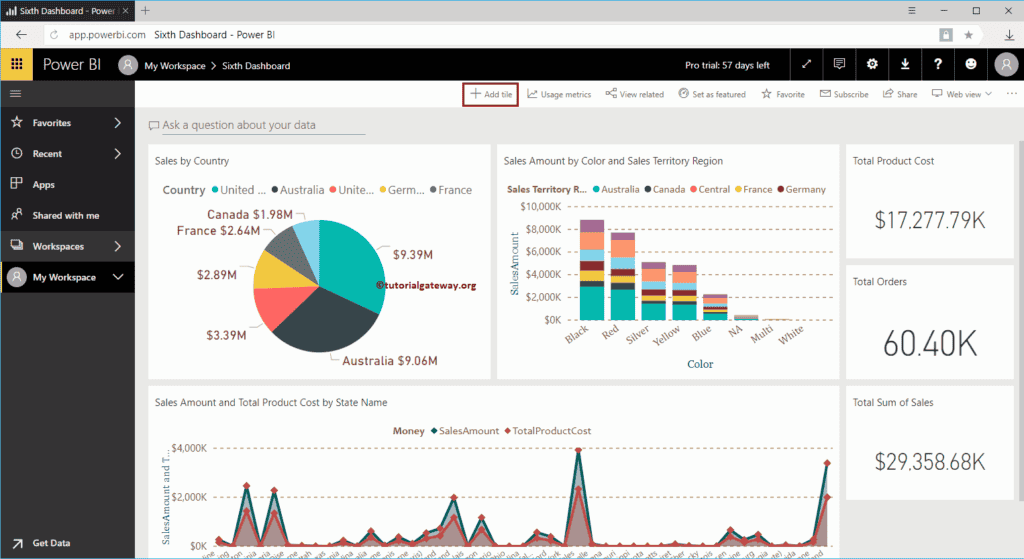
How to add Title to Power BI Dashboard
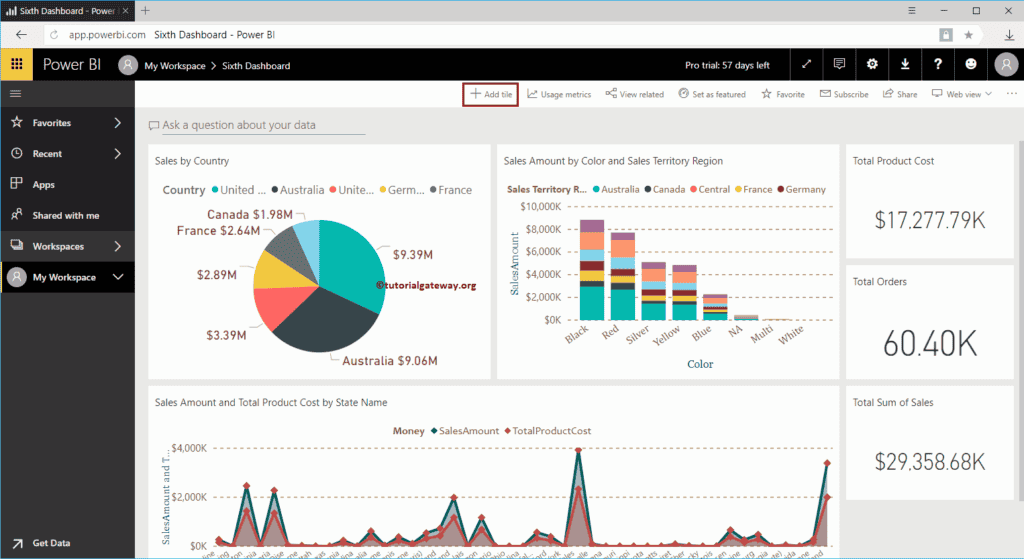
In order to add a title or any text to the existing Power BI dashboard, please click on the Add tile button.
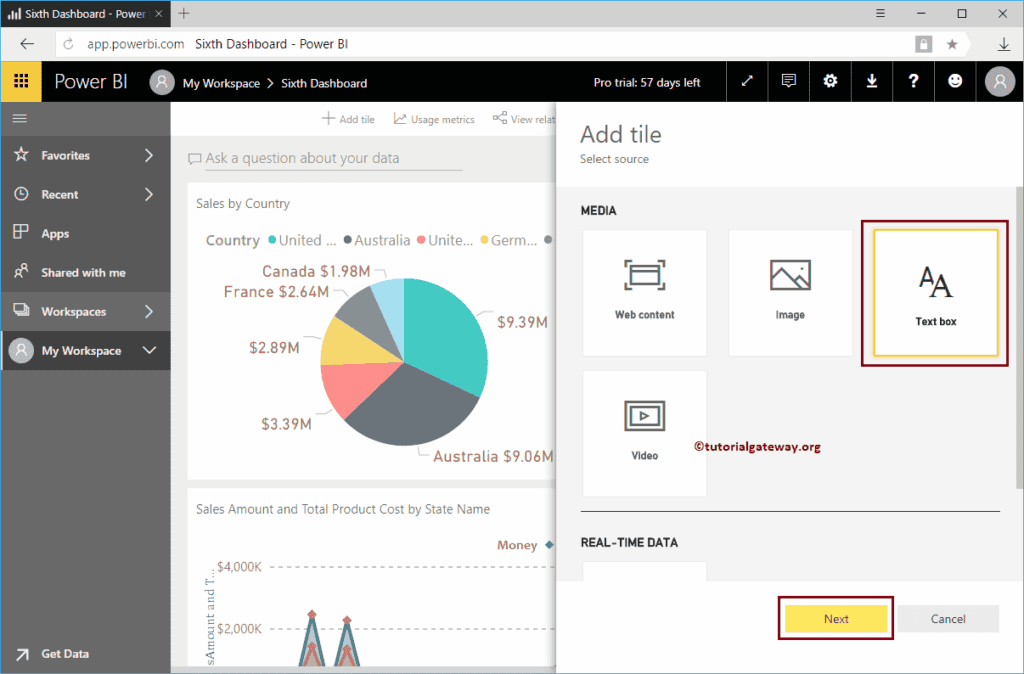
Clicking on the Add tile button opens the following window. Here, you have to select the Text Box.
This text box helps you add a Title or any custom text that explains the dashboard.
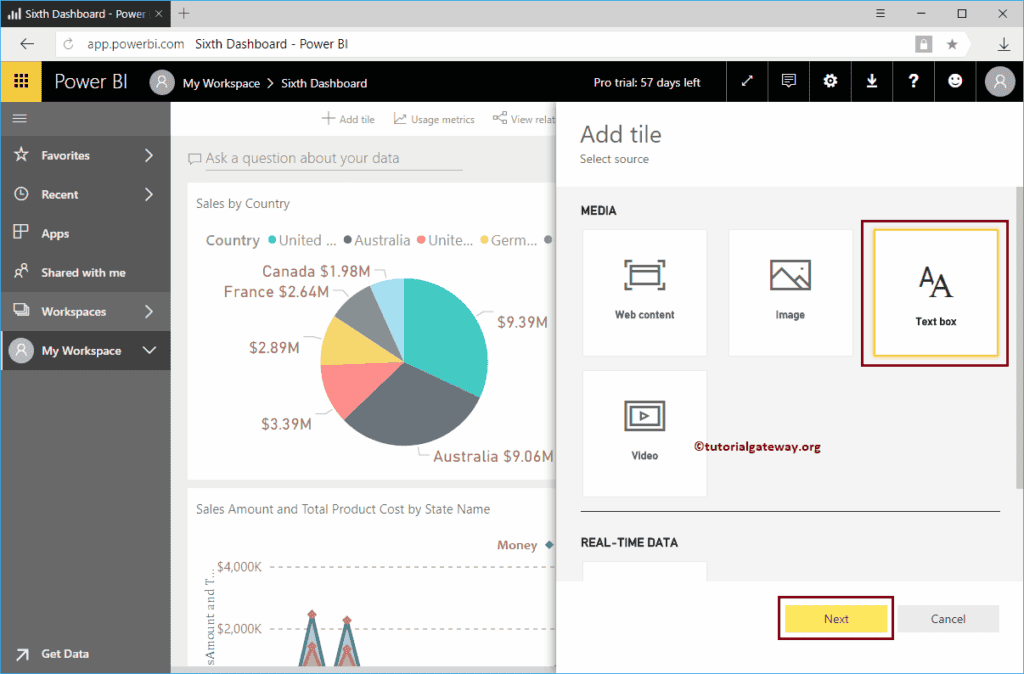
Please select the Text Box and click the Next button
Under the Power BI Add Text box tile section, we have
- Display Title and subtitle: Please checkmark this option to display the title and subtitle of this text box.
- Title: Specify the title of the text box
- Subtitle: Please provide the text box subtitle
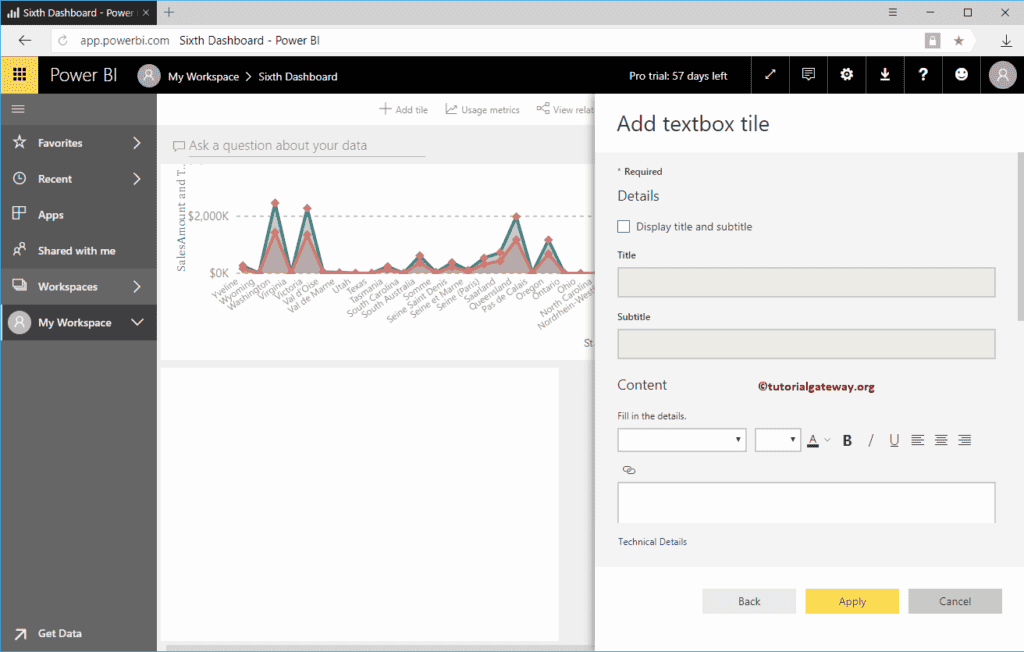
Under the content section, you can write your custom text. I mean, writing paragraphs that explain about the dashboard, dashboard title, etc.
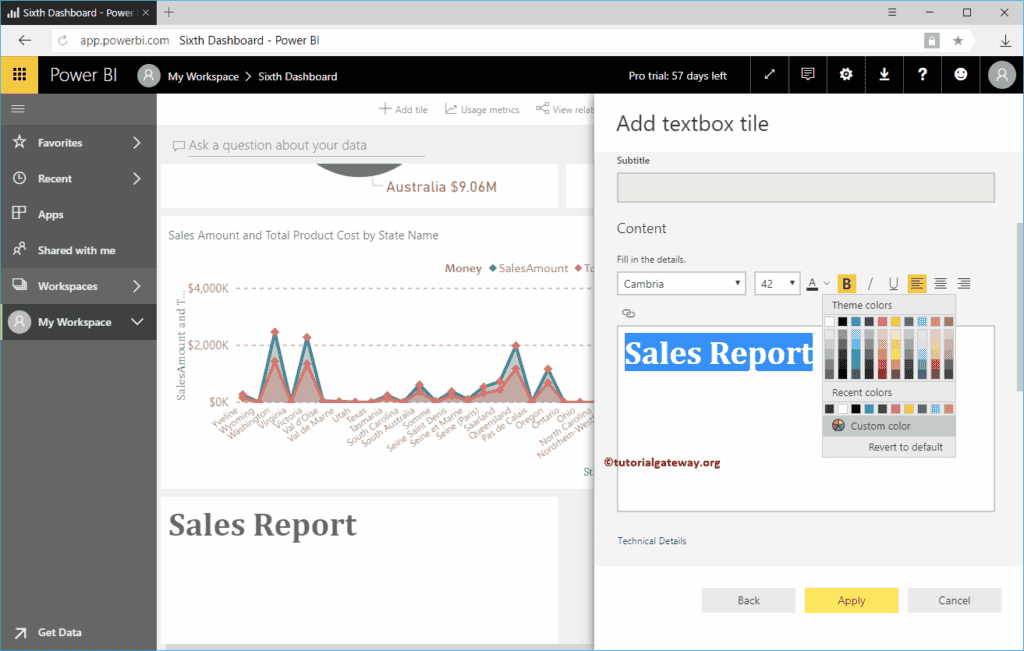
In this example, we want to display or add a title to the Power BI Dashboard. So, we added the Sales Report as the content and changed the font to Cambria, font size to 42, font-weight to Bold, and Color to Green.
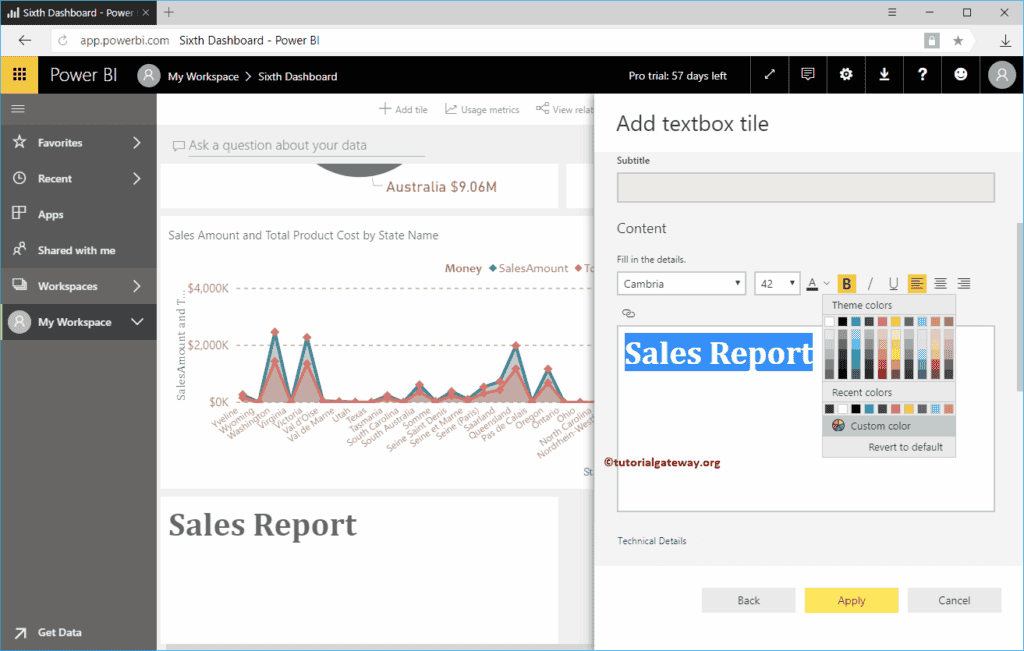
Click the Apply button
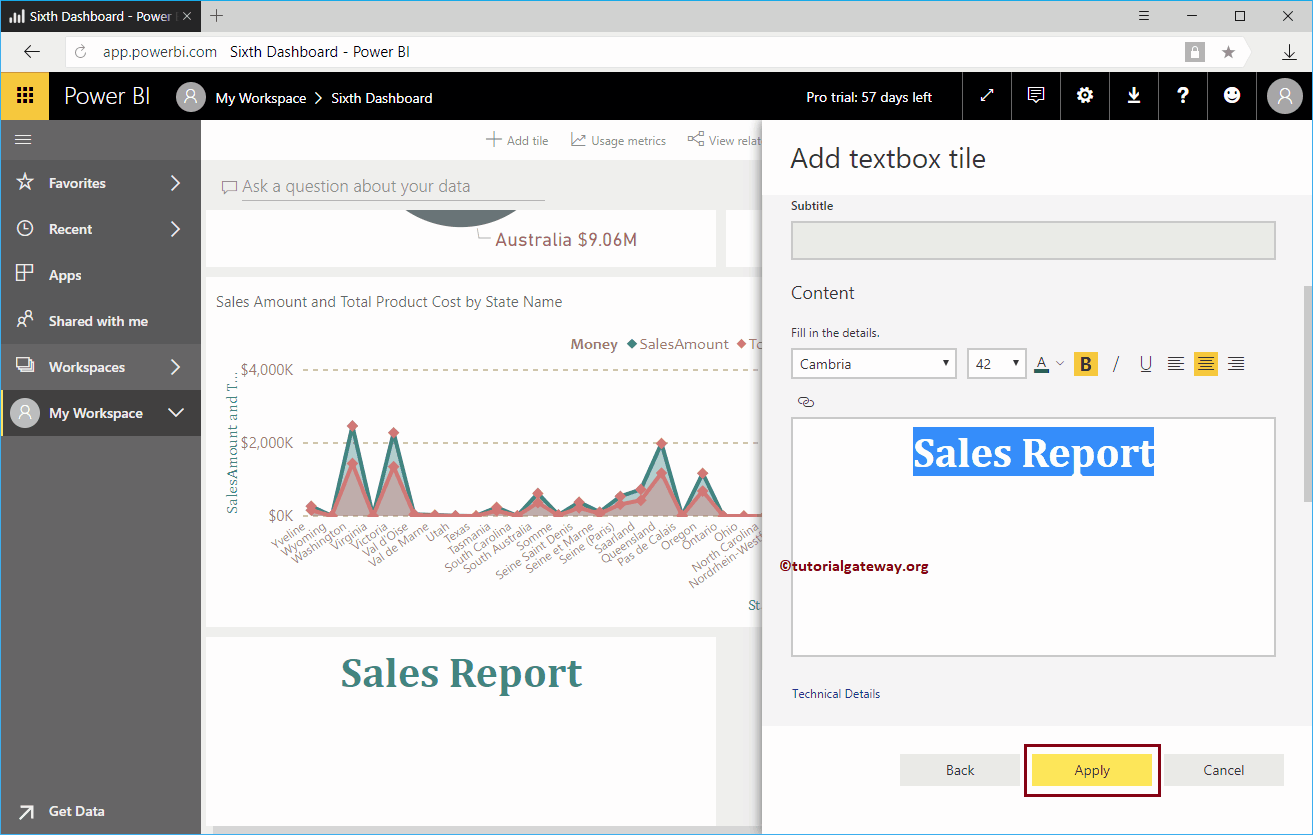
Now you can see the new tile displaying the Dashboard title.
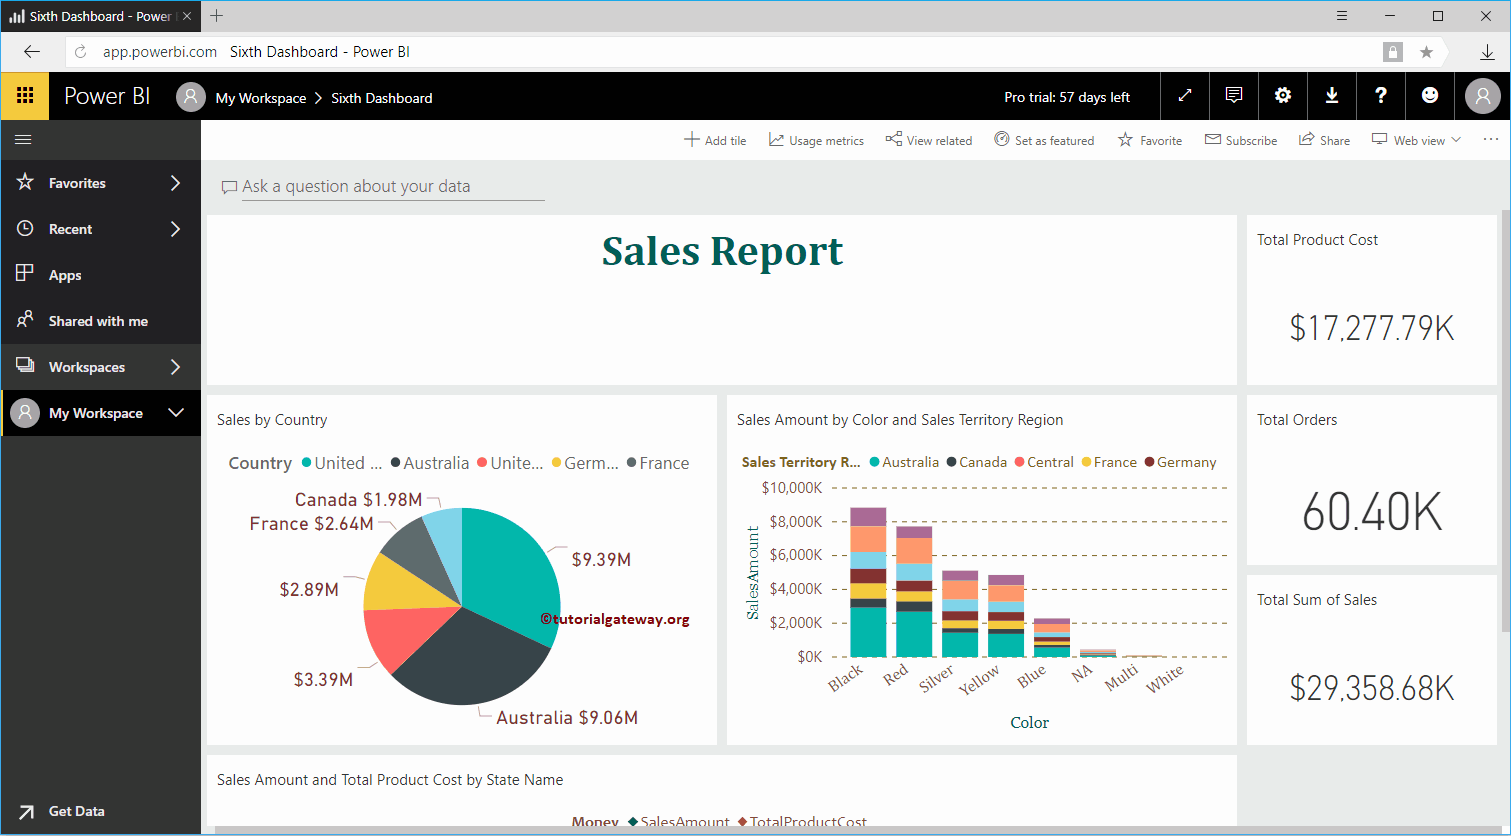
Let me edit the title tile
As you can see from the screenshot below, we added the Title, Subtitle, and sample content.
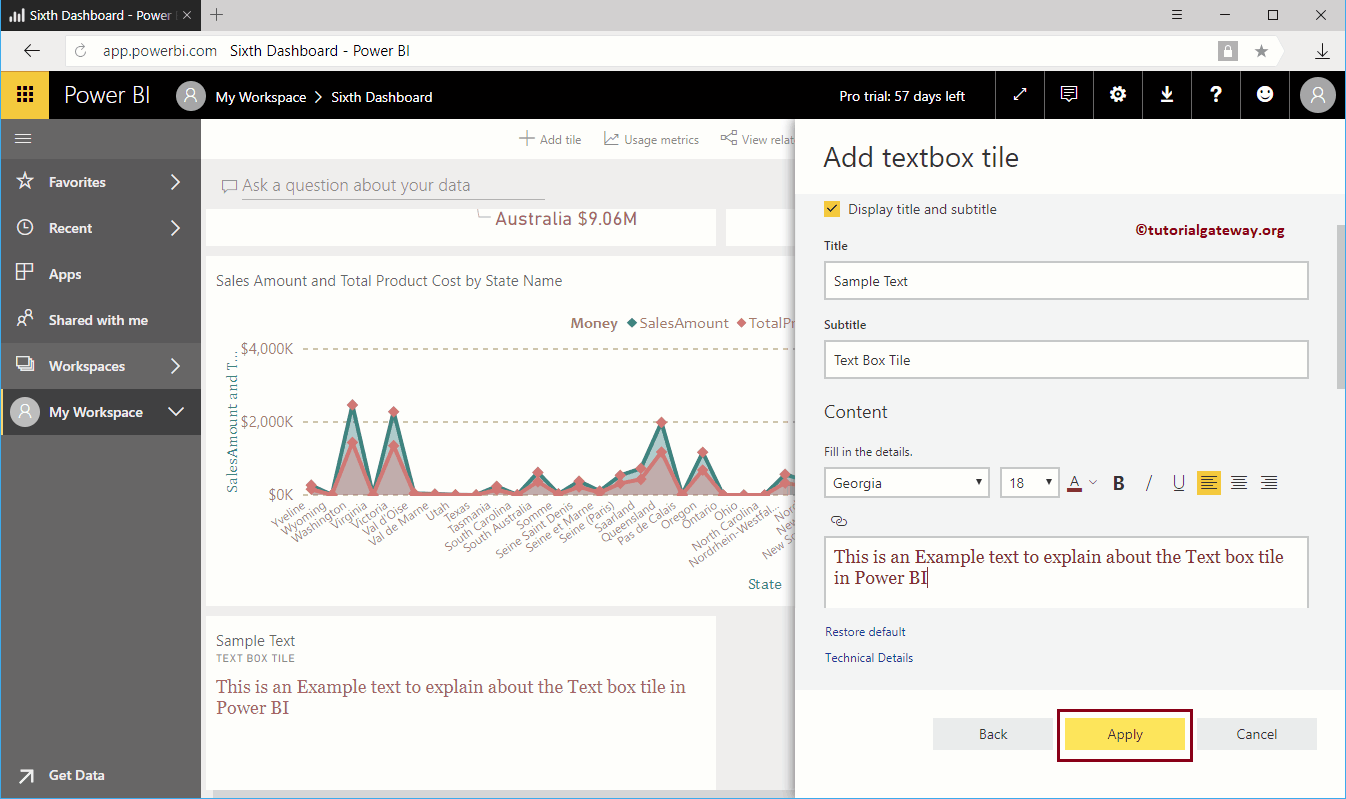
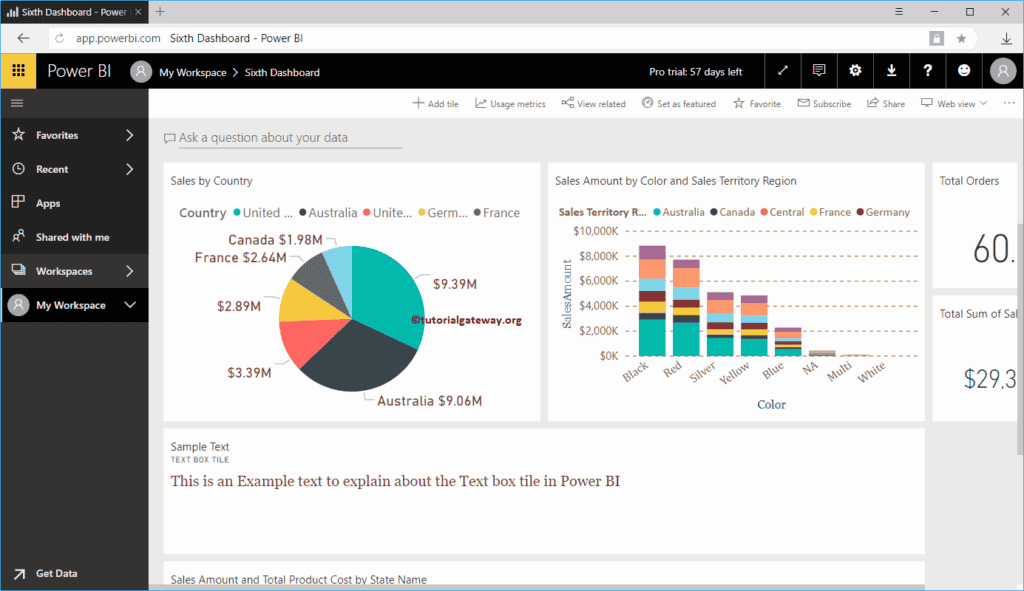
Now you can see the Text box with Title, Subtitle, and the content in the selected Color and Font size
Add Image to Power BI Dashboard
How to add Image to Power BI dashboard with a practical example?. For this Add Image to Power BI Dashboard demonstration, we are going to use the Sixth dashboard.

How to add Image to Power BI Dashboard
In order to add an image or logo to the existing Power BI dashboard, please click on the Add tile button
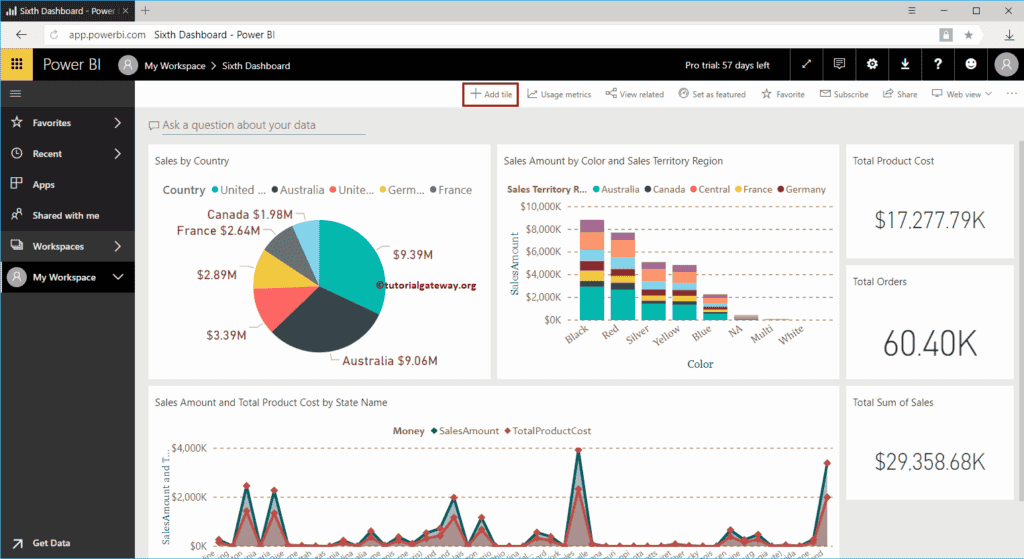
Clicking on the Add tile button opens the following window. Please select the Image under the Media section and click the Next button.
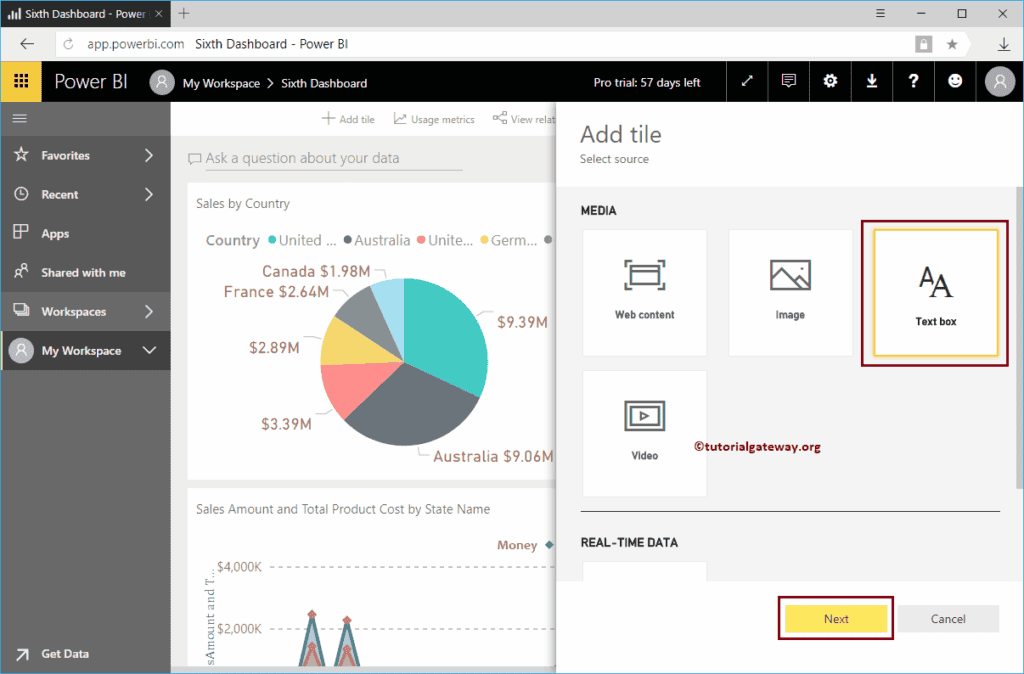
Under the Add Image to Power BI Dashboard tile section, we have
- Display Title and subtitle: Please checkmark this option to display the title and subtitle of an Image.
- Title: Specify the Image title
- Subtitle: Please provide the subtitle for this Image
- URL: Please provide the Image URL.
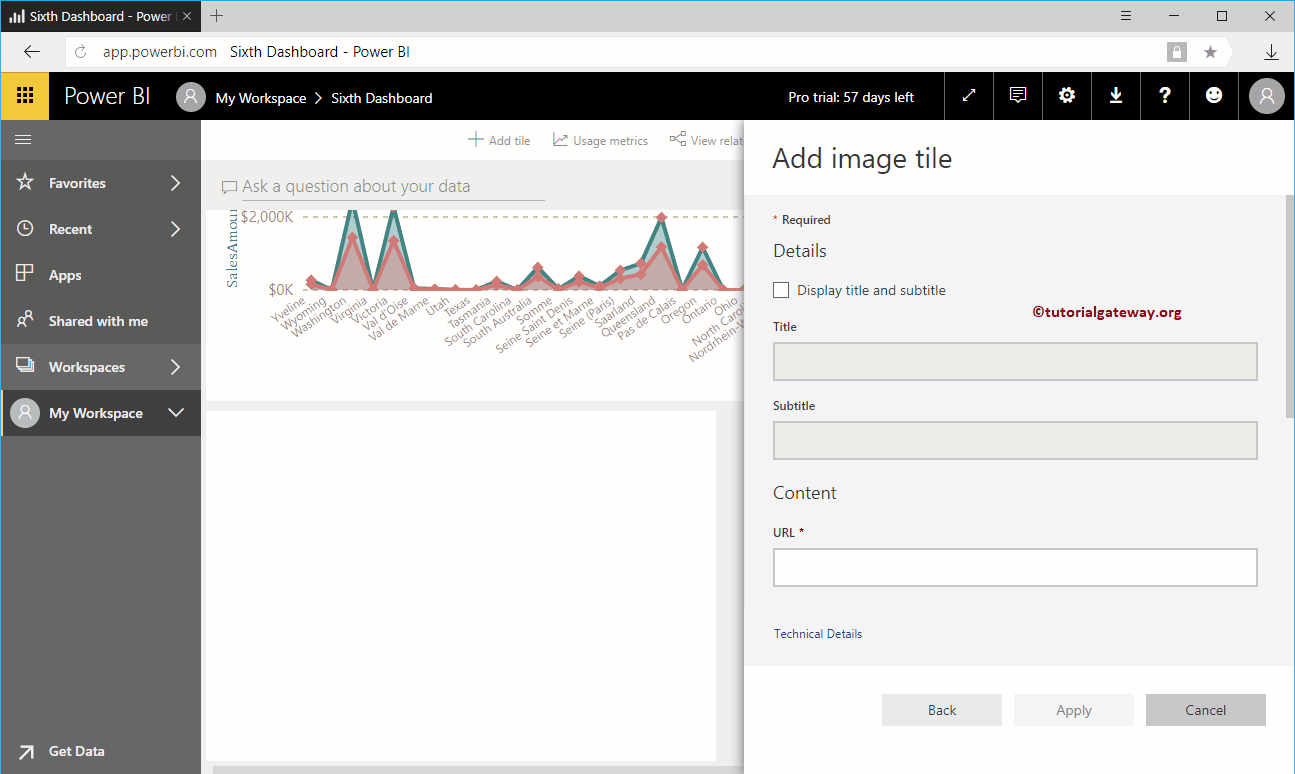
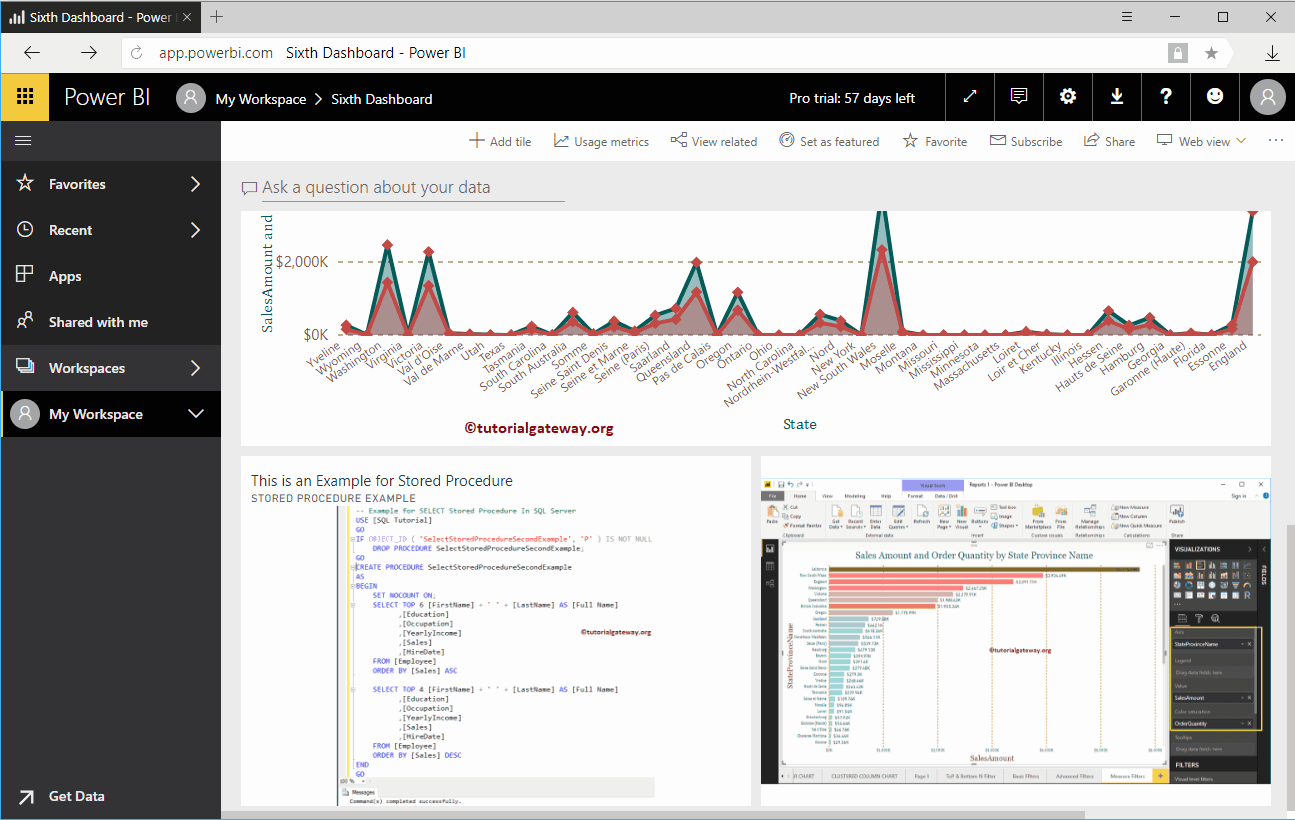
In this Power BI example, we want to insert the Stored Procedure Image from our website. So, let me use the same.
From the screenshot below, you can see the image in our Power BI dashboard
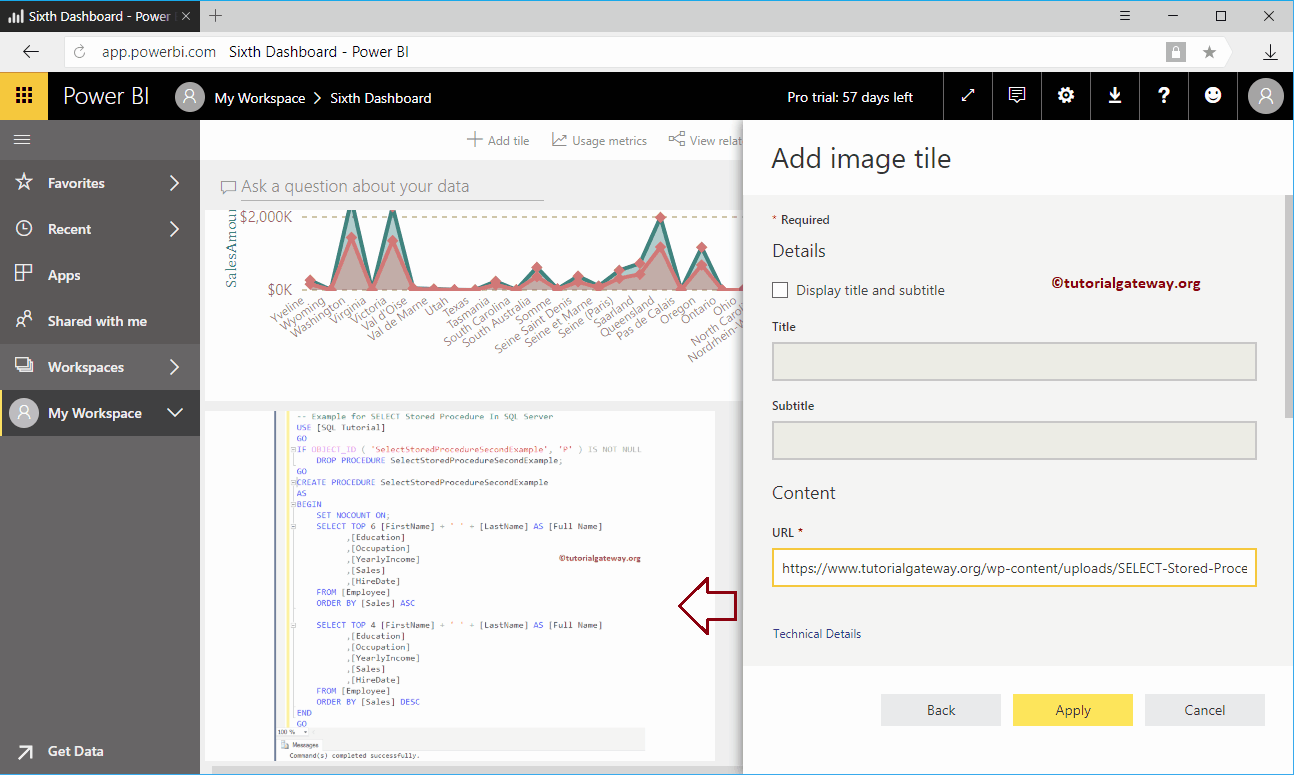
As you can see from the below screenshot, we also added the Title and Subtitle to this image.
Click the Apply button
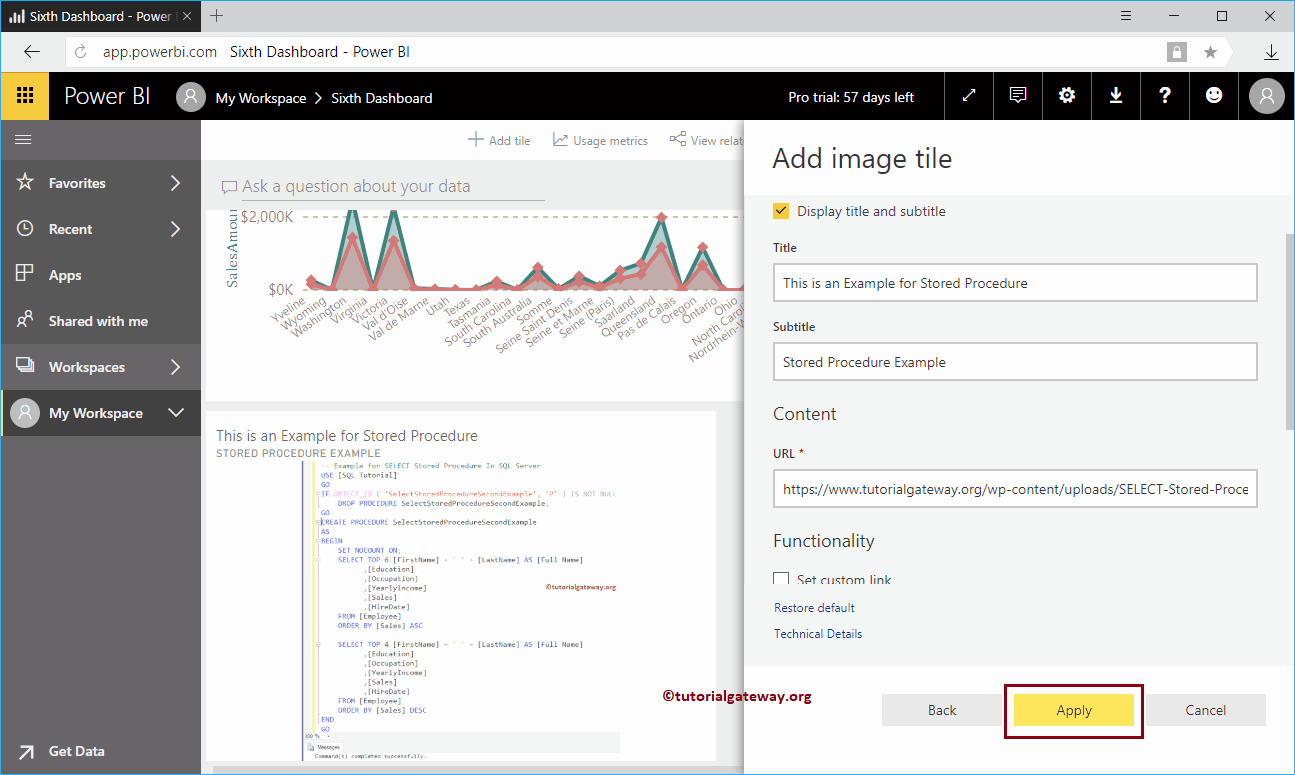
Now you can see the Image with Tile and Subtitle inside our Power BI Dashboard.
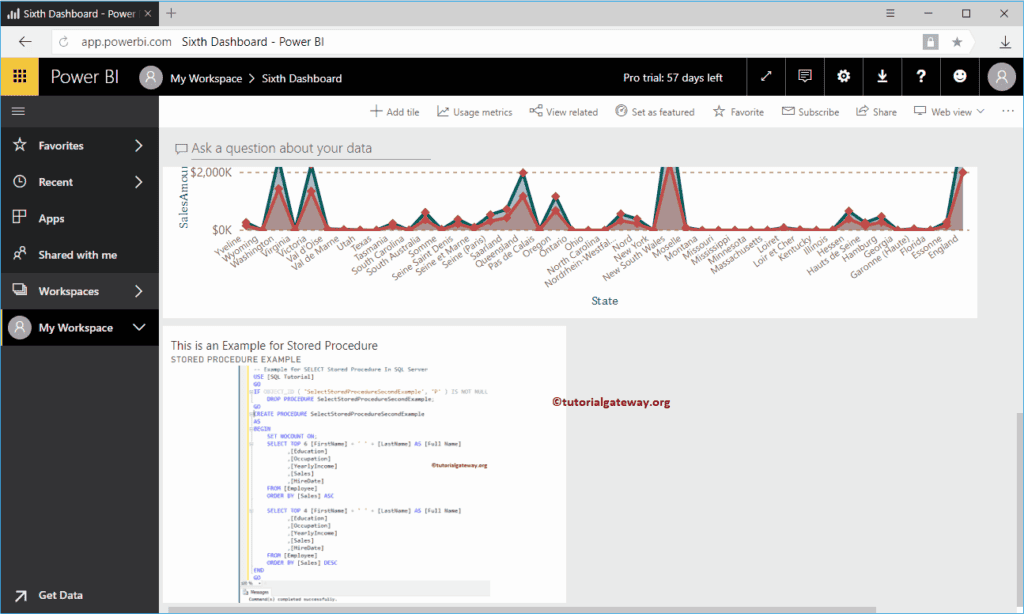
Let me edit the Image tile
As you can see from the below screenshot, it has few more options inside it
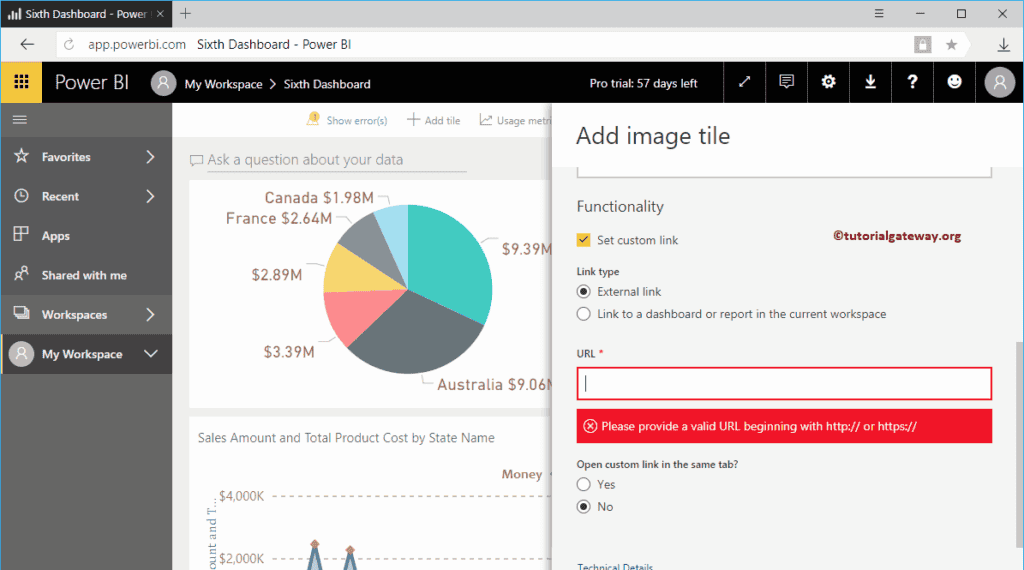
- Set Custom Link: Please check mark this option to provide a custom link to this Image.
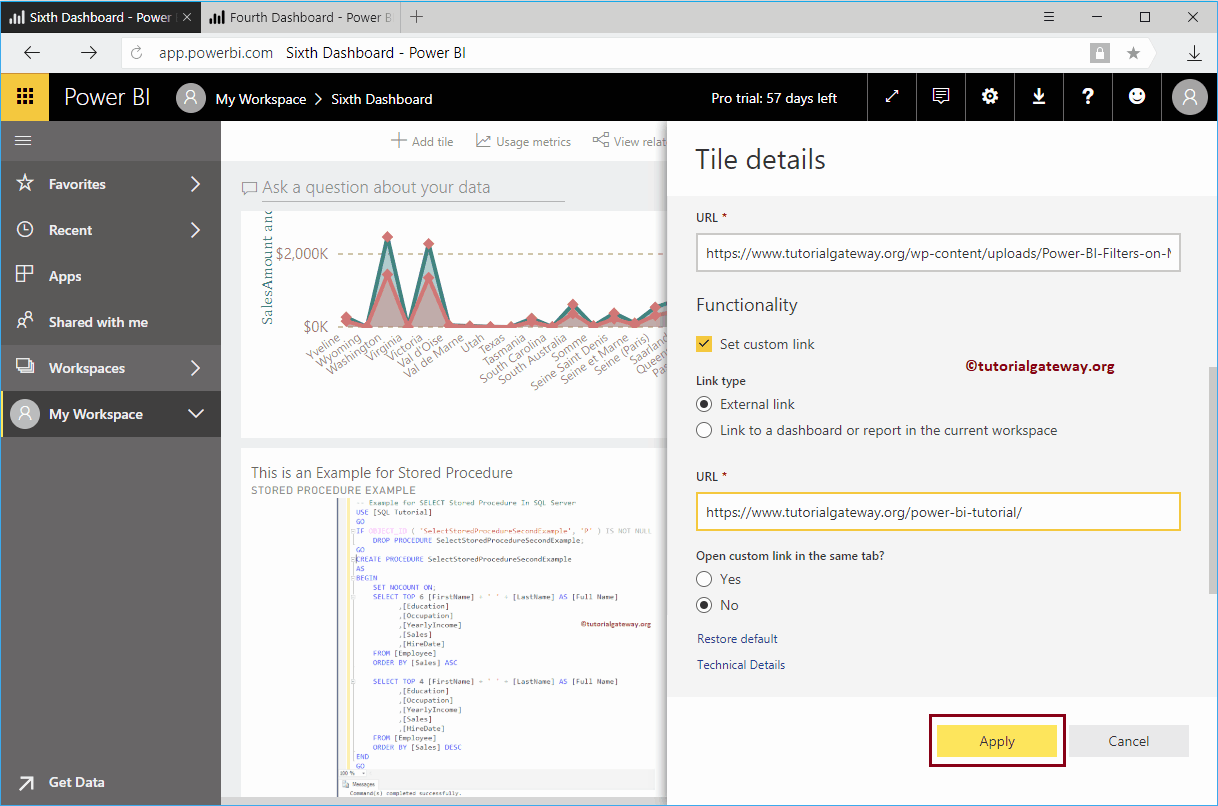
- External Link: If you select this option then you have to specify the Image URL
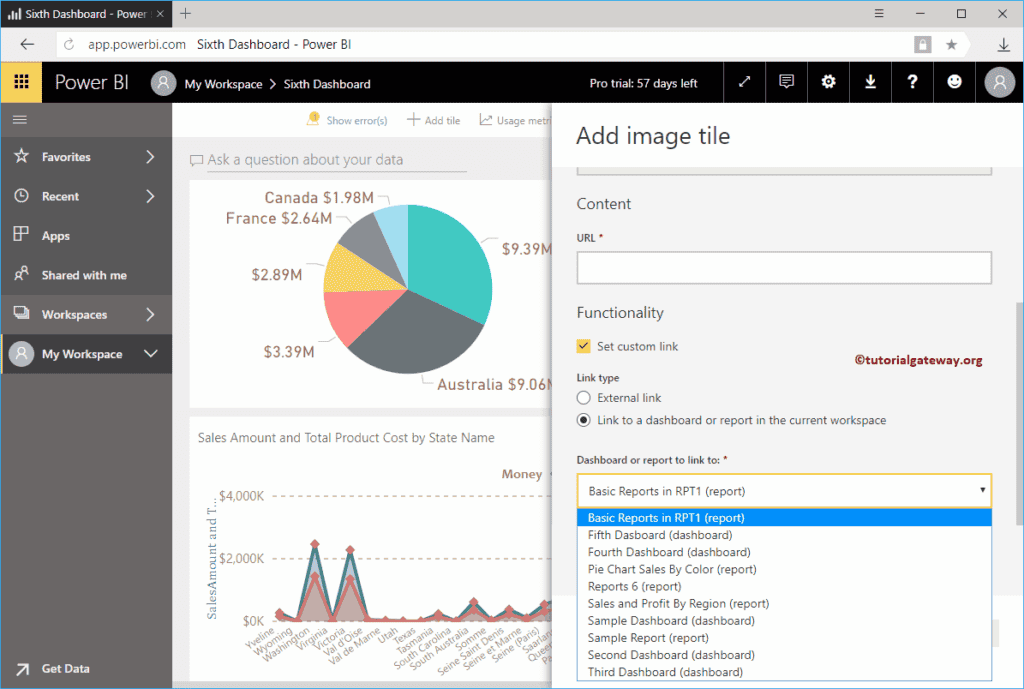
- Link to a dashboard or report in the current workspace: If you select this option then you have to select the dashboard or a report from the current workspace
- URL: Please provide the external Image URL.
If you checkmark this Set Custom Link, then the Image that we specified in our previous step remains the same. However, it creates a Hyperlink that links to another URL or another dashboard or Report.
If you select Link to a dashboard or report in the current workspace option, then you can use the Dropdown list to select the Report, or dashboard available in this workspace.
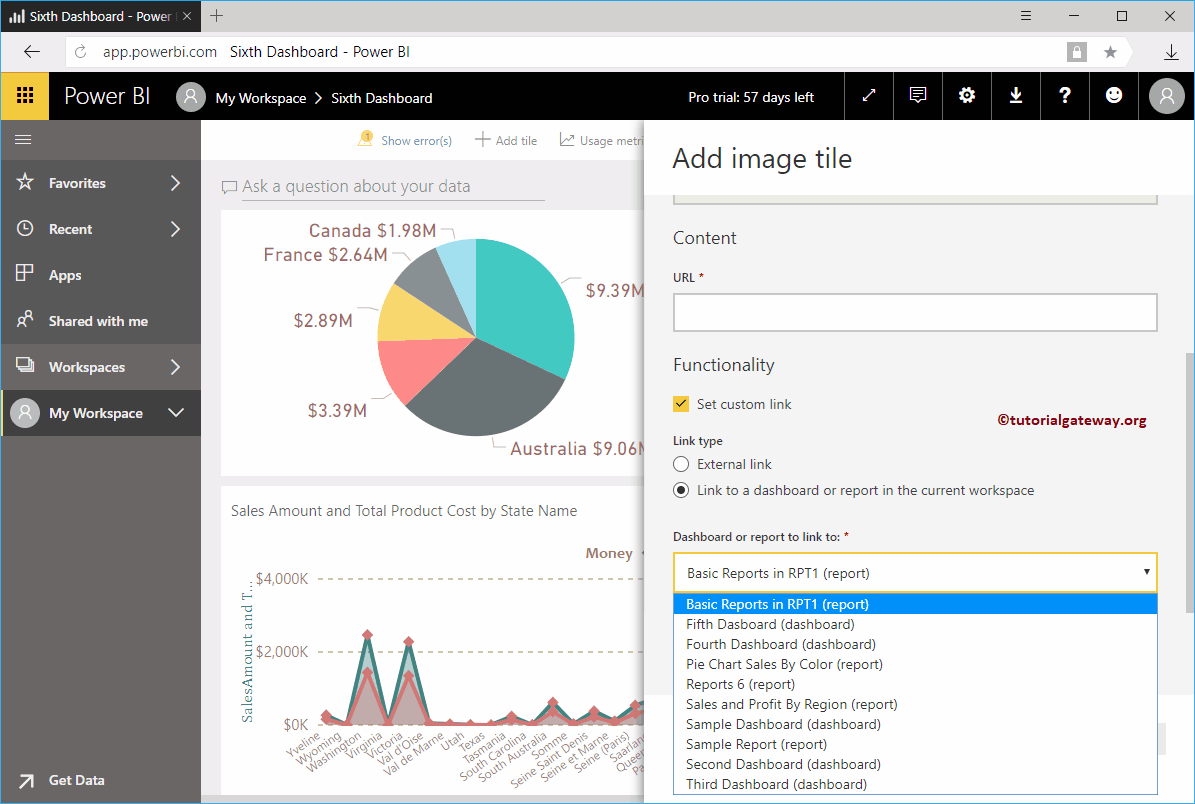
For the Add Image to Power BI Dashboard demo purpose, we were selecting Link to a dashboard or report in the current workspace option and selected the fourth dashboard.
As you can see from the screenshot below, our Image remained the same. But, if you click on the image, it takes you to the Fourth Dashboard.
Let me click on it
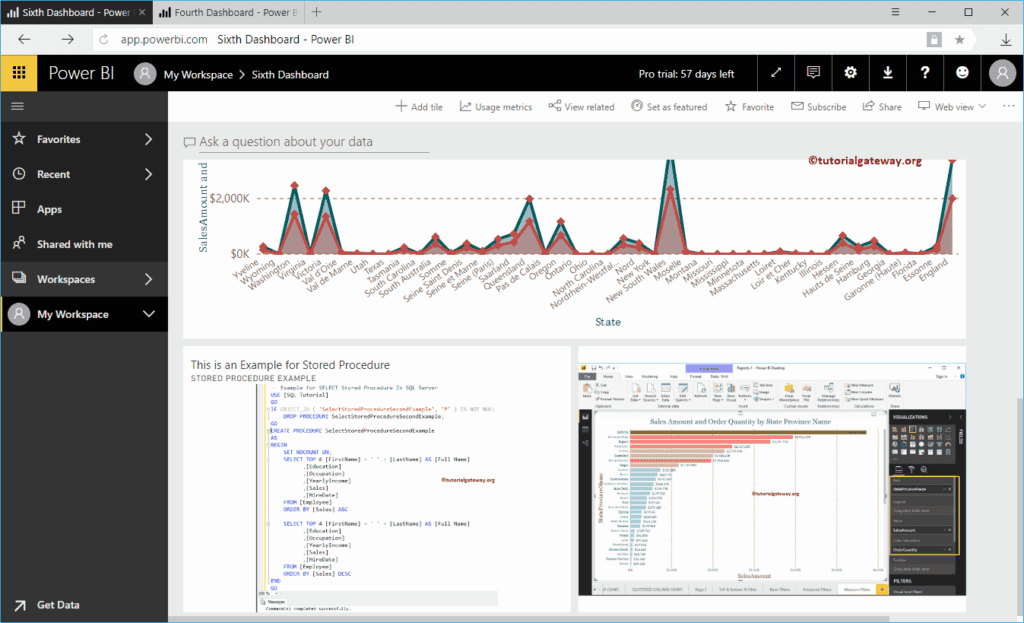
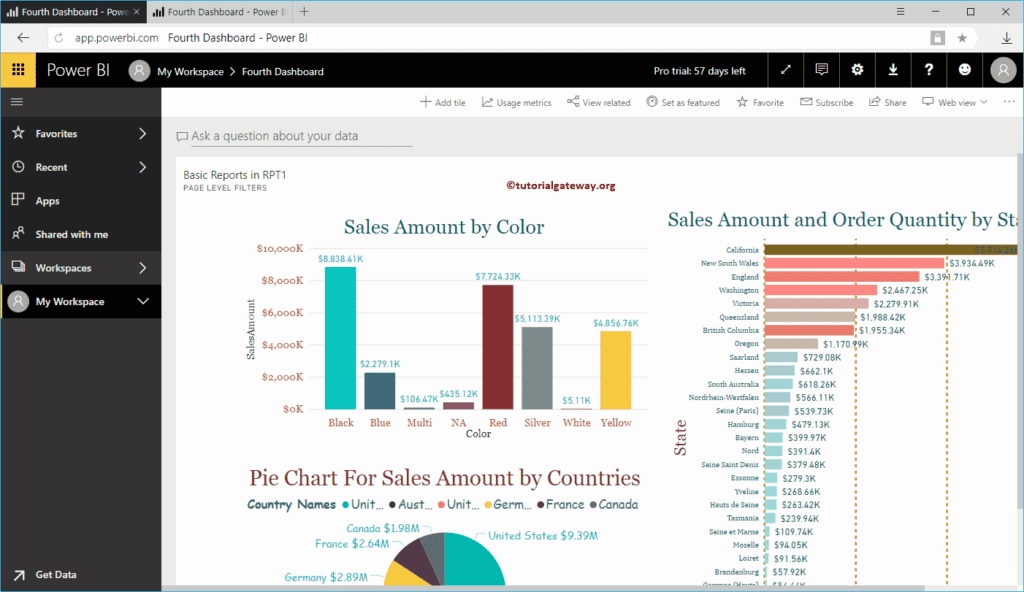
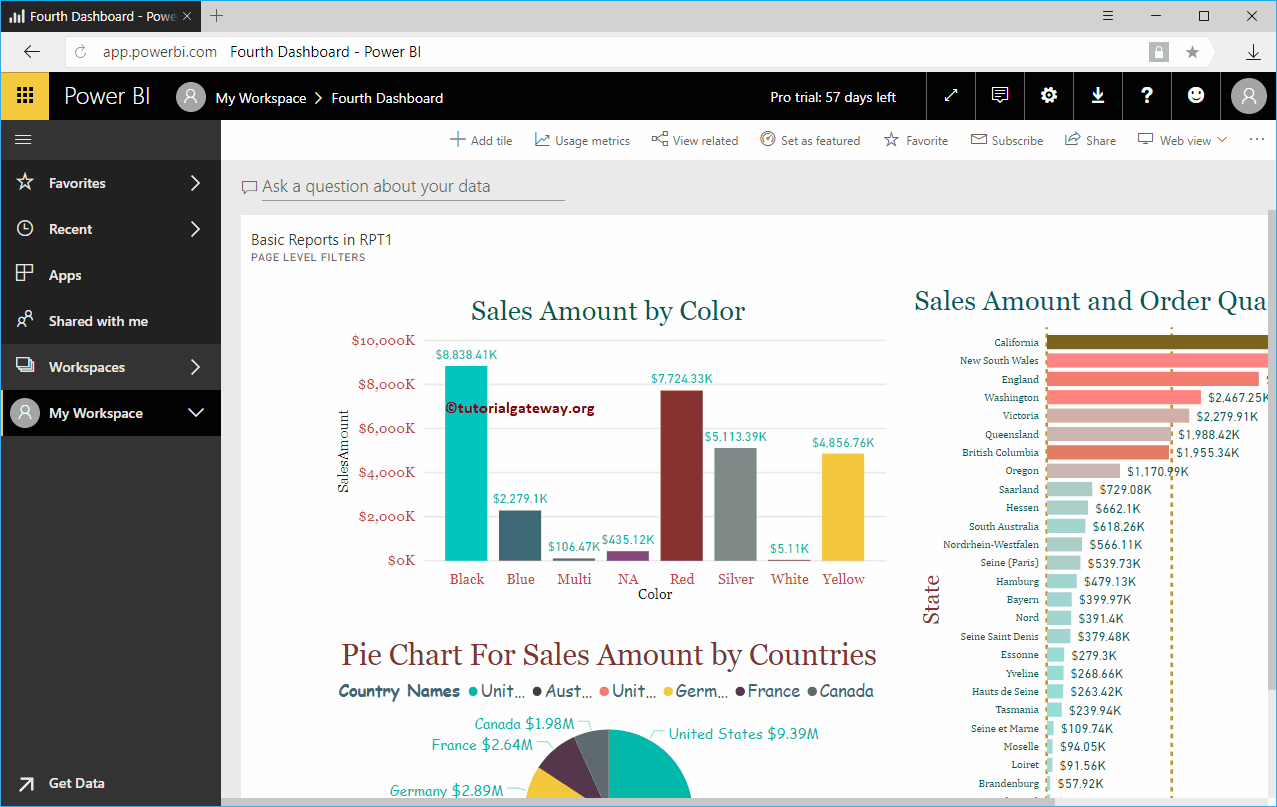
Now you can see the Fourth dashboard.
This time, we are selecting the External link and added our POWER BI link as the External link
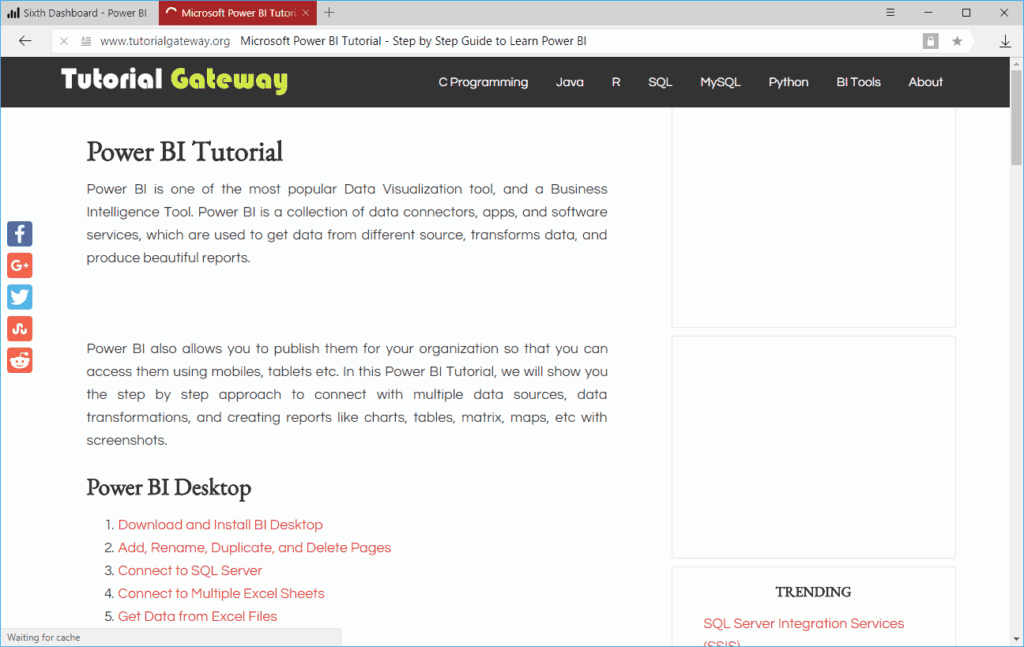
As you can see from the screenshot below, there is no change in our image. But, if you click on the image, it opens our web page
You can see the web page
Add Video to Power BI Dashboard
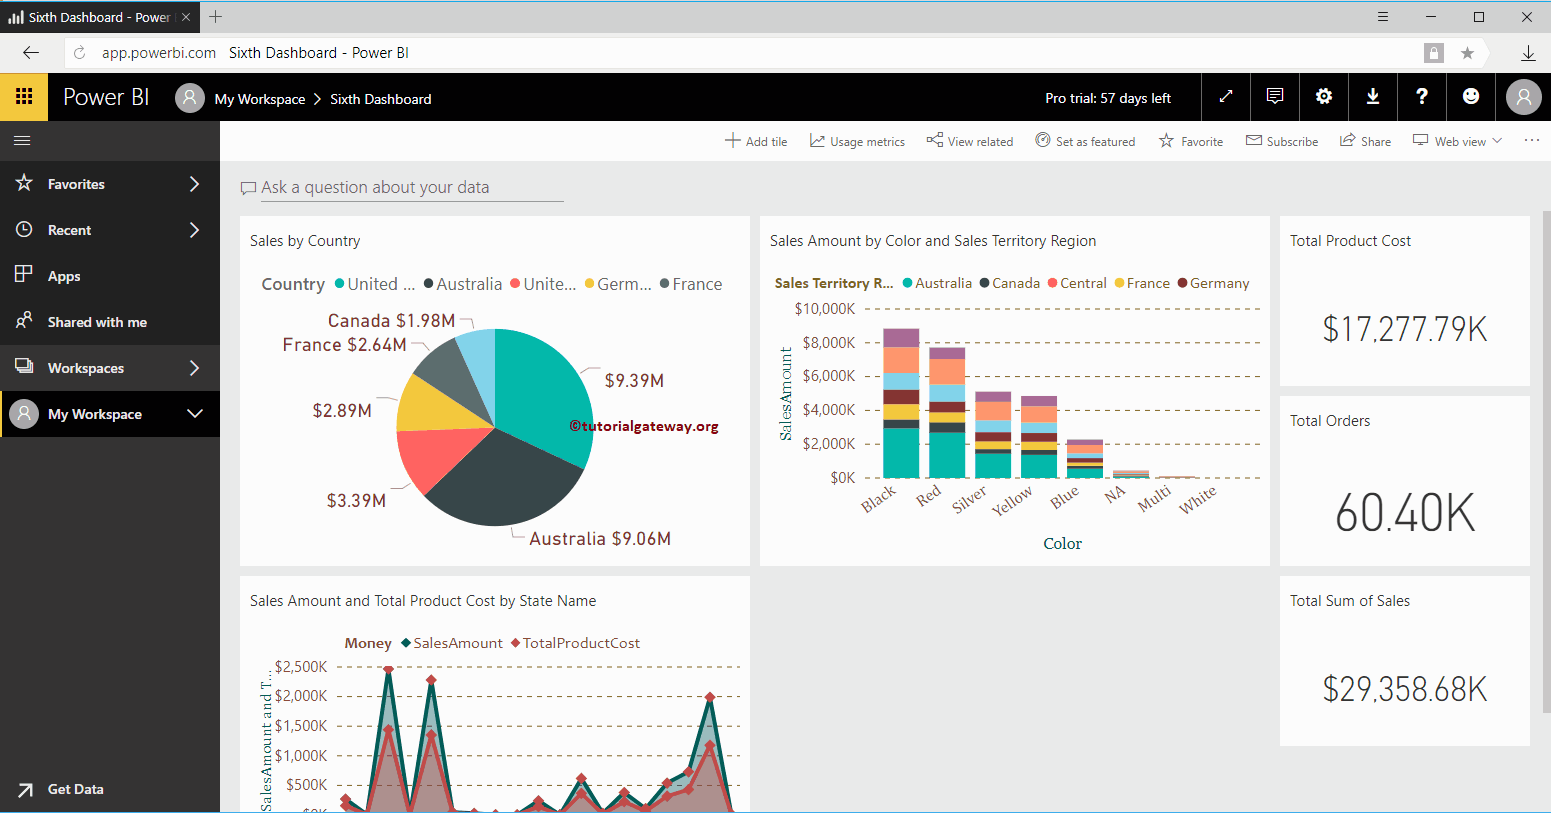
How to add Video to Power BI dashboard with a practical example?. For this Add Video to Power BI Dashboard demonstration, we are going to insert a YouTube video into the Sixth dashboard that we showed below.
How to add Video to Power BI Dashboard
In order to add Vimeo or YouTube video to the existing Power BI dashboard, please click on the Add tile button
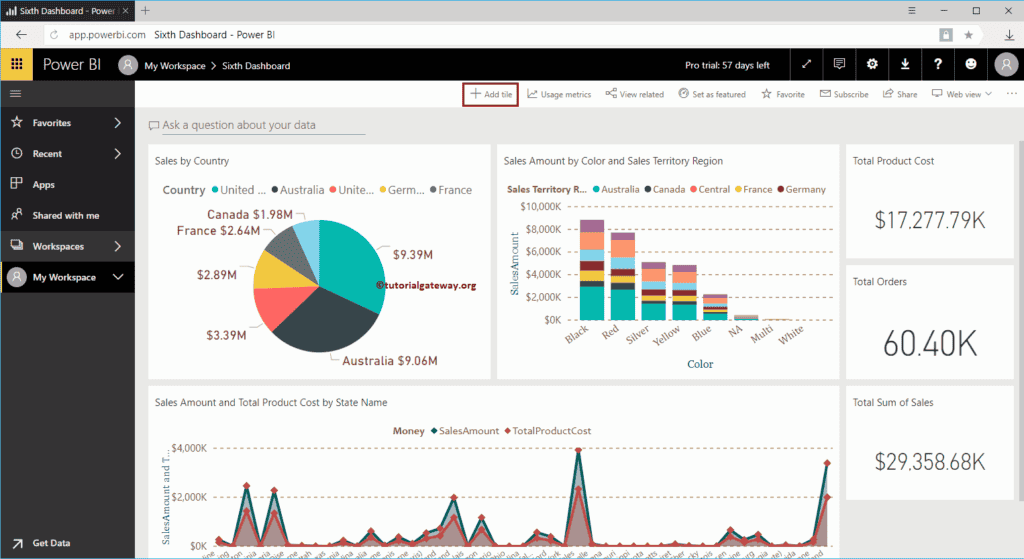
Clicking on the Add tile button opens the following window. Please select the Video under the Media section and click the Next button.
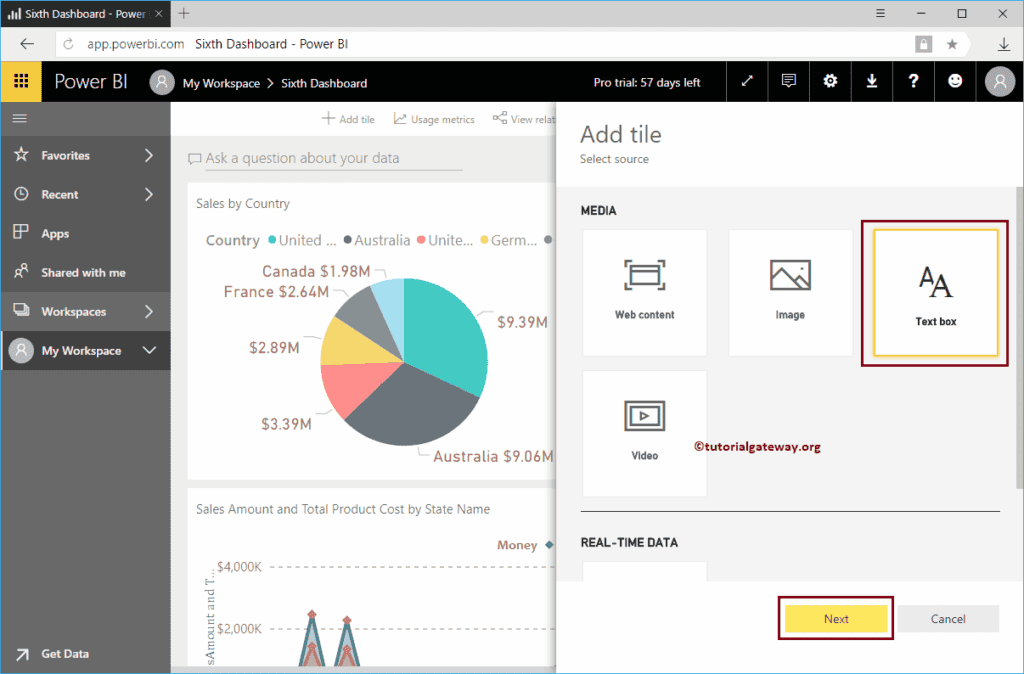
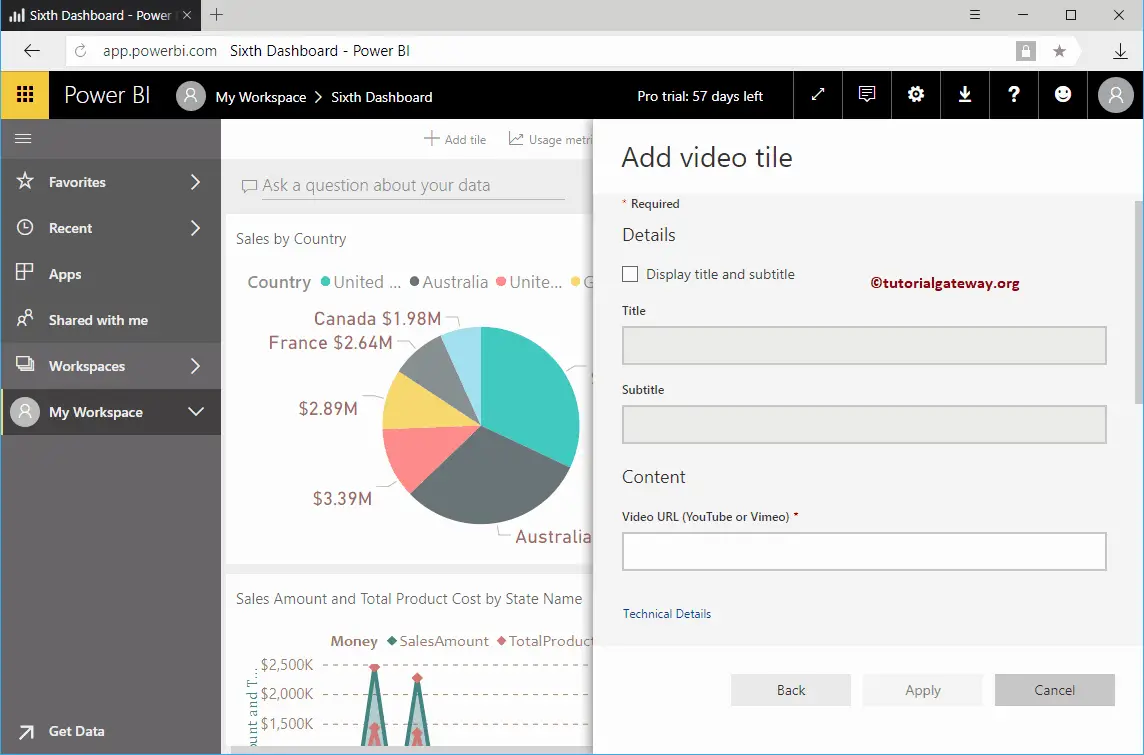
Under the Add Video to Power BI Dashboard tile section, we have
- Display Title and subtitle: Please checkmark this option to display the Video title and subtitle.
- Title: Specify the Video title
- Subtitle: Provide the subtitle for this video
- Video URL: Please provide the video URL. Remember, it only accepts YouTube or Vimeo videos
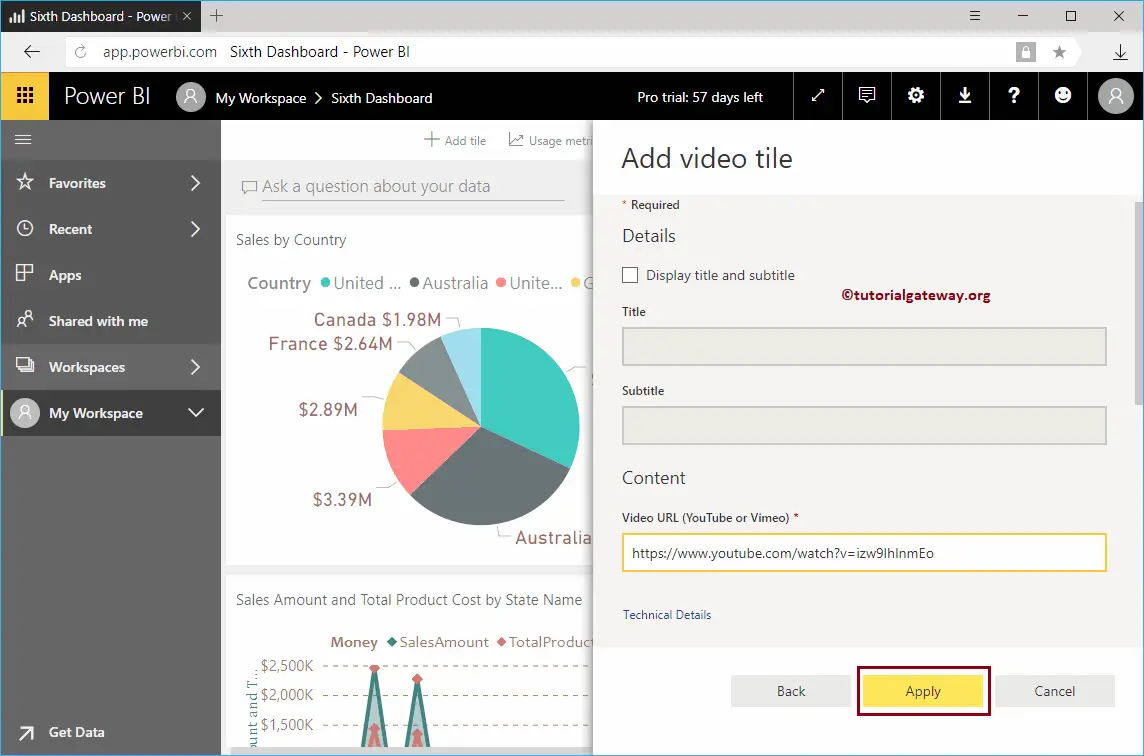
In this Power BI example, we want to insert or add a YouTube video to the Power BI dashboard. So, we added the iPhone X video. Click the Apply button.
Now you can see the Video inside our Power BI Dashboard.
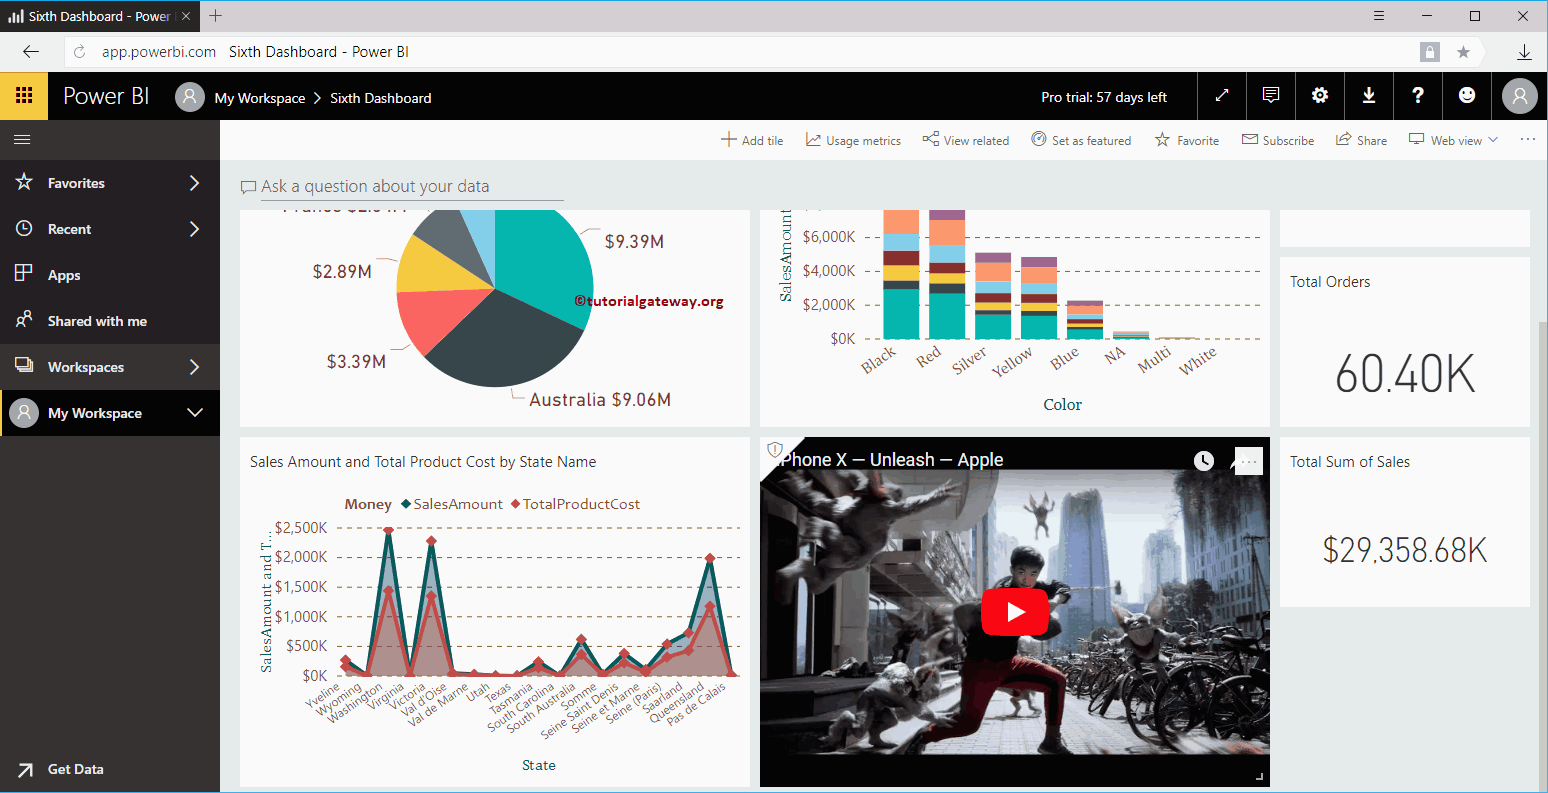
By clicking that marked section, the video pops out of the Dashboard and play on the bottom left corner
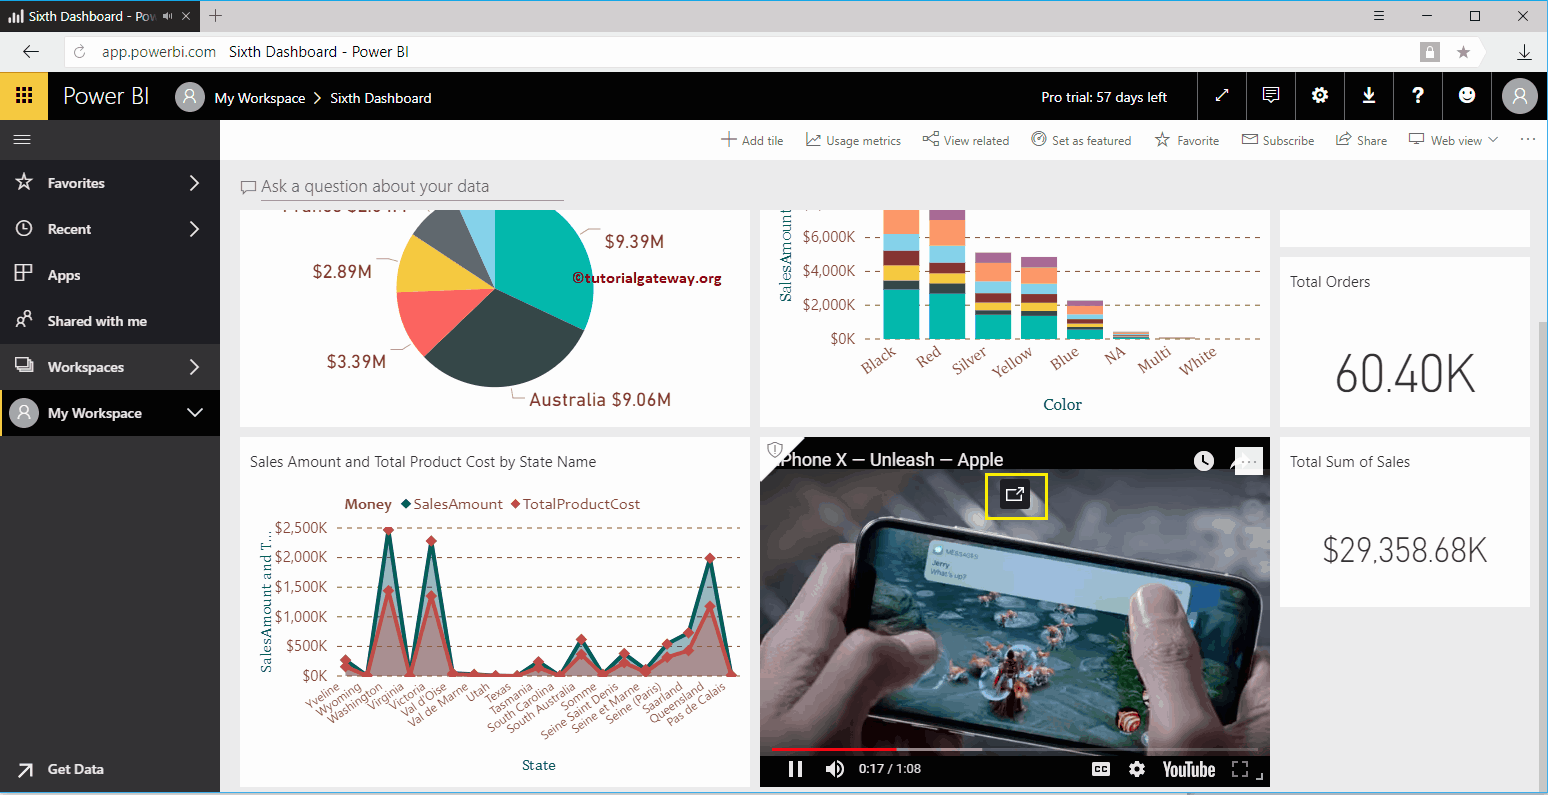
Let me edit the Video tile
As you can see from the below screenshot, it has few more options inside it
- Set Custom Link: Please checkmark this option to provide a custom link to this Video.
- External Link: If you select this option, you have to specify the Video URL
- Link to a dashboard or report in the current workspace: If you select this option, then you have to select the dashboard or a report from the current workspace
- URL: Please provide the external video URL.
If you checkmark this Set Custom Link, then the YouTube video that we specified in our previous step remains the same. However, it creates a hyperlink that links to another Video or another dashboard or Report.
Let me add another video as the External link
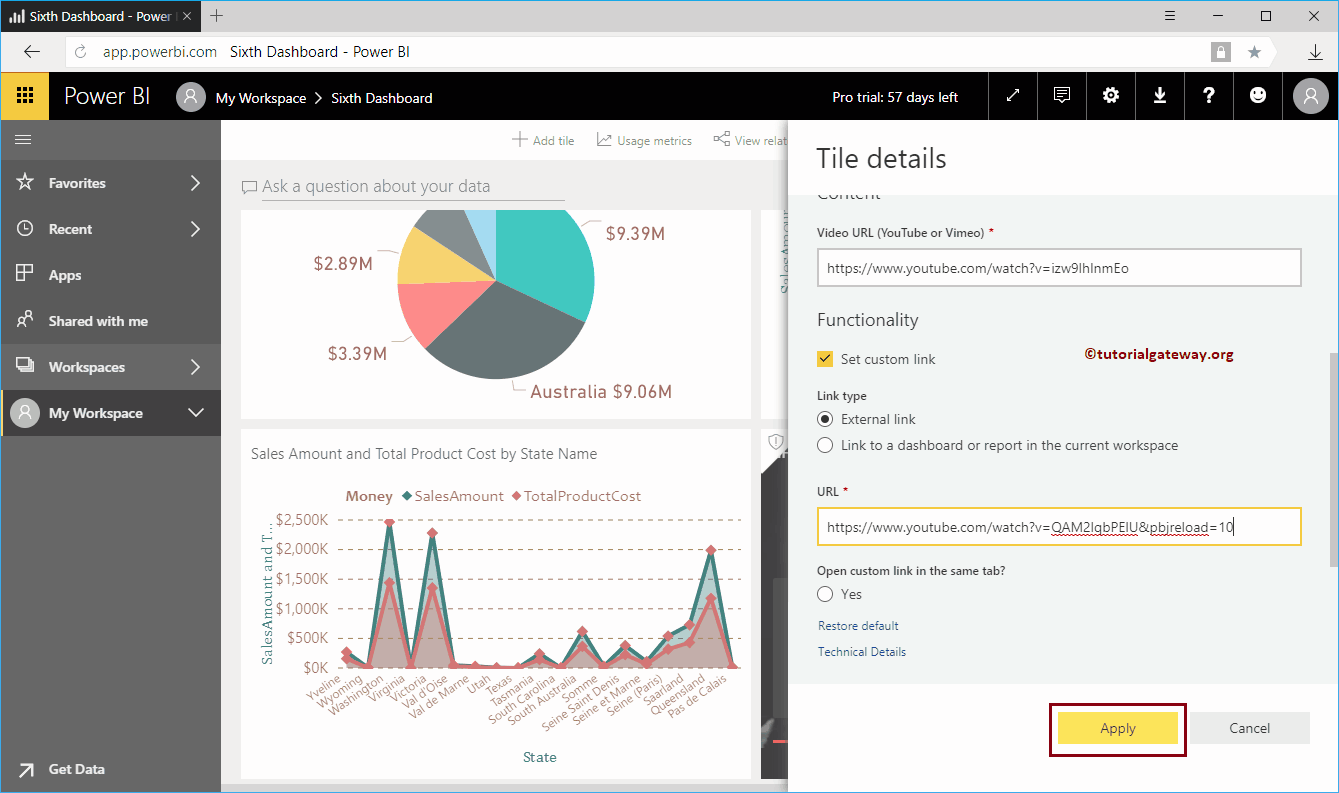
As you can see from the screenshot below, our iPhone X video remained the same. But, if you click the … on the top right corner, it shows the Open Hyperlink option.
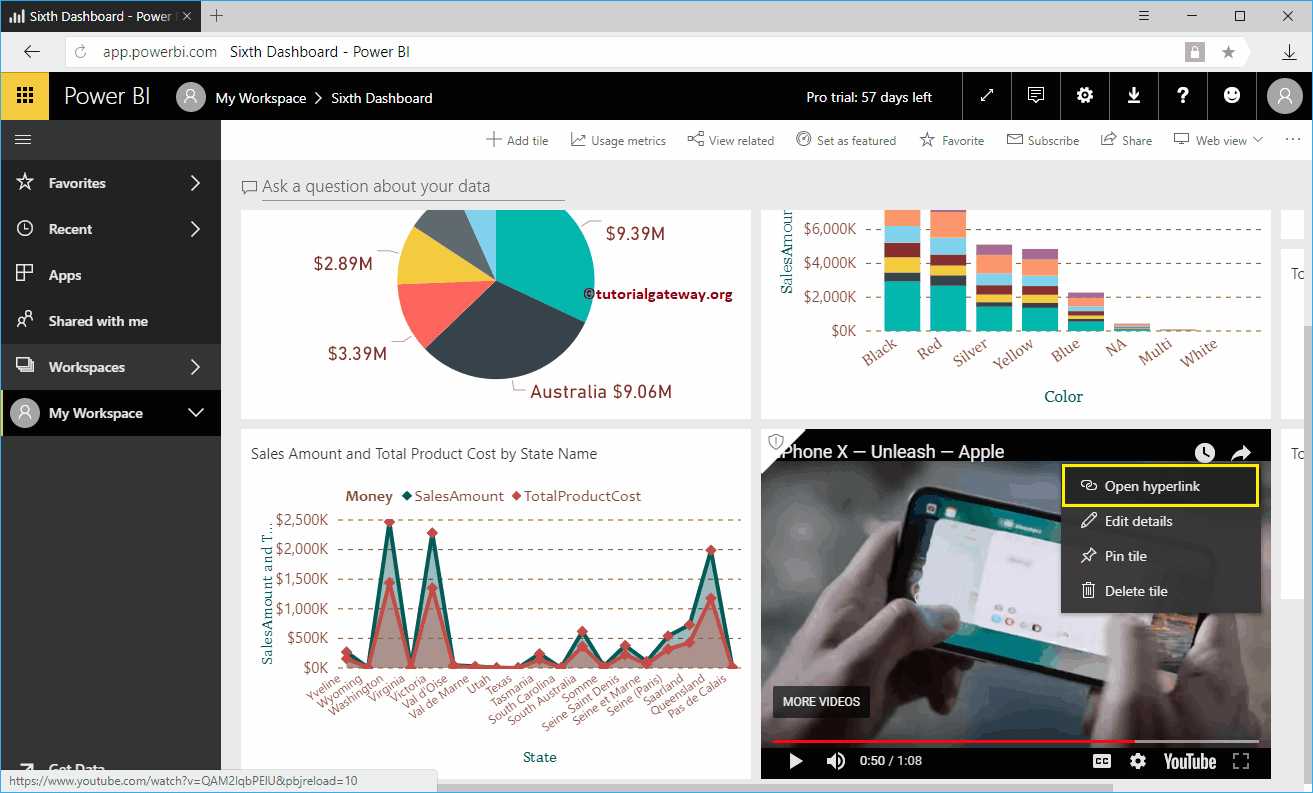
Selecting that option opens YouTube with another video.
Add Web Content to Power BI Dashboard
Let me show you how to add Web Content to Power BI dashboard with a practical example. For this Add Web Content to Power BI Dashboard demonstration, we are going to insert custom HTML code into the Sixth dashboard that we showed below.
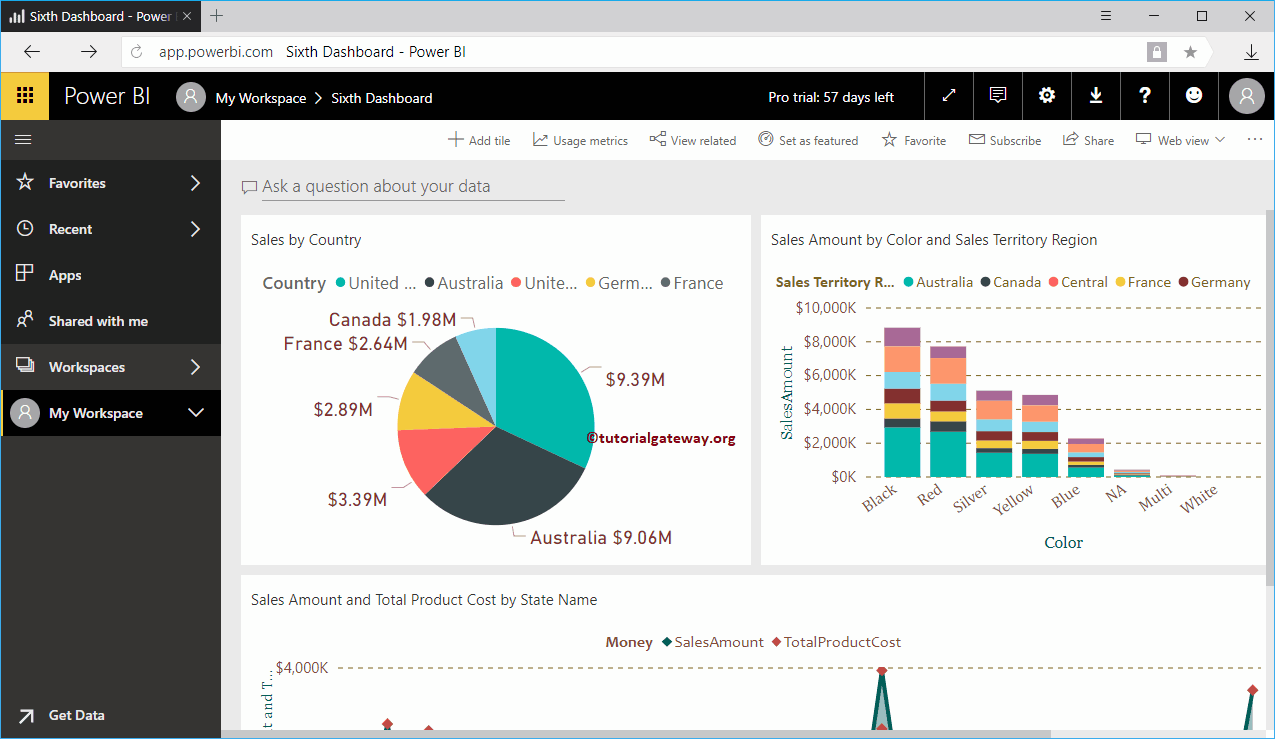
How to add Web Content to Power BI Dashboard
In order to add custom HTML code or Web Content to Power BI dashboard, please click on the Add tile button
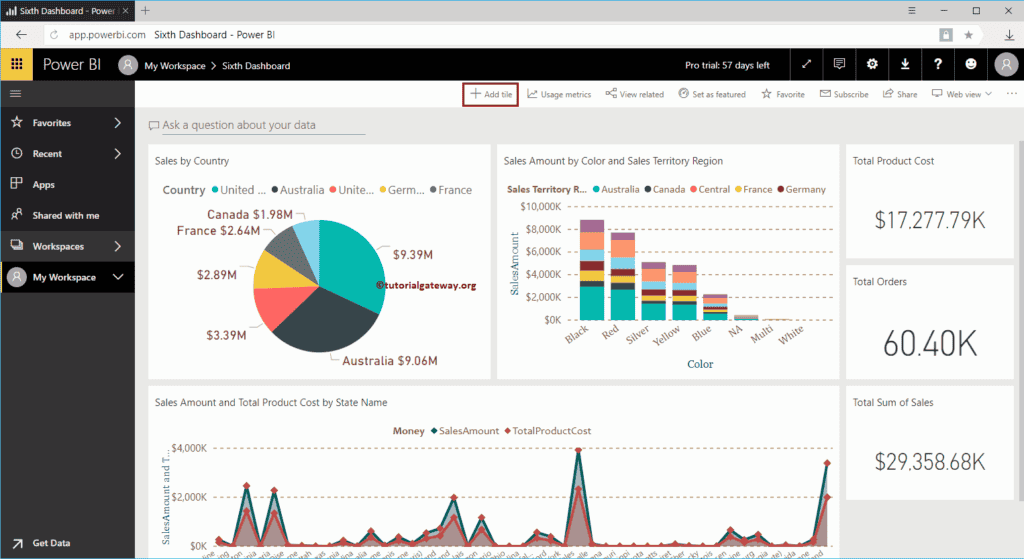
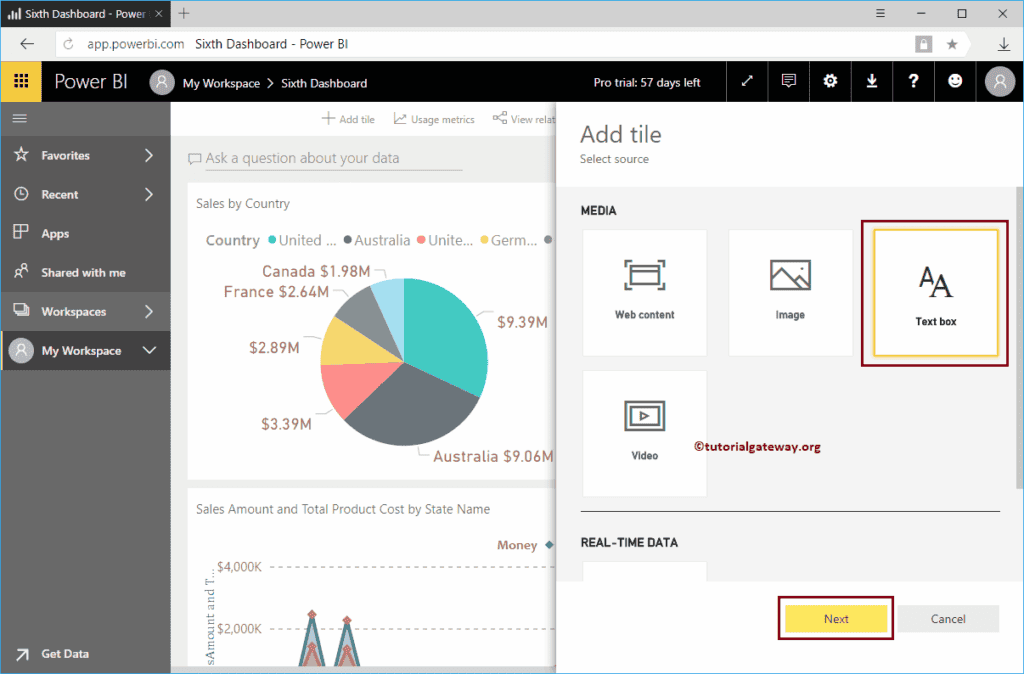
Clicking on the Add tile button opens the following window. Please select the Web Content under the Media section, and click Next button
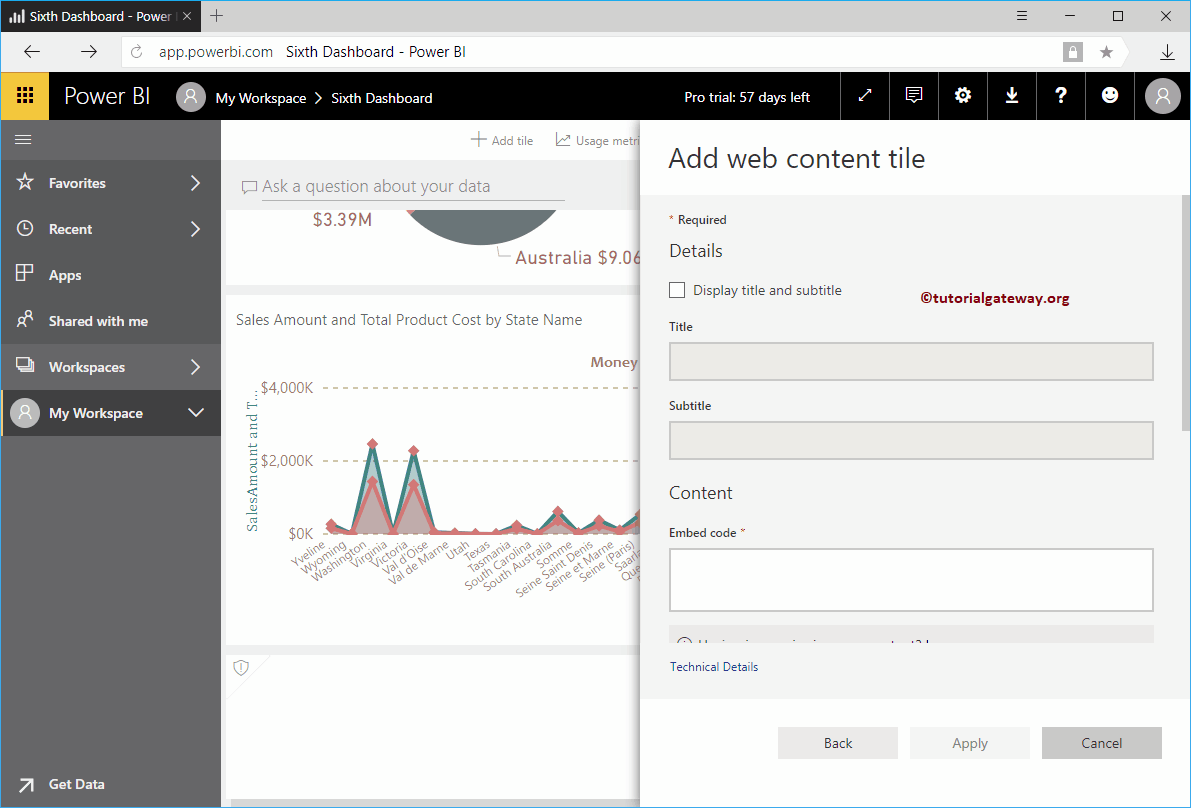
Under the Add Web Content to Power BI Dashboard tile section, we have
- Display Title and subtitle: Please check mark this option to display the Web Content title and subtitle.
- Title: Specify the Web Content title
- Subtitle: Please provide the subtitle for this Web Content
- Embedded Code: You can write your custom in this Power BI text box
As you can see from the screenshot below, we added the Title, Subtitle, and added HTML code (one heading, one paragraph). Next, click the Apply button.
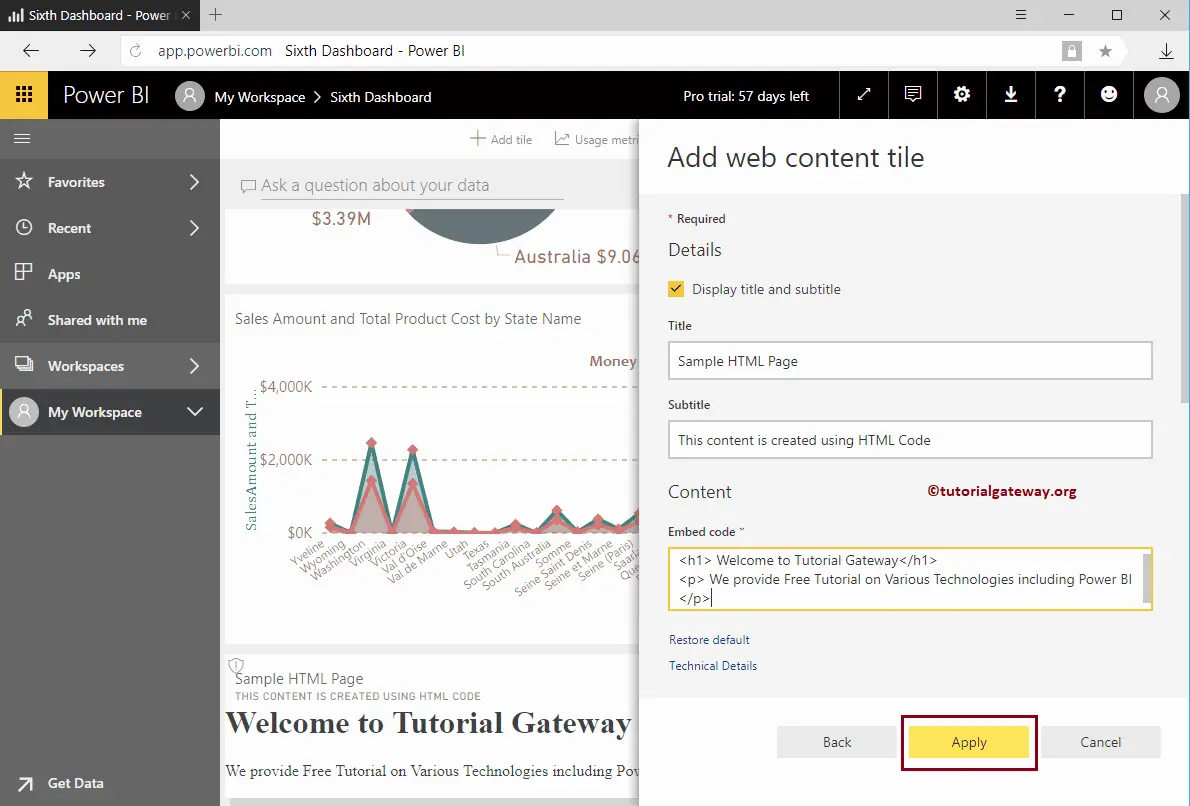
Now you can see the HTML Page inside our Dashboard.
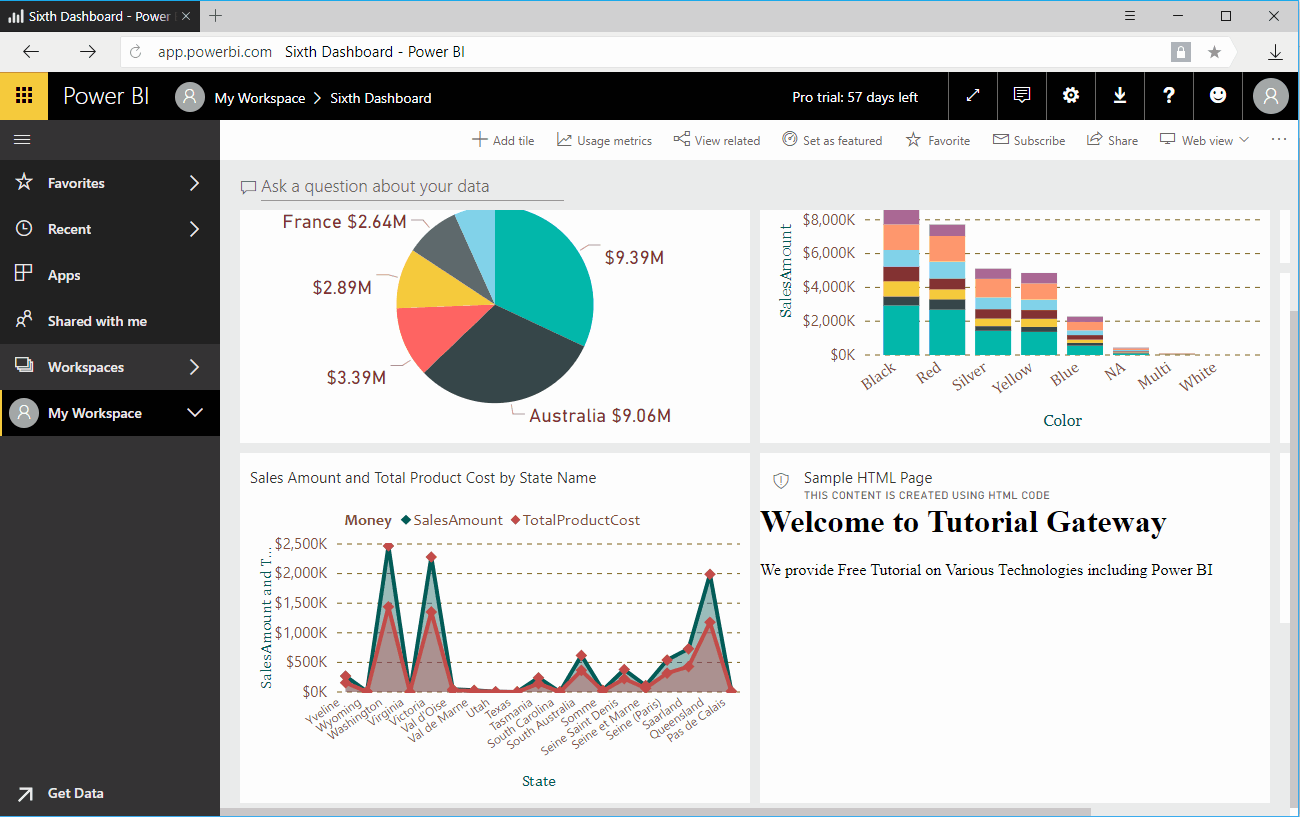
Let me edit the Web Content tile
As you can see from the below screenshot, it has few more options inside it
- Set Custom Link: Please check mark this option to provide a custom link to this Web Content.
- External Link: If you select this option then you have to specify the External URL
- Link to a dashboard or report in the current workspace: If you select this option then you have to select the dashboard or a report from the current workspace
- URL: Please provide the external video URL.
If you checkmark this Set Custom Link, then Web Content (HTML Code) that we specified in our previous step remains the same. However, it creates a hyperlink that links to another Web Page, or another dashboard or Report.
Let me add our POWER BI link as the External link
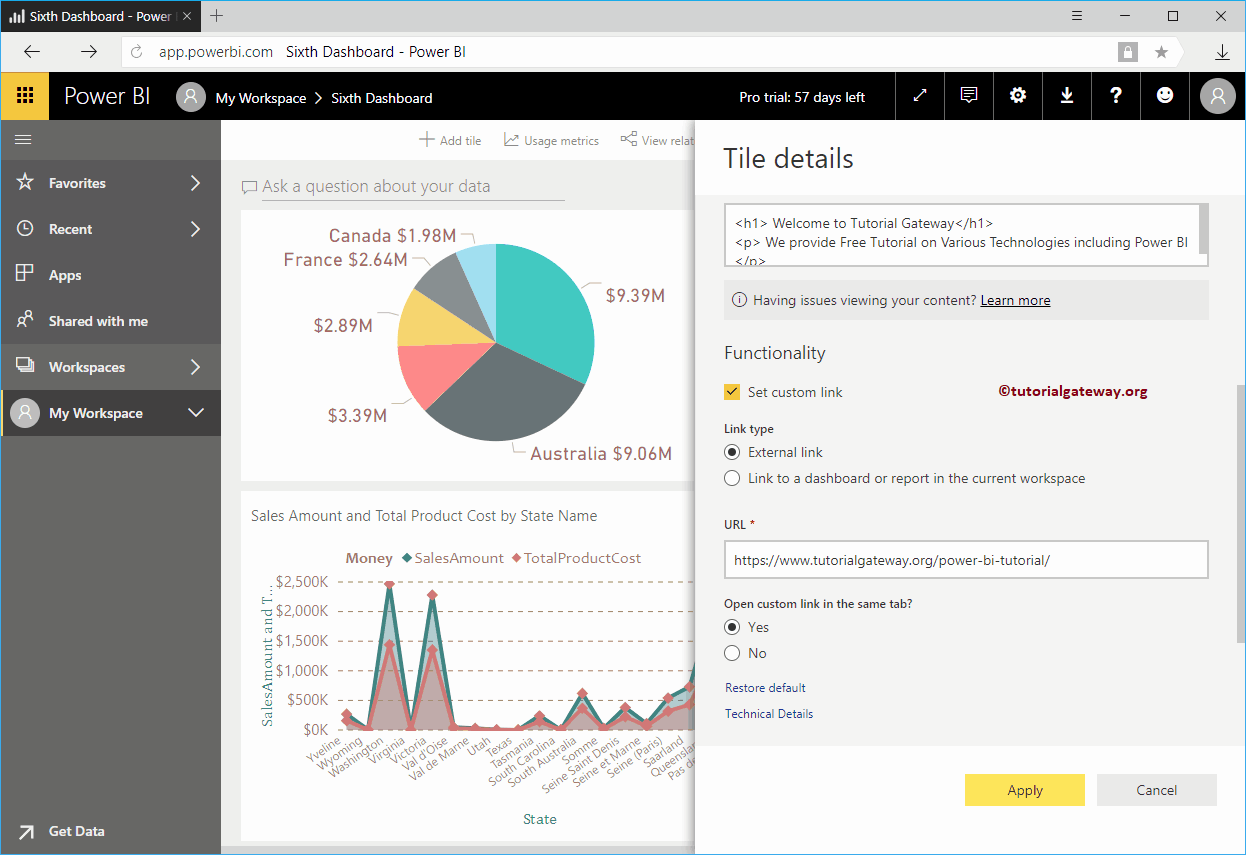
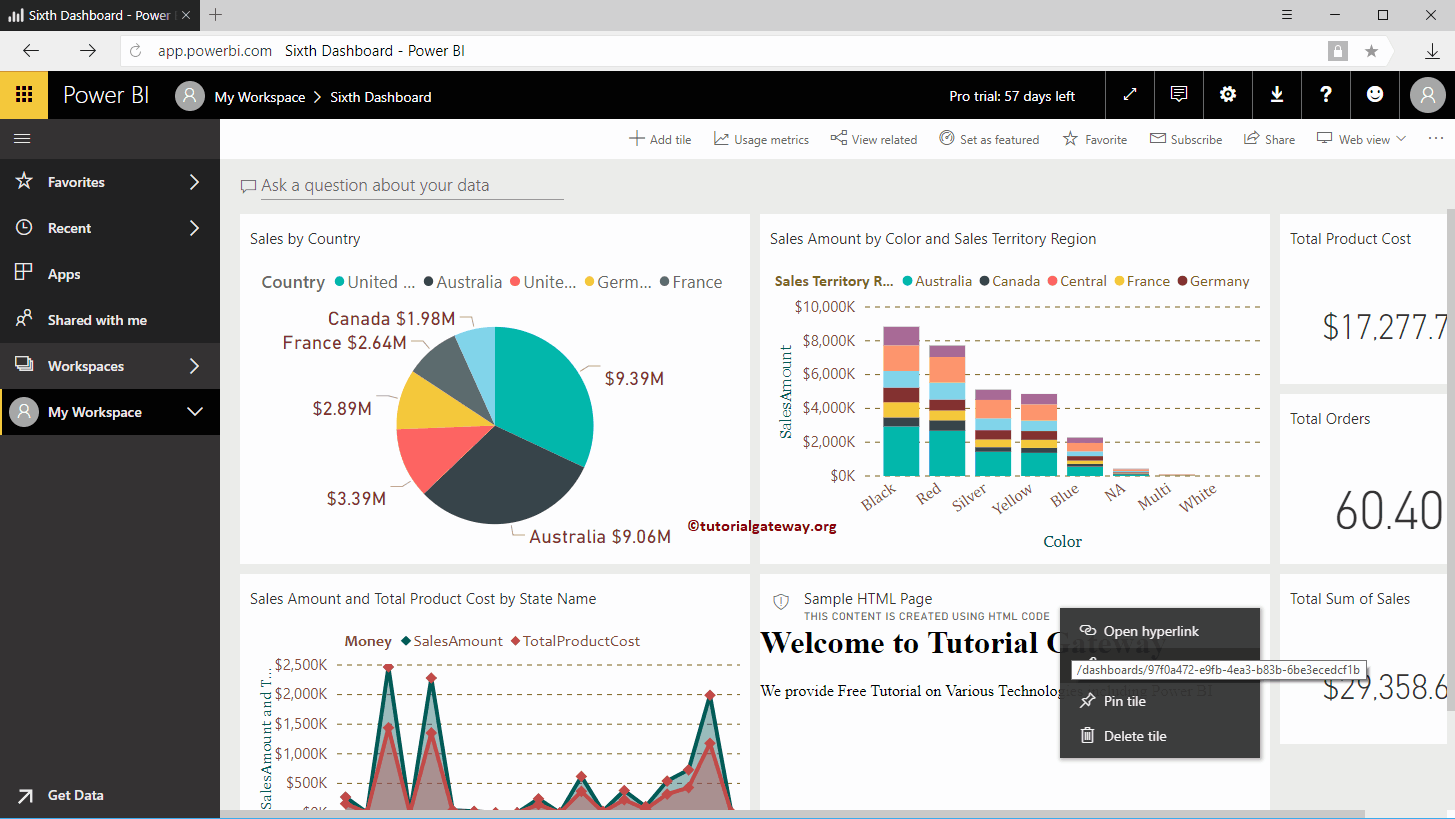
As you can see from the screenshot below, our custom HTML page remains the same. But, if you click the … on the top right corner, it shows you the Open Hyperlink option. Hover over this option reveals the link that targeted.
Selecting that option opens the custom link that we provided while adding Web Content to Power BI Dashboard.
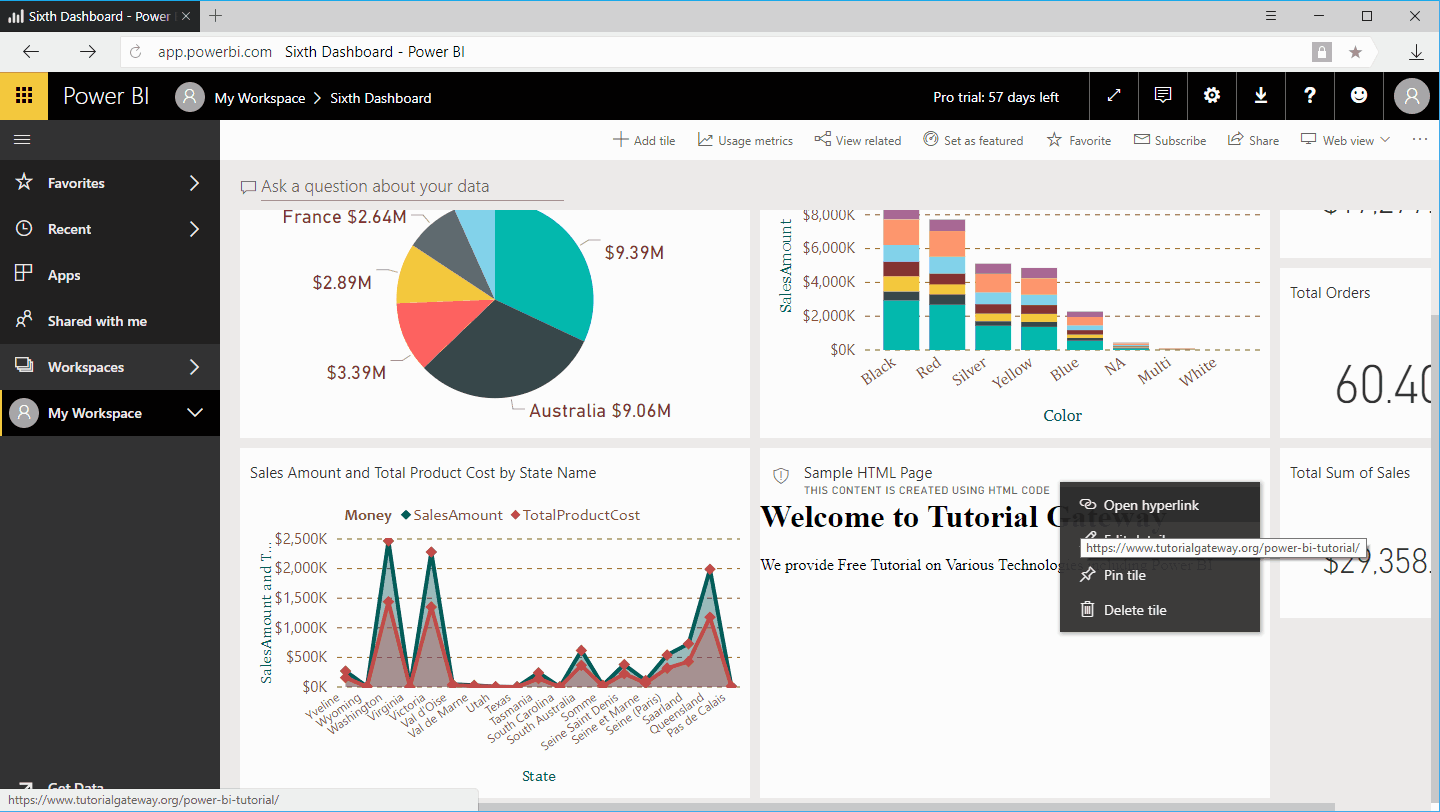
This time we are selecting Link to a dashboard or report in the current workspace option, and selected fourth dashboard
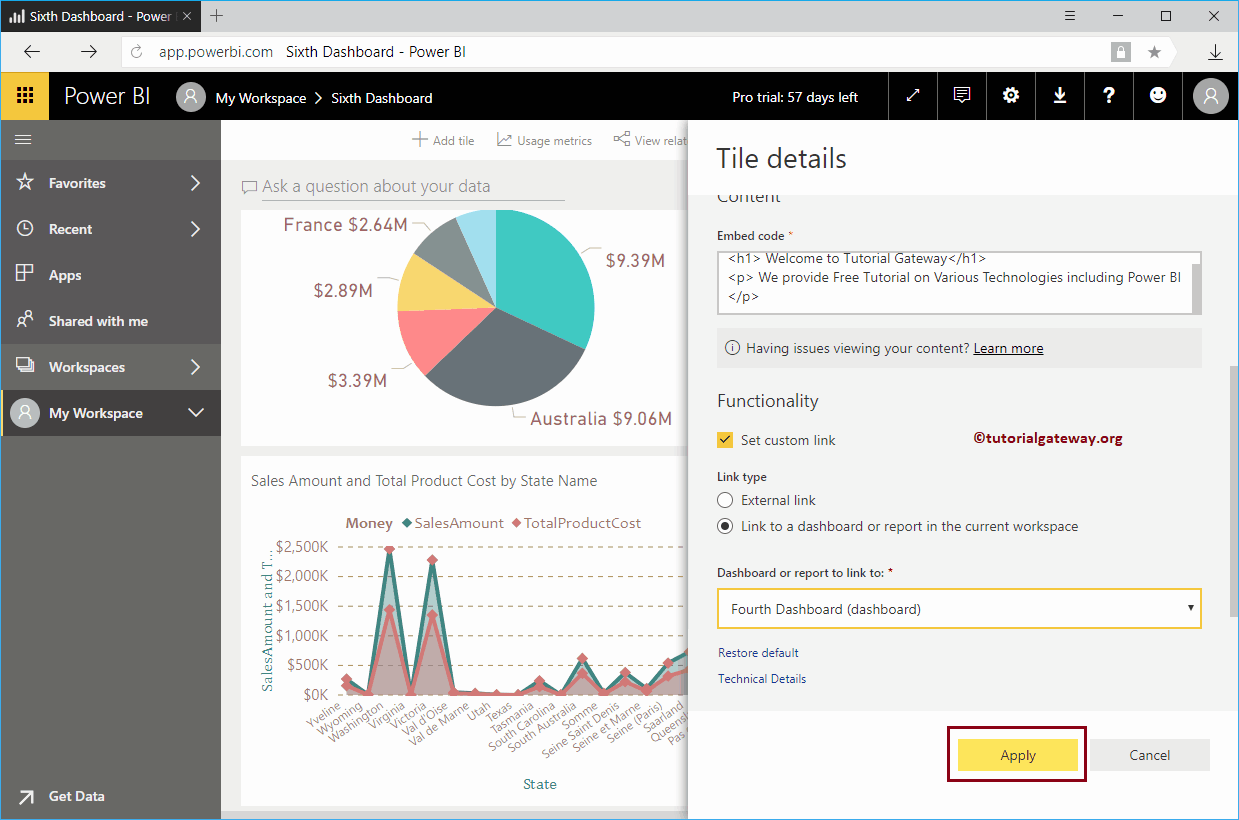
As you can see from the screenshot below, if you click the … on the top right corner of the Power BI web content, it shows you the Open Hyperlink option. Let me click this link
Now you can see the Fourth dashboard.
Power BI Dashboard Settings
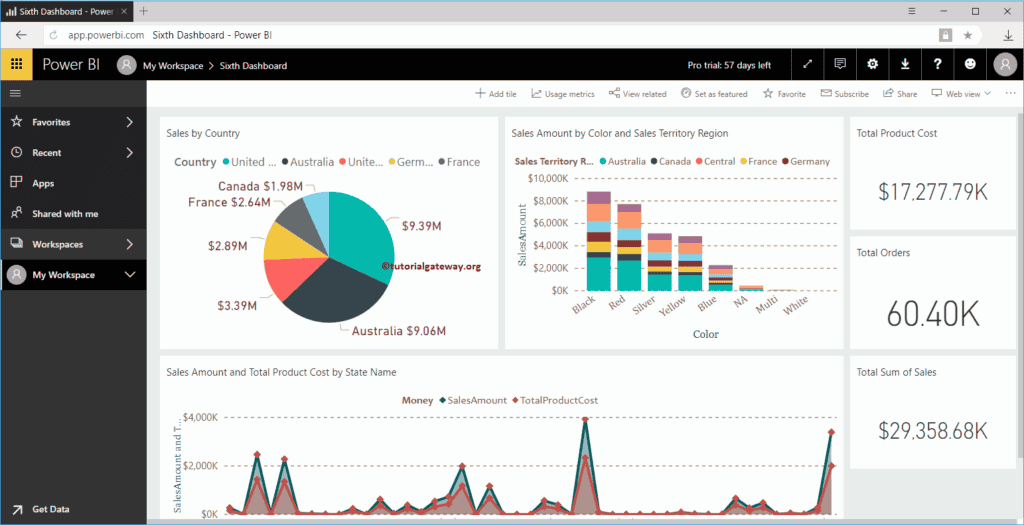
In this article, we show you the list of Power BI Dashboard Settings that are available for you. For this demonstration, we are going to use Sixth Dashboard available in my Power BI workspace.
Power BI Dashboard Settings
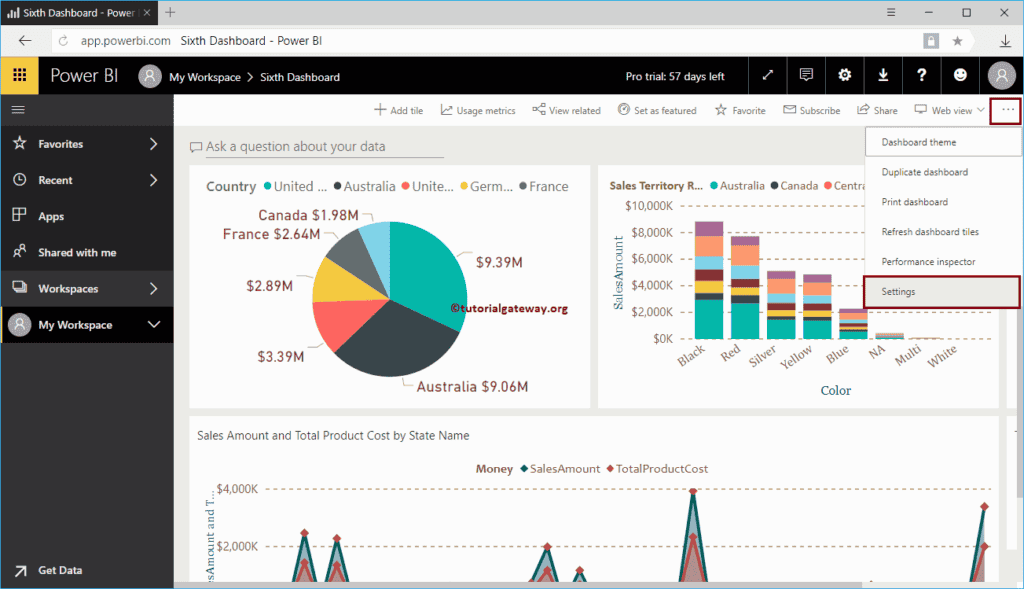
To change this Power BI dashboard settings, click on the … button on the top right corner, as we showed below. Next, select the Settings option from the context menu.
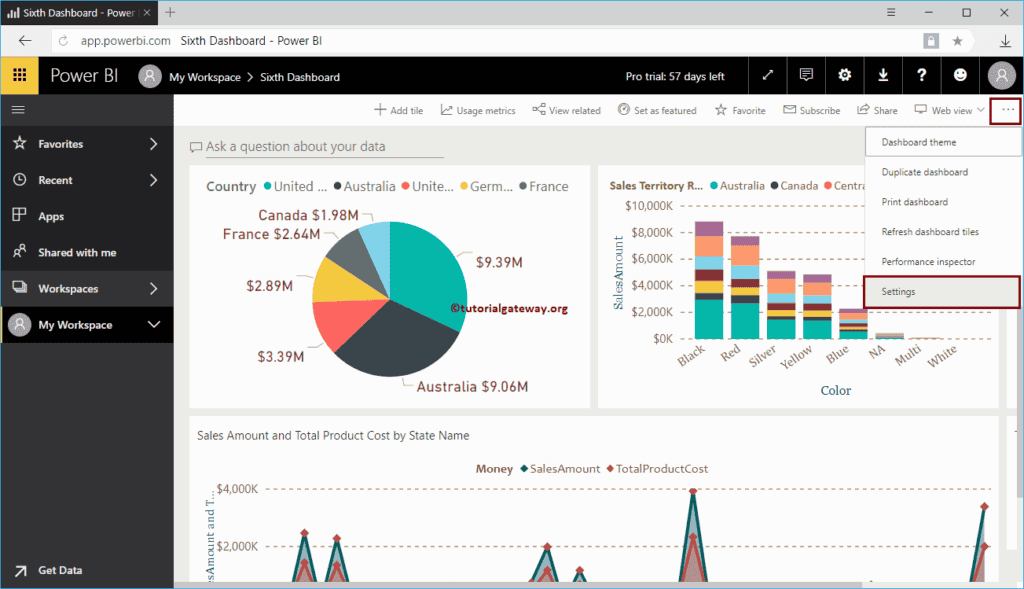
Select the Settings option open the dashboard settings window.
- Dashboard Name: You can change the dashboard name.
- Q&A: It allows the user to ask questions about the data. It is very useful to generate complete visuals by using natural language.
- Dashboard tile flow: If you enable this option, then the Power BI dashboard automatically adjusts the position of the tiles.
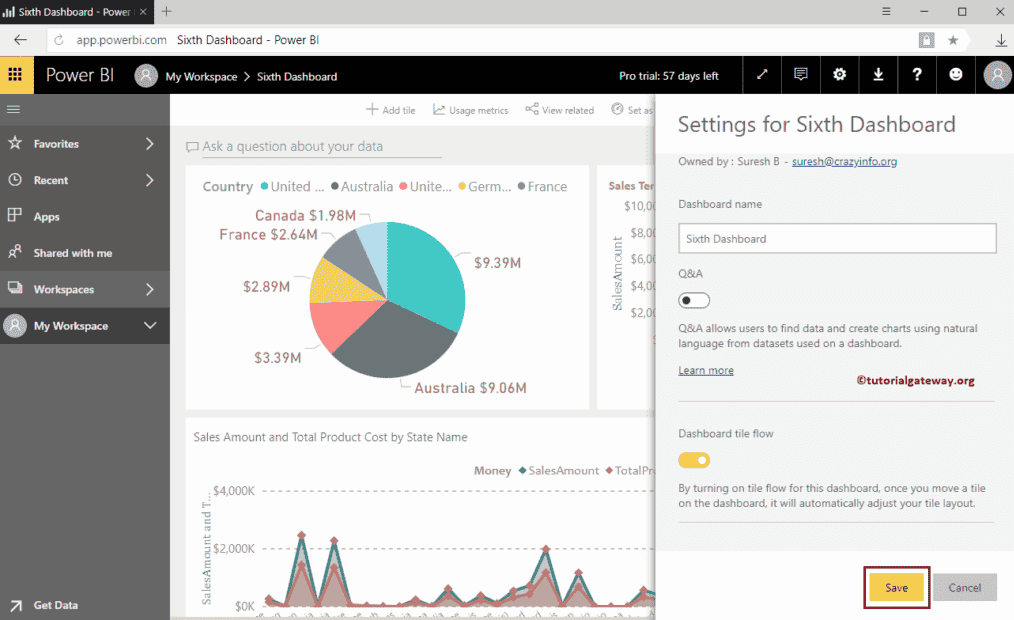
Let me Toggle Q&A to off, and Dashboard tile flow to on
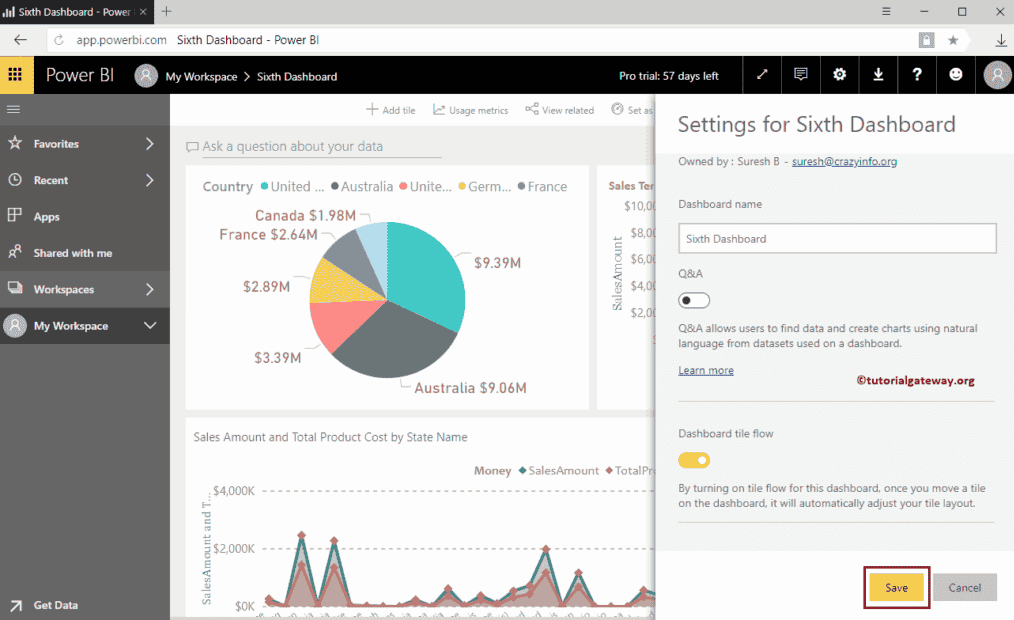
As you can see from the screenshot below, Ask a question about your data removed from the dashboard. Note, I was unable to capture the tile flow.
Trust me. It works
Delete Power BI Dashboard
Let me show you the step by step approach to Delete Power BI dashboard with a practical example. Before we start deleting a dashboard, let me show you the existing dashboards in my Power BI workspace.
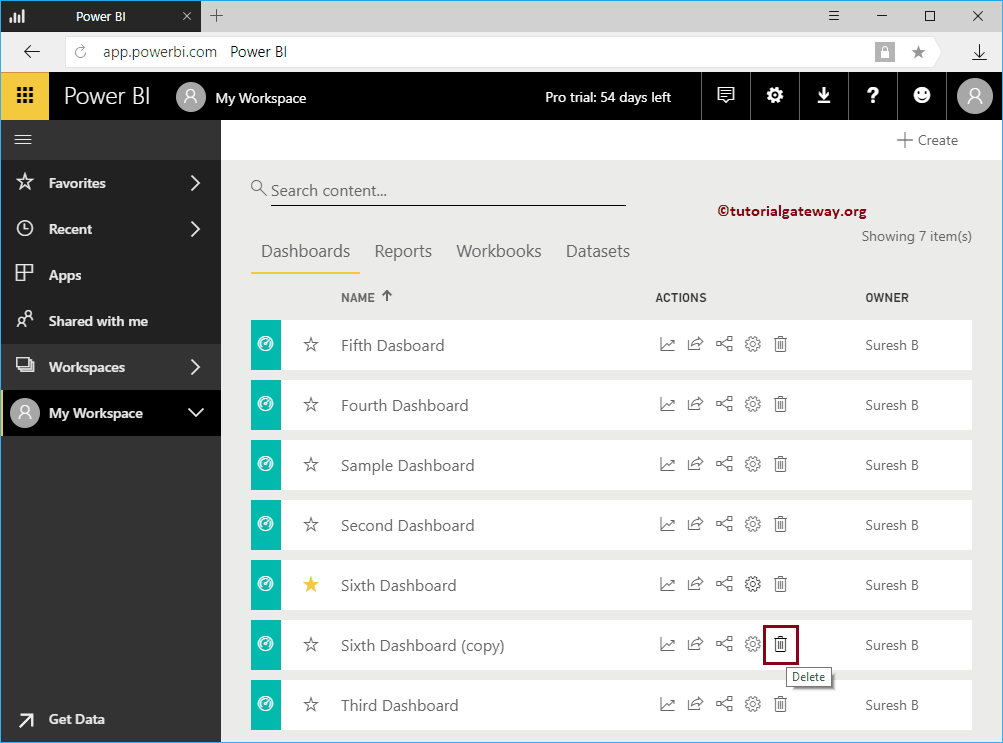
To view them, please click on the Power BI My Workspace, and then go to the dashboards tab. From the screenshot below, you can see that there are seven dashboards.
In this example, we will Delete the Sixth Dashboard ( Copy ). It is just a copy of the sixth dashboard.
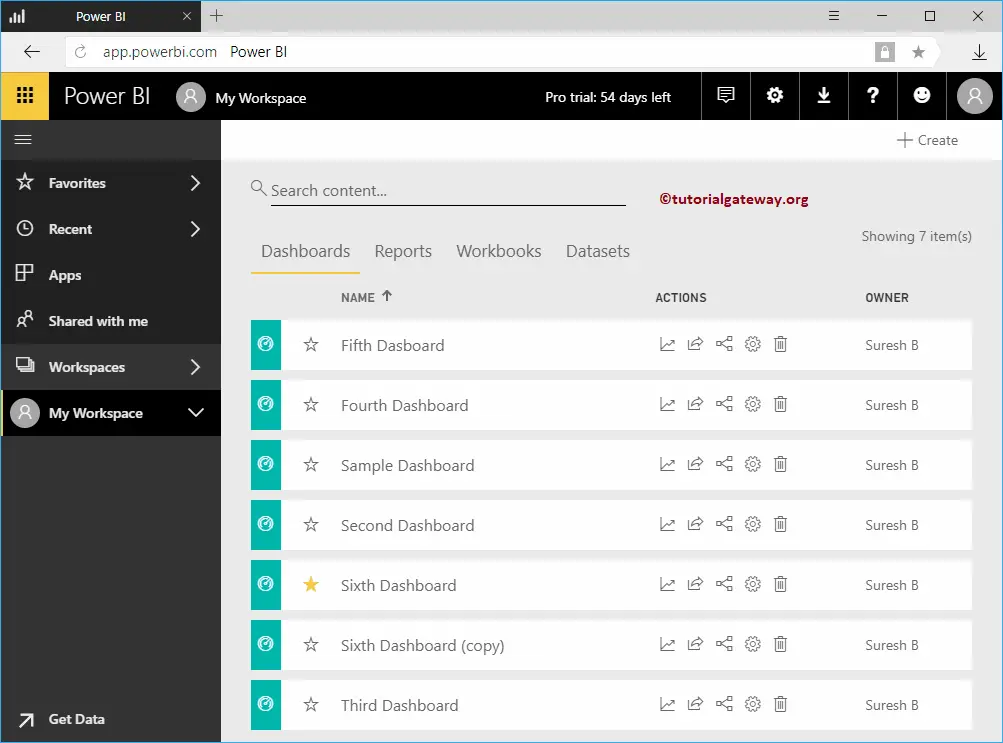
How to Delete Power BI Dashboard
To Delete a Dashboard, click on the Delete button under the Actions section as we shown below.
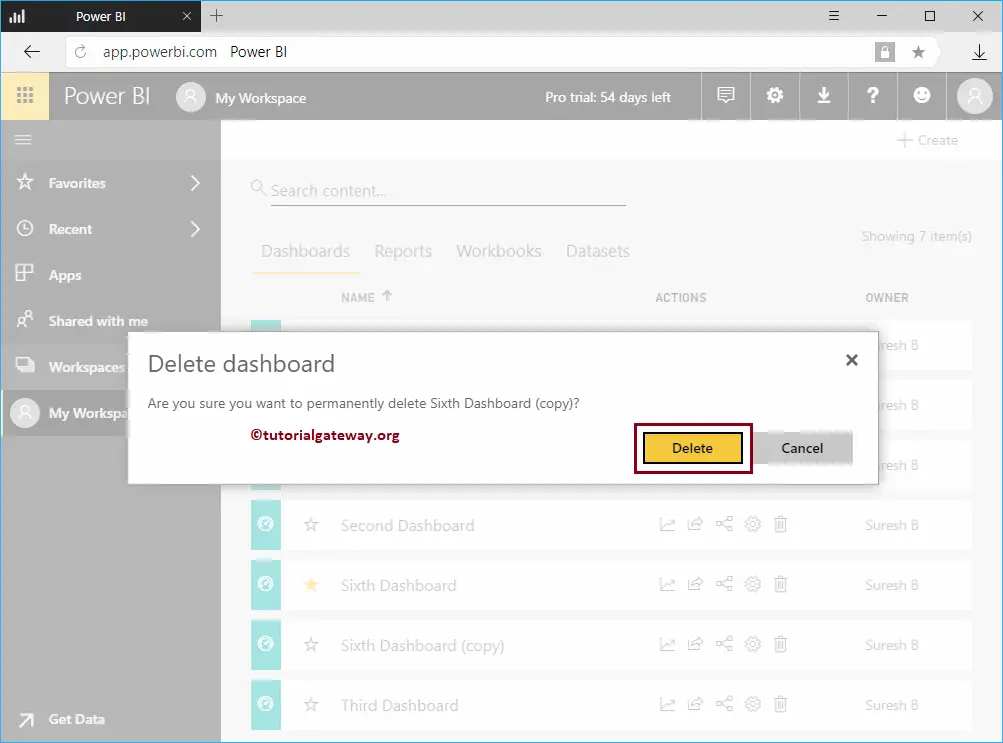
Clicking the Delete button display a confirm box. Please select the Delete button to confirm the deletion.
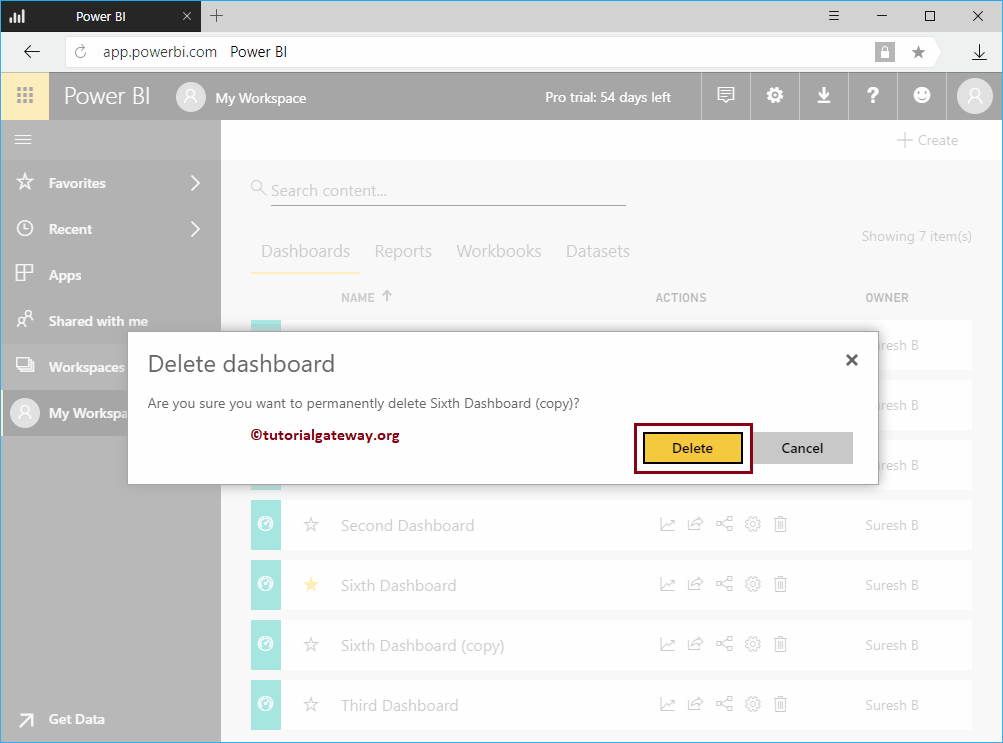
From the below Power BI screenshot, you can see that there is no Sixth Dashboard copy in our dashboards list.
Pin Report to Power BI Dashboard
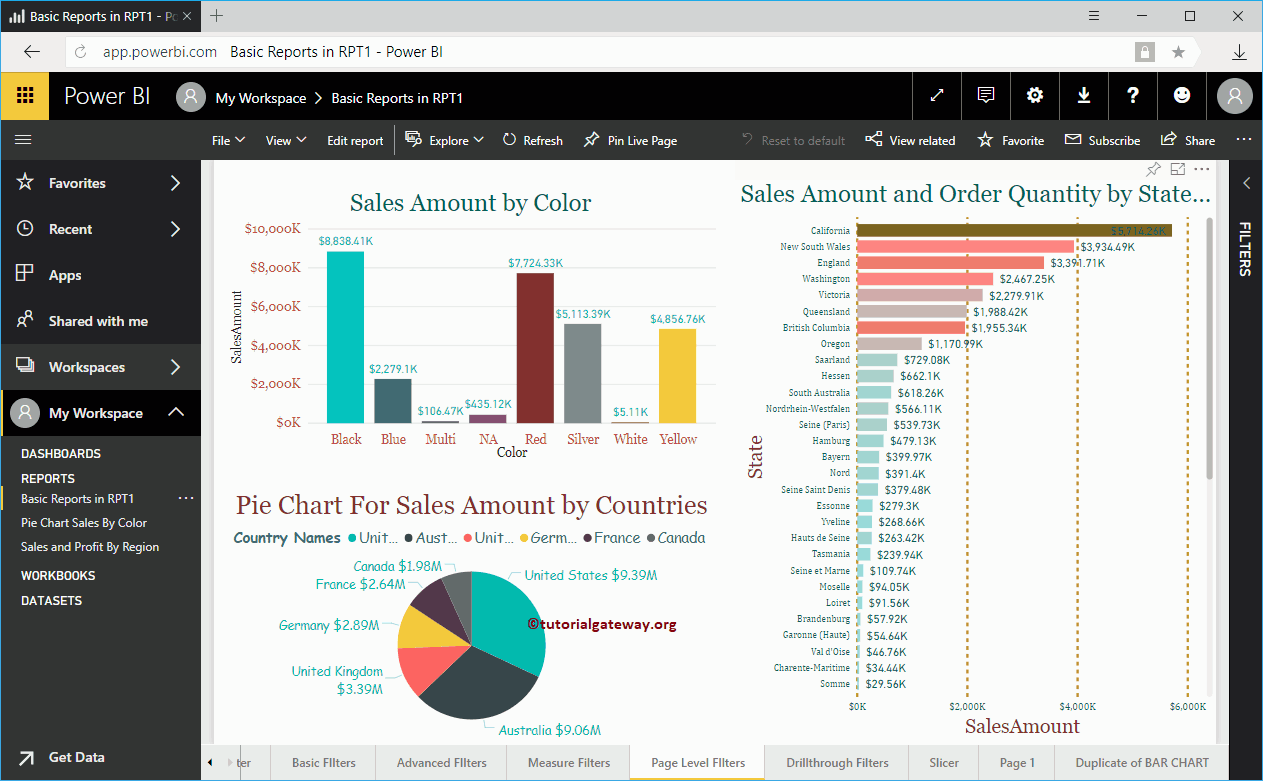
In this article, we show you the step by step approach to pin report to Power BI dashboard with a practical example. Before we start pinning the reports to the Power BI dashboard, let me show you the page that I use in this example.
As you can see from the screenshot below, this is the report that we published from Desktop. To demonstrate this Pin Report to Dashboard example, we use the Page level Filters page.
Pin Report to Power BI Dashboard Approach 1
This approach pin all the visuals that are available on this page. I mean Column Chart, Pie Chart, and Bar Chart.
In order to Pin the whole page to Power BI dashboard, click on the Pin Live Page button that we showed in below screenshot
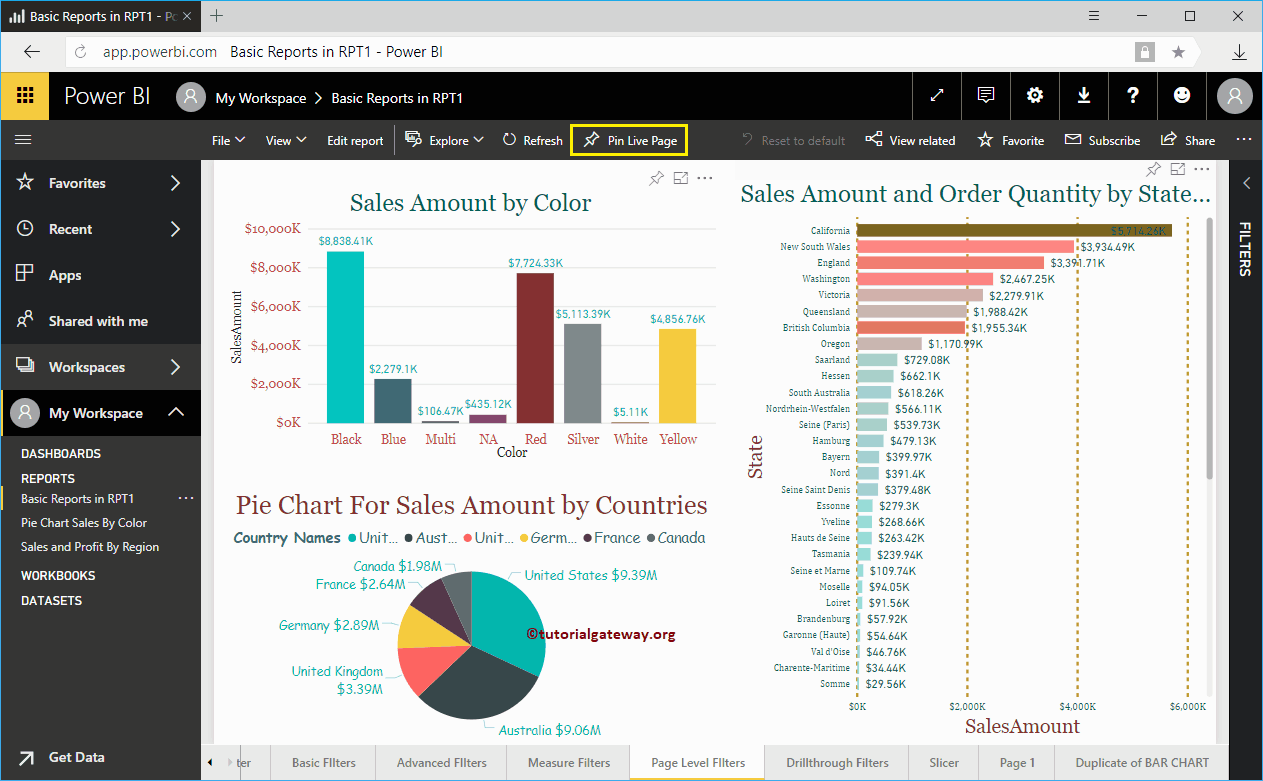
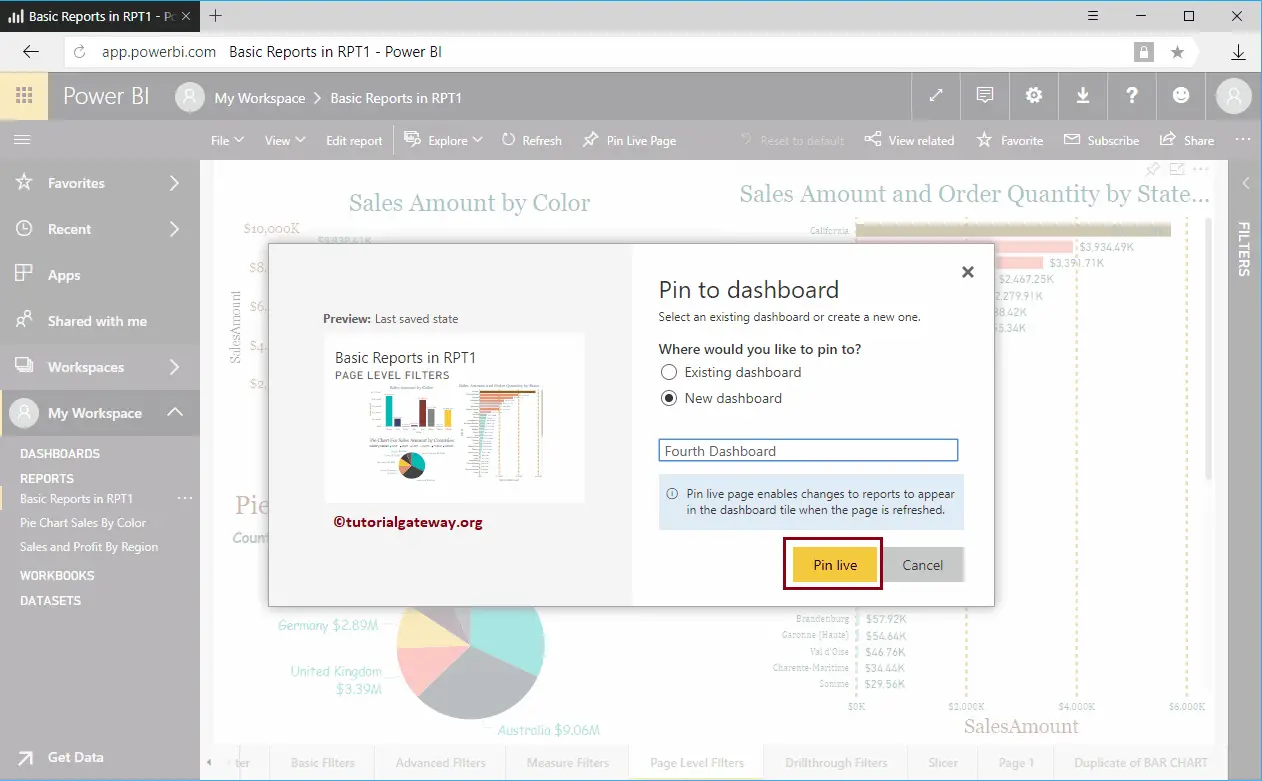
Clicking that Pin Live Page button opens the following window.
- Existing dashboard: Select this option to add this report to an existing dashboard.
- New Dashboard: Select this option to create a new dashboard for this report.
Let me select the New dashboard option, and next, we assigned the dashboard name as Fourth Dashboard
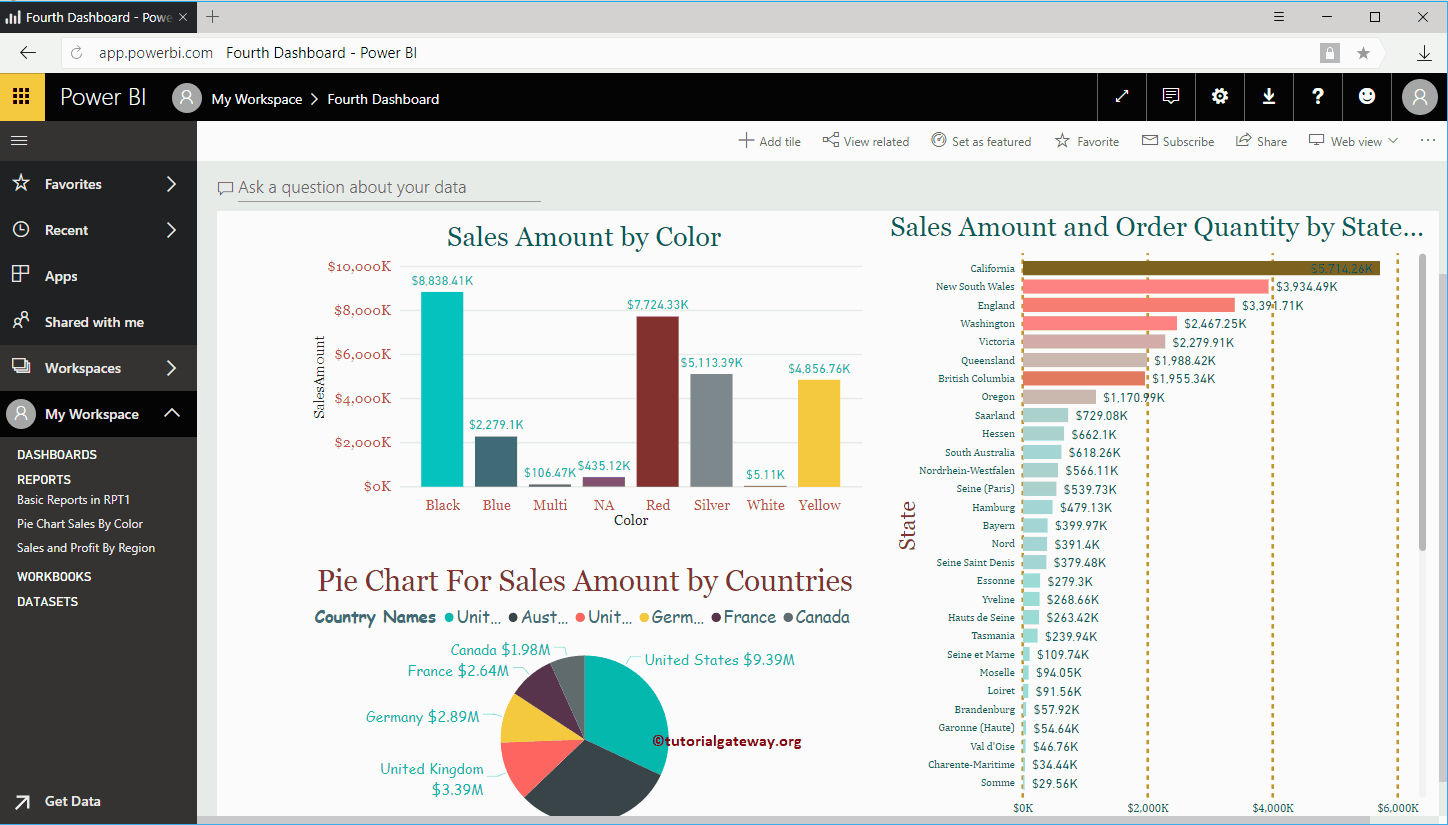
Within the Fourth dashboard, you can see the whole page inside our dashboard.
Pin Report to Power BI Dashboard Approach 2
This approach will pin individual visuals that are available on this page.
In order to Pin any individual chart, hover over that chart shows you the Pin Visual button that we showed in the screenshot below.
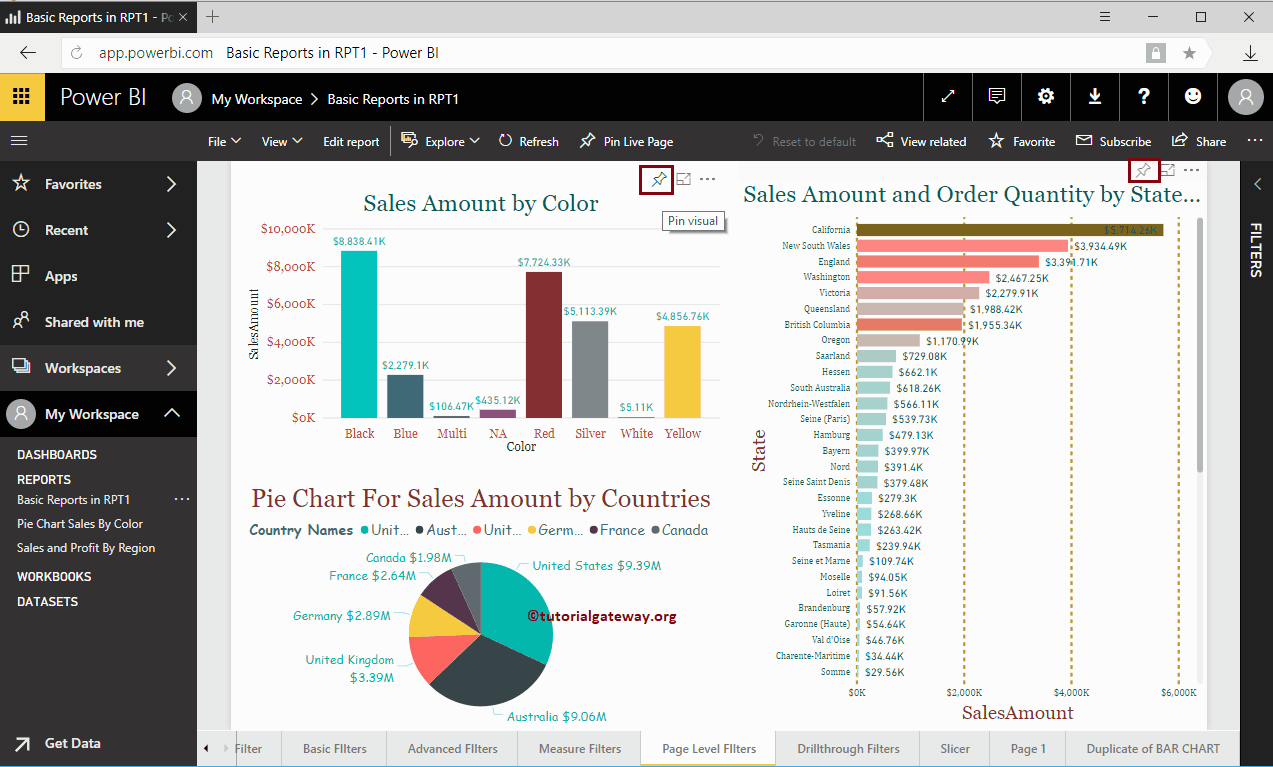
Click on that button to open the following window. This time also we are selecting New dashboard and assigned name as Fifth dashboard.
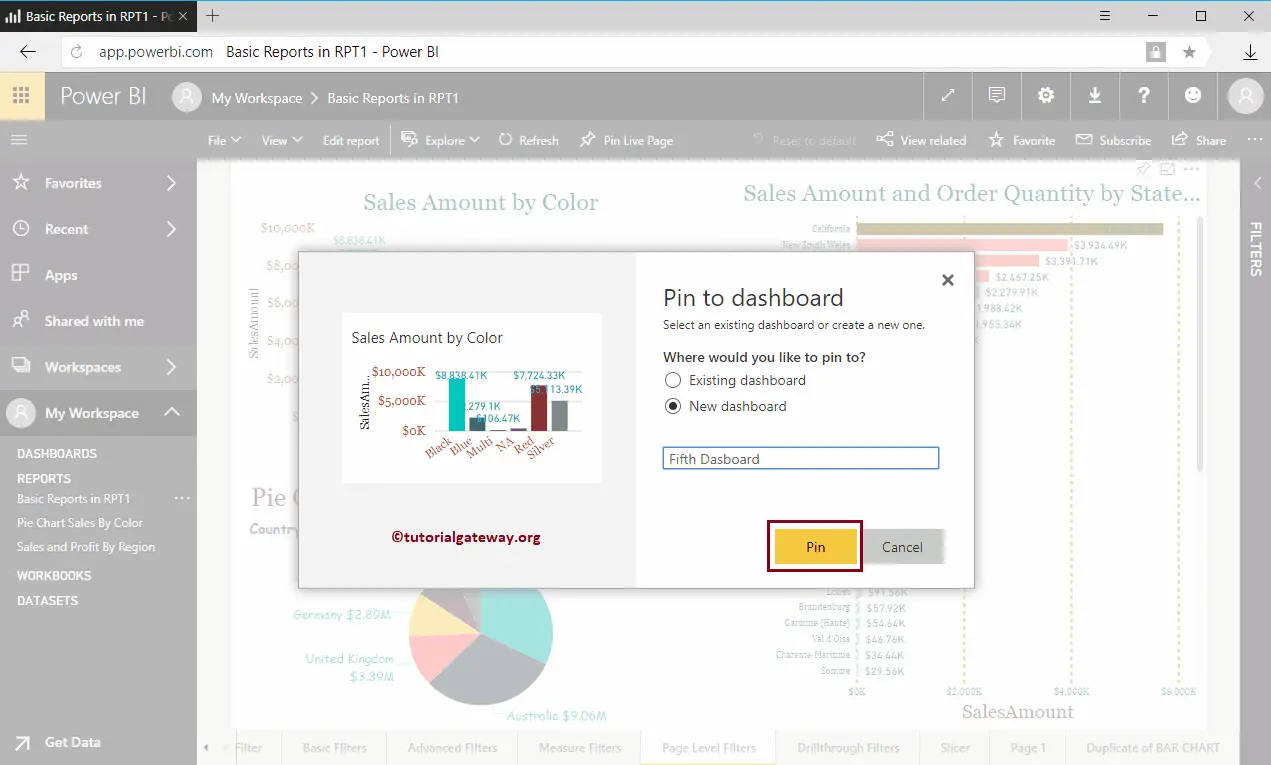
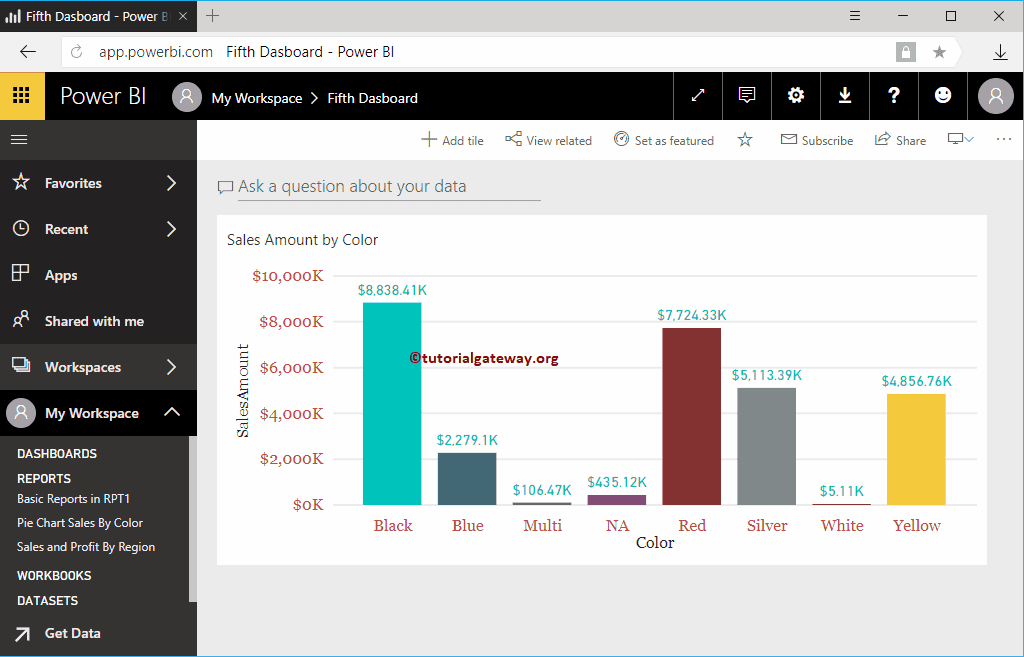
Within the Fifth dashboard, you can see the Column Chart that we pinned before.
