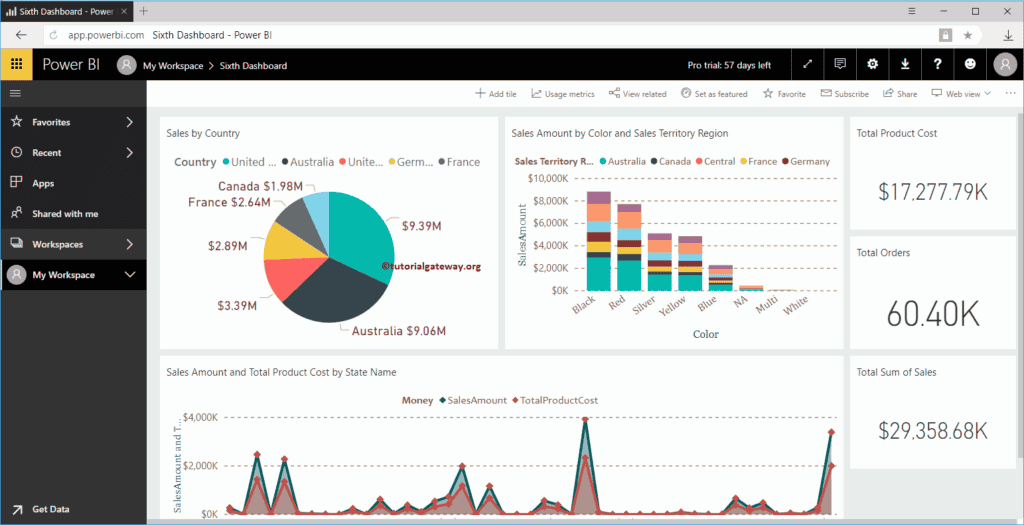
In this article, we show you the list of Power BI Dashboard Settings that are available for you. For this demonstration, we are going to use Sixth Dashboard available in my Power BI workspace.
Power BI Dashboard Settings
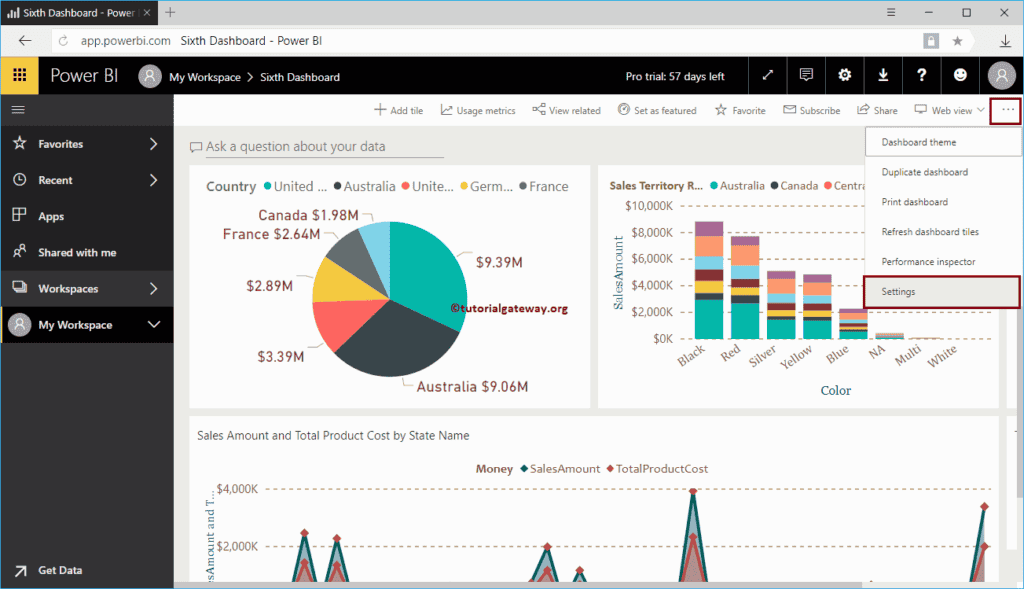
To change this Power BI dashboard settings, click on the … button on the top right corner, as we showed below. Next, select the Settings option from the context menu.

Select the Settings option open the dashboard settings window.
- Dashboard Name: You can change the dashboard name.
- Q&A: It allows the user to ask questions about the data. It is very useful to generate complete visuals by using natural language.
- Dashboard tile flow: If you enable this option, then the Power BI dashboard automatically adjusts the position of the tiles.
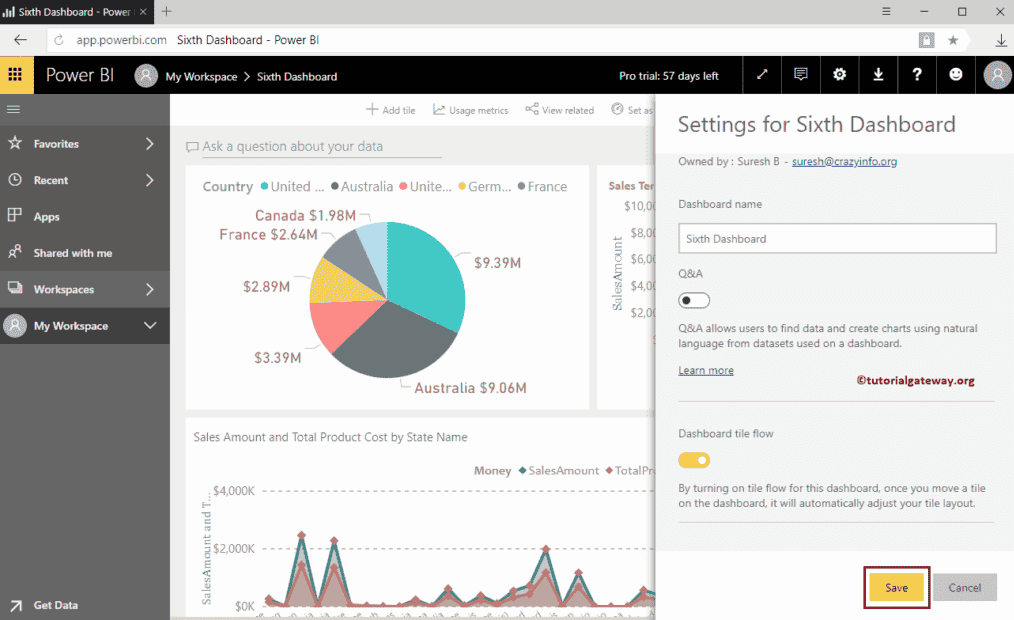
Let me Toggle Q&A to off, and Dashboard tile flow to on

As you can see from the screenshot below, Ask a question about your data removed from the dashboard. Note, I was unable to capture the tile flow.
Trust me. It works