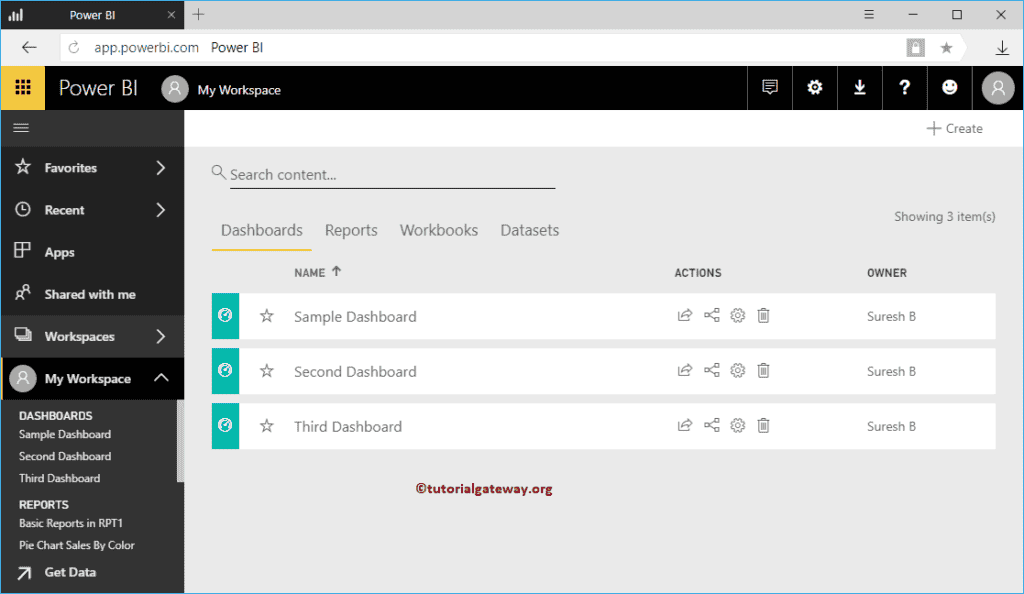
How to add reports to Power BI dashboard with a practical example?. Before we get into the actual Add Reports to Power BI Dashboard example, let me show you the dashboards that are available in my workspace.
TIP: I suggest you refer to Create a Power BI Dashboard article to understand the steps involved in creating a Power BI dashboard.
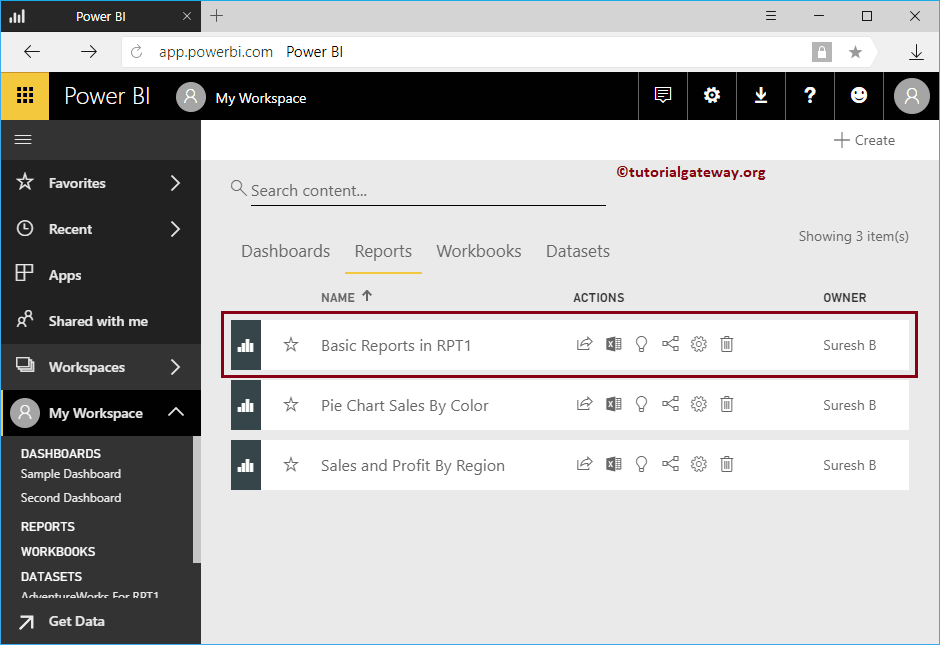
Navigate yourself to see the list of available reports inside your workspace.
How to add Reports to Power BI Dashboard
In this example, we are going to use the Basic reports in RPT 1 report. So, click on this report to see the pages available in this report.
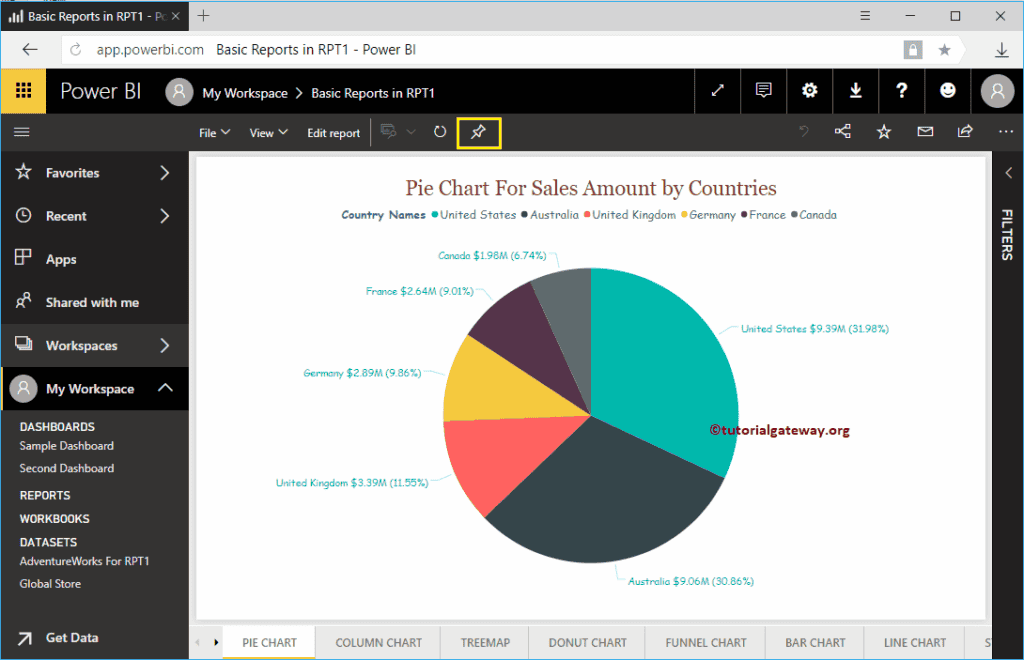
Now you can see the pages inside the selected report. Let me add this Pie Chart to our dashboard.
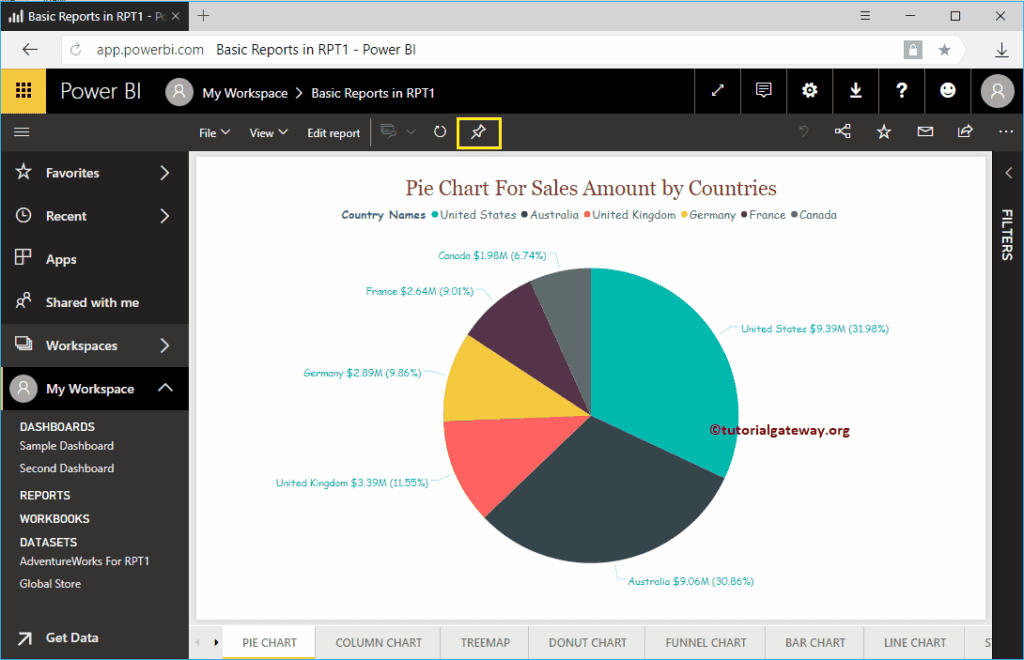
Click on the Pin Live Page button that we have shown in the screenshot below.
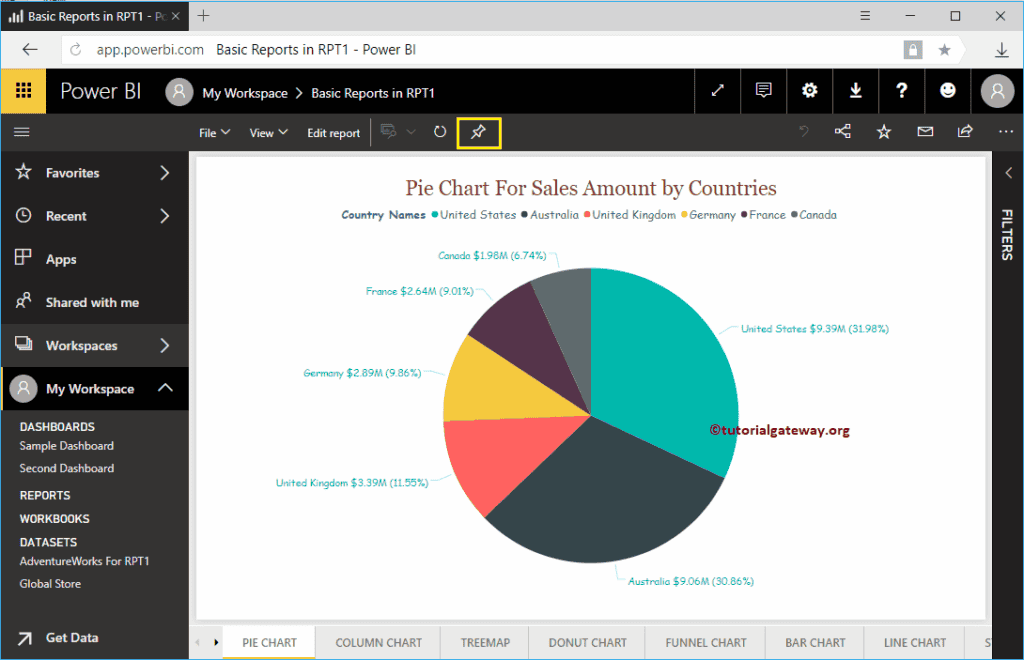
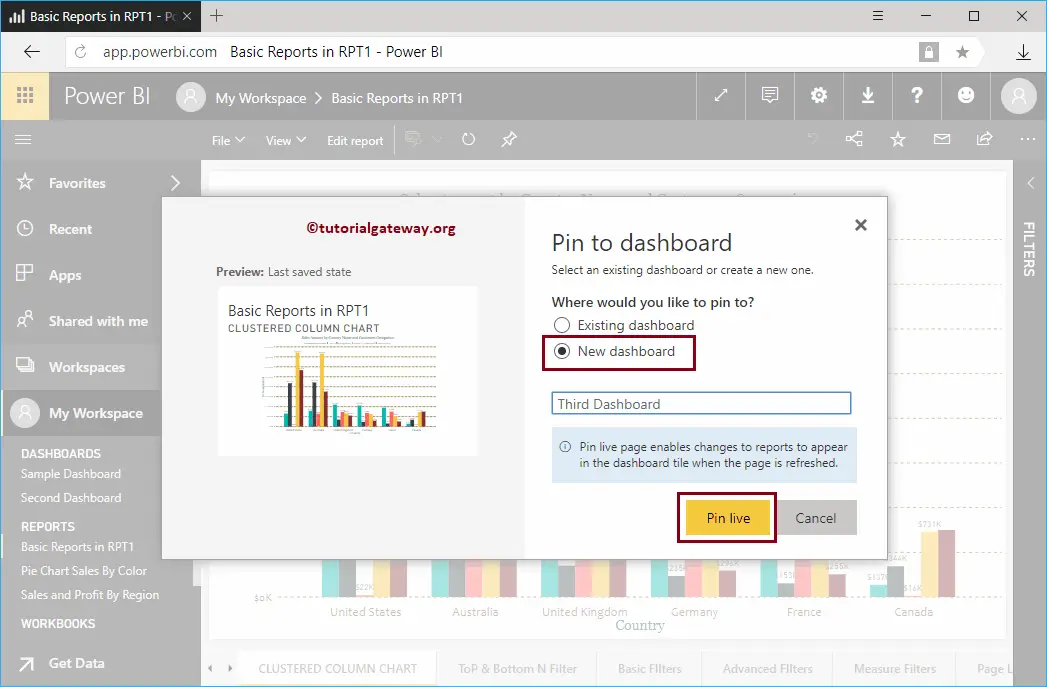
Clicking that button opens the following window.
- Preview: It shows you the preview of the selected report.
- Existing dashboard: If you want to add this report to an existing dashboard, then you have to select this option.
- New Dashboard: If you want to create a new dashboard for this report, then you have to select this option.
- Drop down Menu: Use this drop-down box to select the dashboard.
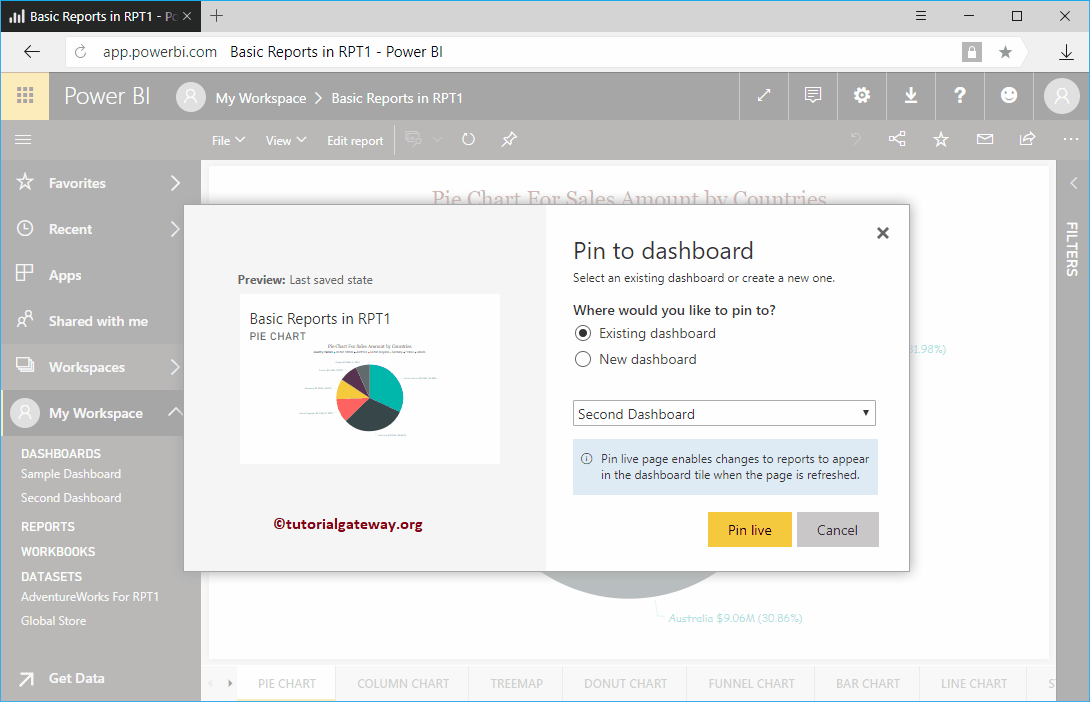
Add Reports to Existing Power BI Dashboard
In this example, we are selecting the Existing Power BI dashboard option. Next, we selected the Sample dashboard
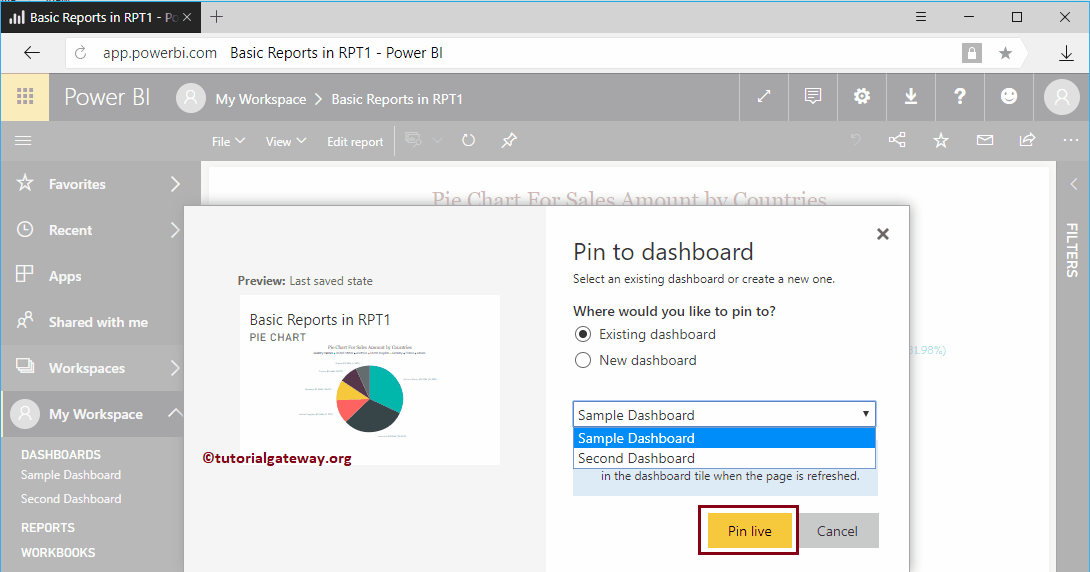
Clicking the Pin Live button adds a report to the sample dashboard. Let me open my Sample Dashboard.
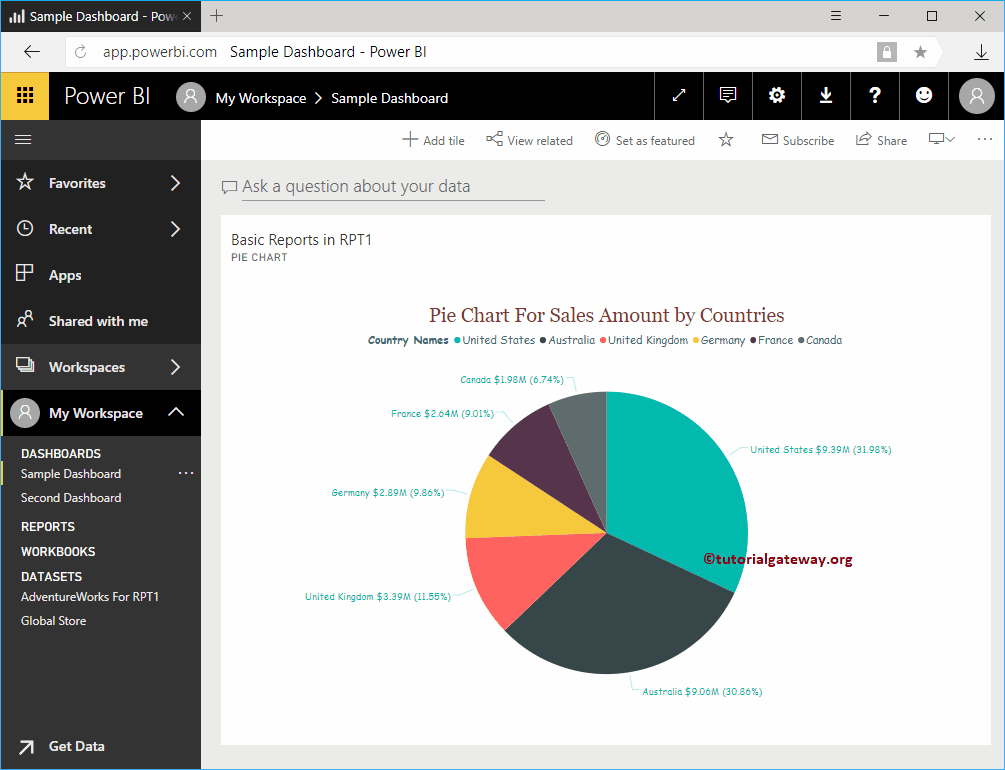
Similarly, you can add multiple reports to a single dashboard.
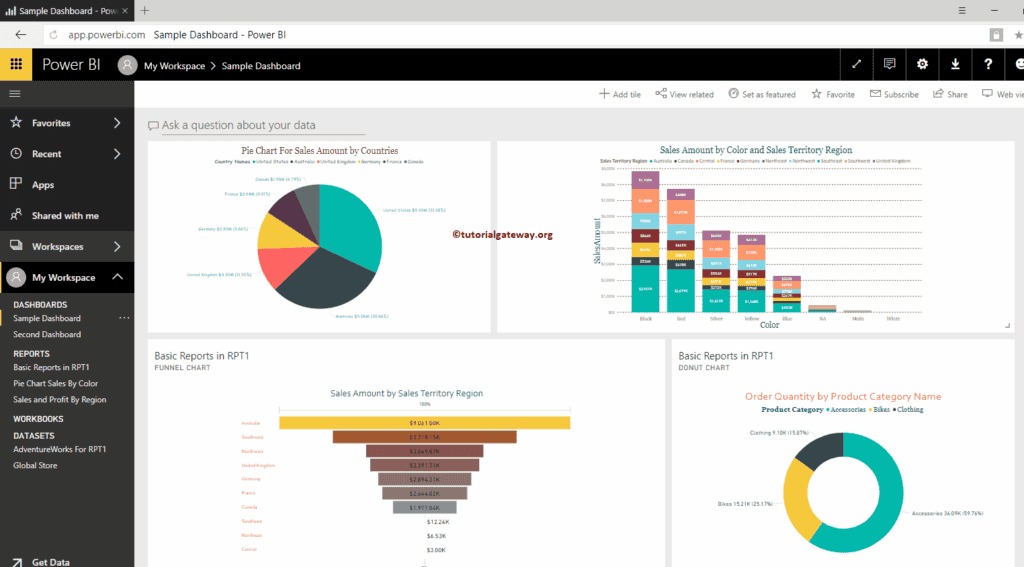
You can use your mouse cursor to adjust the size and position of a report inside your dashboard. Let me adjust for your reference.
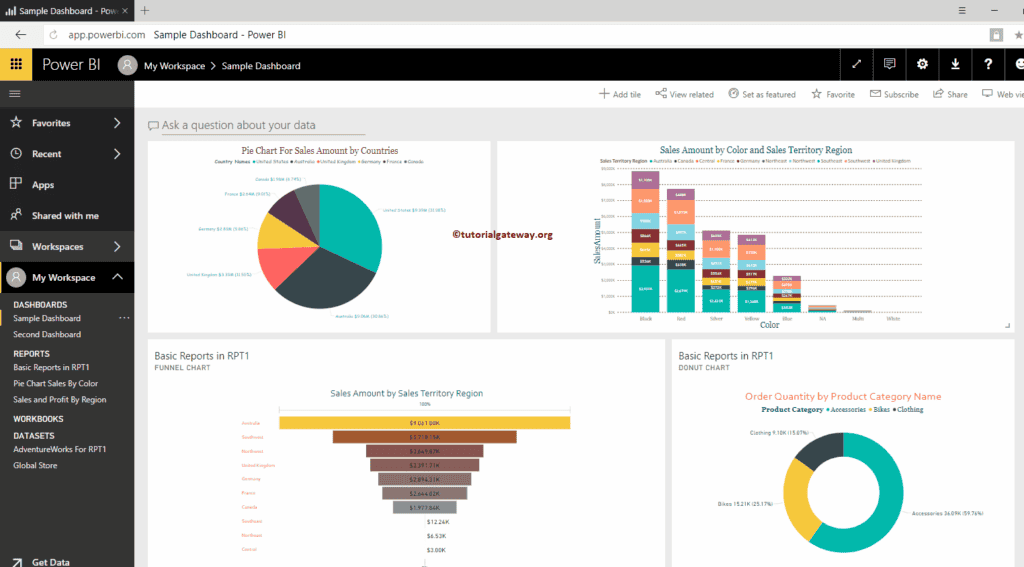
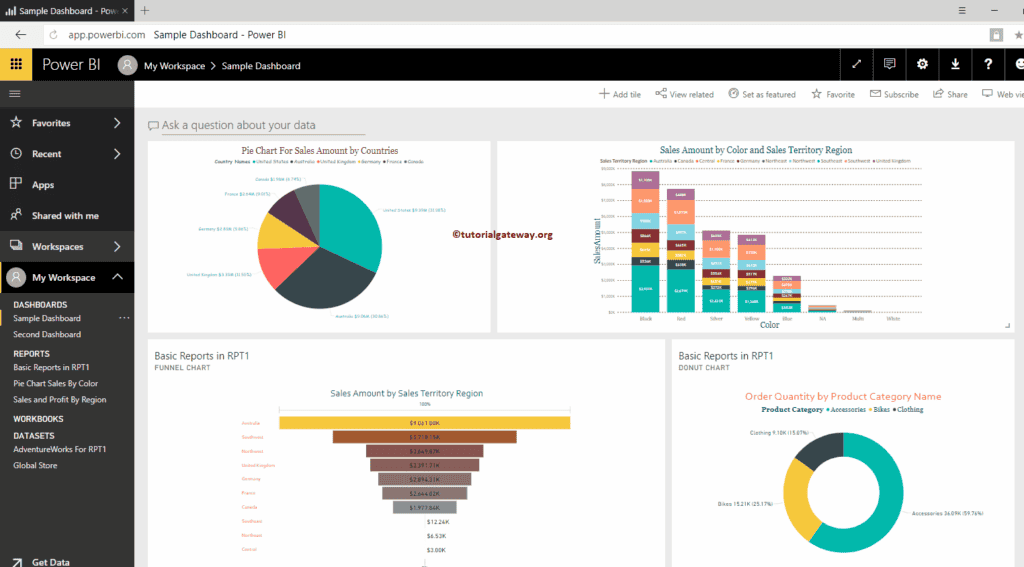
Now you can see all the available reports
Add Reports to New Power BI Dashboard
In this example, we are going to add reports to the existing Power BI dashboard. So, we are selecting the New dashboard option.
It replaces the drop-down box with the text box. You have to provide your new dashboard name in this text box.
Now you can see the Clustered Column chart inside your third dashboard.
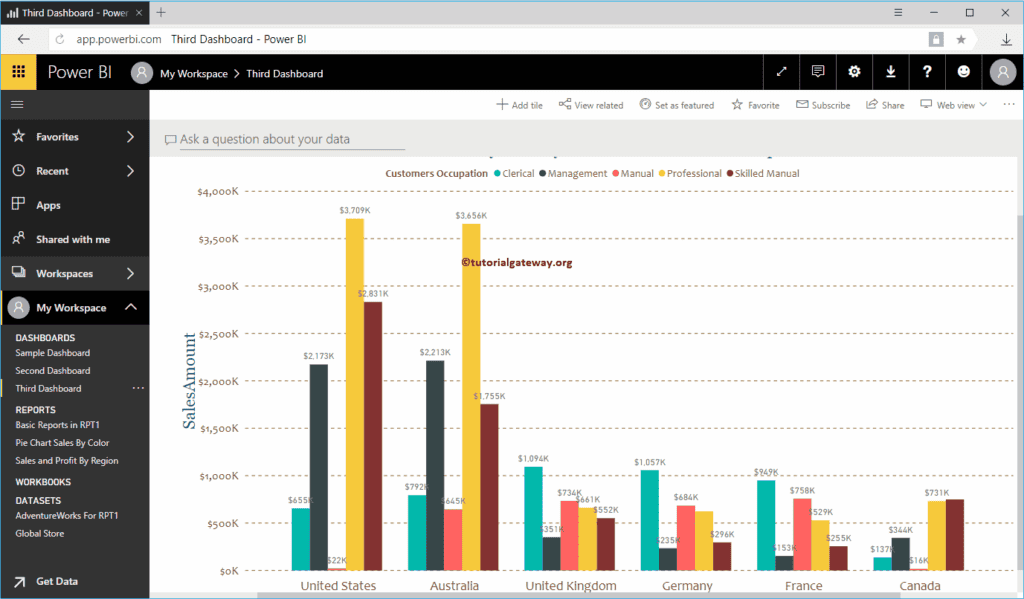
Let me navigate to My Workspace -> and Dashboards tab to see the dashboards. As you can see, it is displaying the Third Dashboard that we created earlier.
