Power BI Tutorial - Dashboards
Posted by Superadmin on August 19 2020 19:14:13
Power BI Tutorial on Dashboards
The Power BI tutorial on Dashboards, adding report items to the dashboard, and publishing them.
- Register to Pro Service
- Dashboard Introduction
- Connect Desktop with BI Service or Pro
- Publish Desktop Reports
- Create a Workspace
- Create a Dashboard
- Favourites
Register to Power BI Service
Power BI desktop is the local version, where you can design your reports. But, in real-time, you have to share your work (reports) and dashboards across your organization. For this, you need a Premium license. However, you can try Power BI Pro 60 days trail. Let me show you how to register for Power BI Service.
How to register to Power BI Service
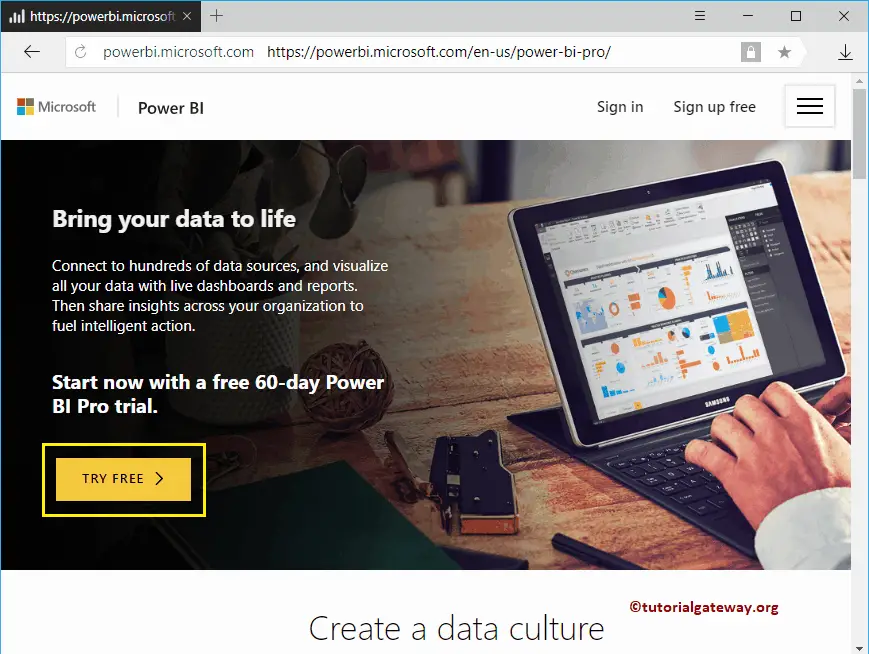
First, go to the official Microsoft Power BI website by clicking this link Power BI Pro. Next, click on the Try Free button to start your Power BI 60 days trial.
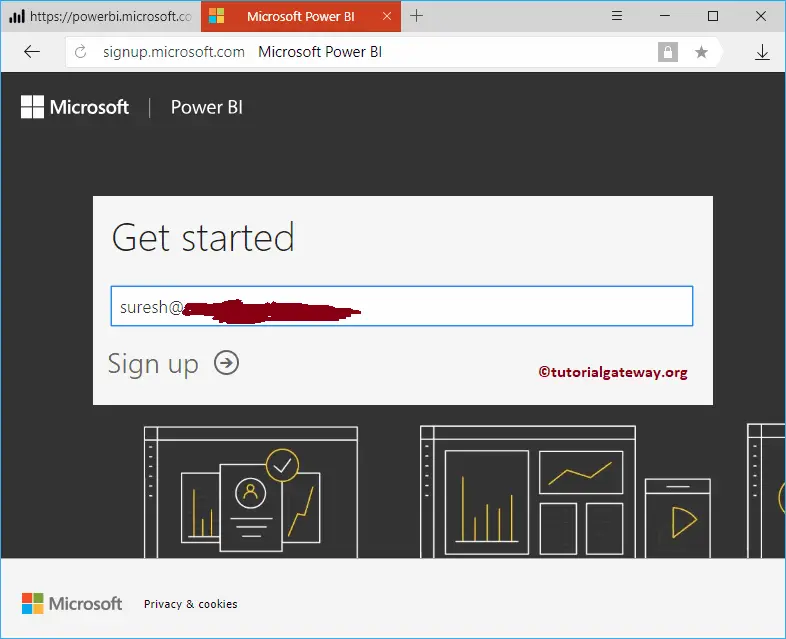
Clicking the Try Free button open Get Started window. Here, you have to provide the company email id. Remember, it won’t accept your personal email like Gmail.
Once you click the Sing up button, Power BI sends a verification code to the email that you provided. You have to use this verification code on the next screen.
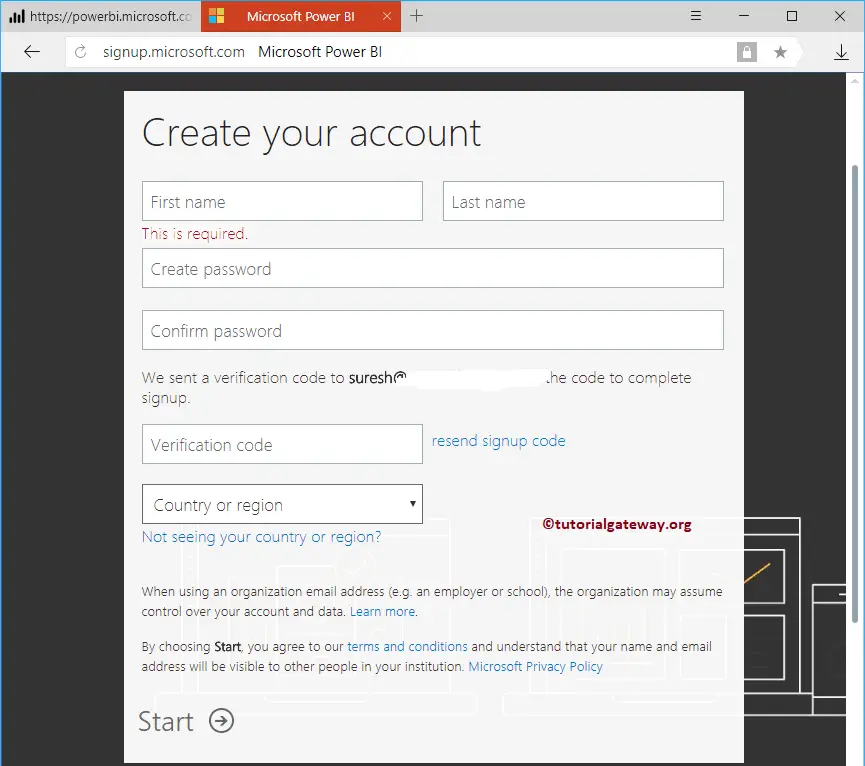
Next, fill these text boxes with your personal information.
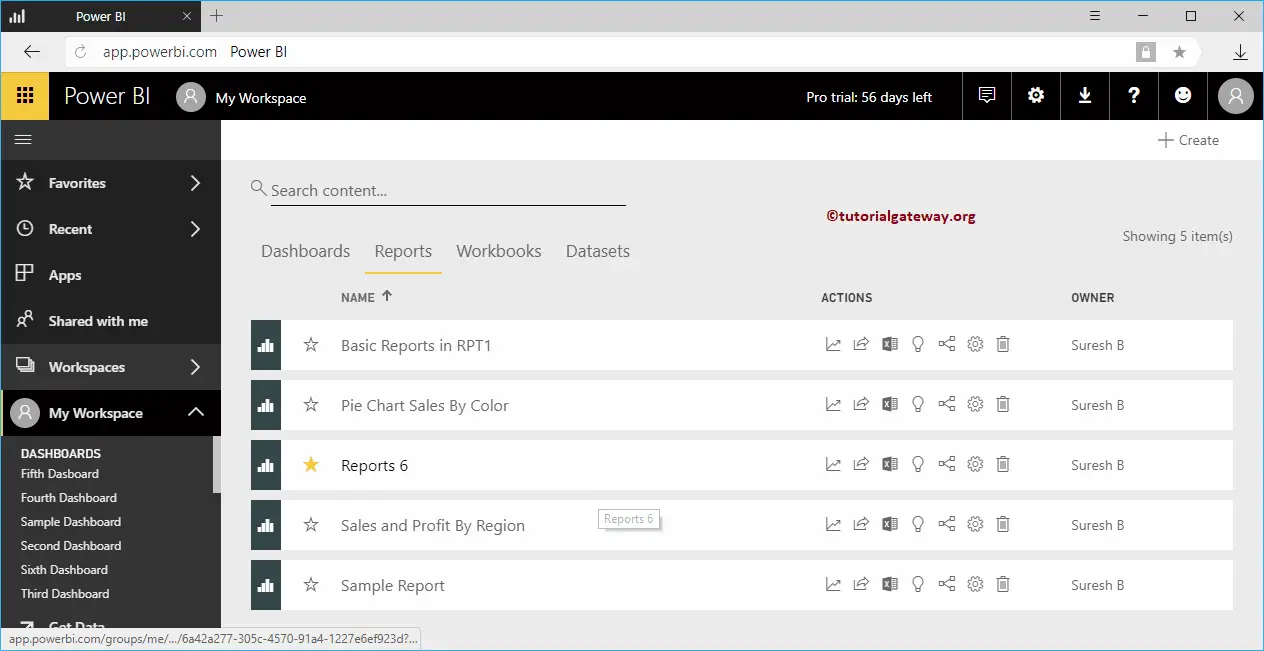
Now you can see the Power BI workspace.
Power BI Dashboard Introduction
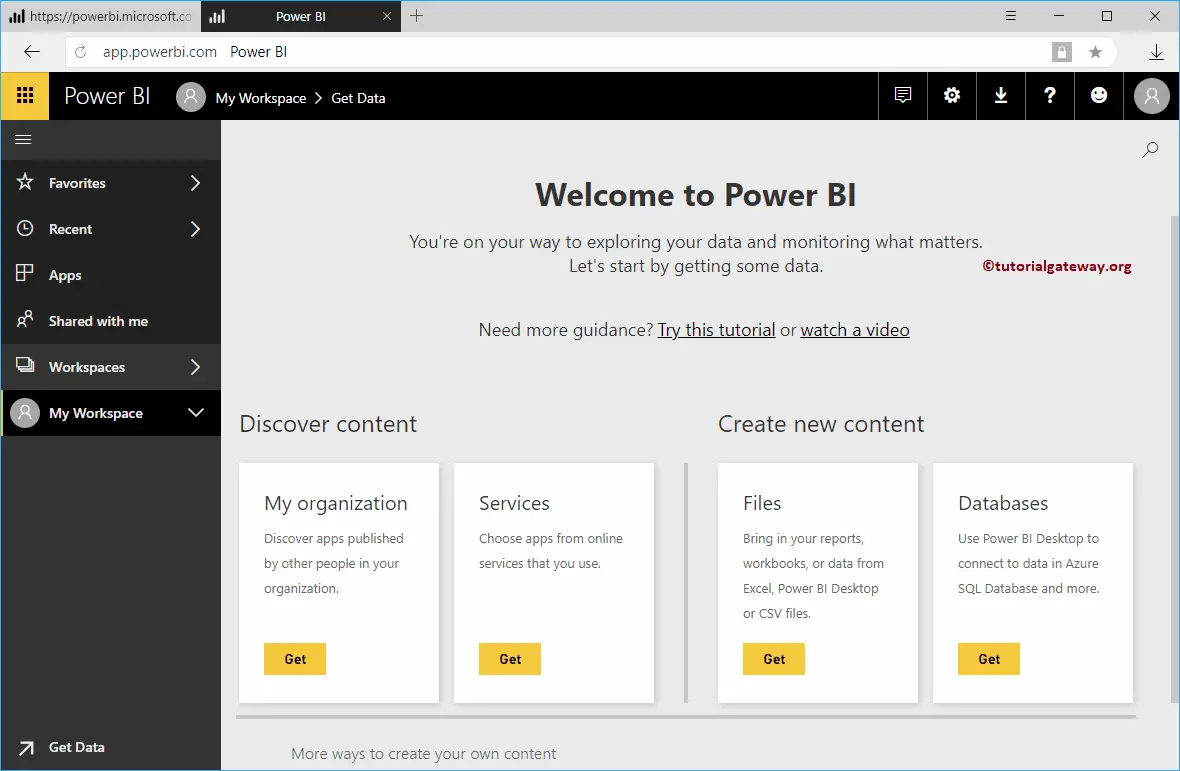
This article is an introduction to Power BI Dashboard. When you open or logged into a Power BI Service, you can see the Default Power BI dashboard.
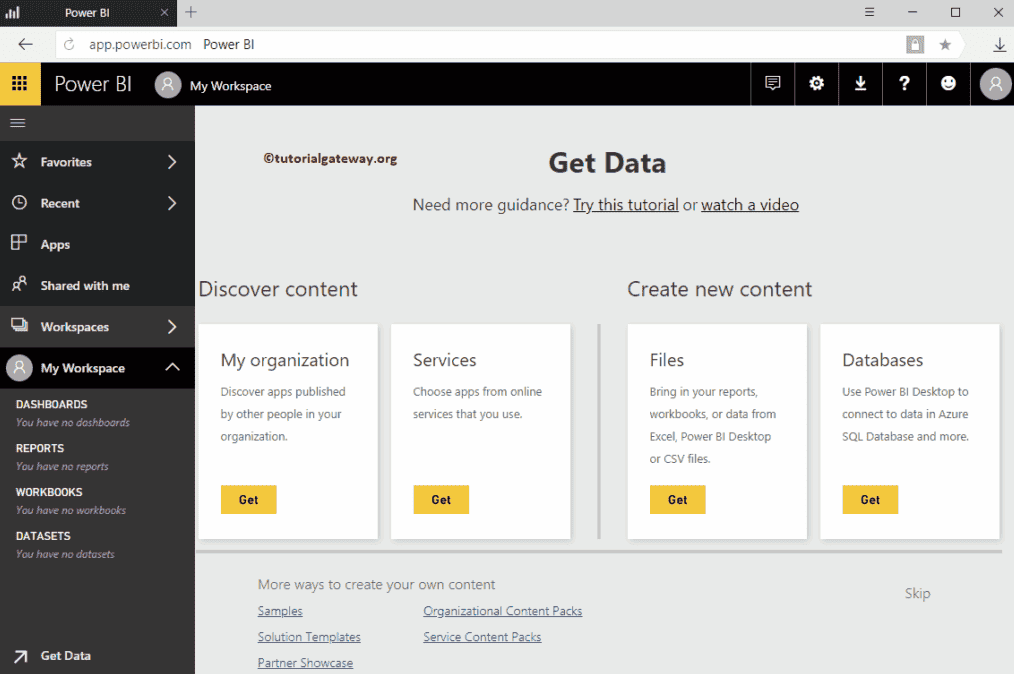
If this is your first time, then the Power BI Dashboard displays the below page
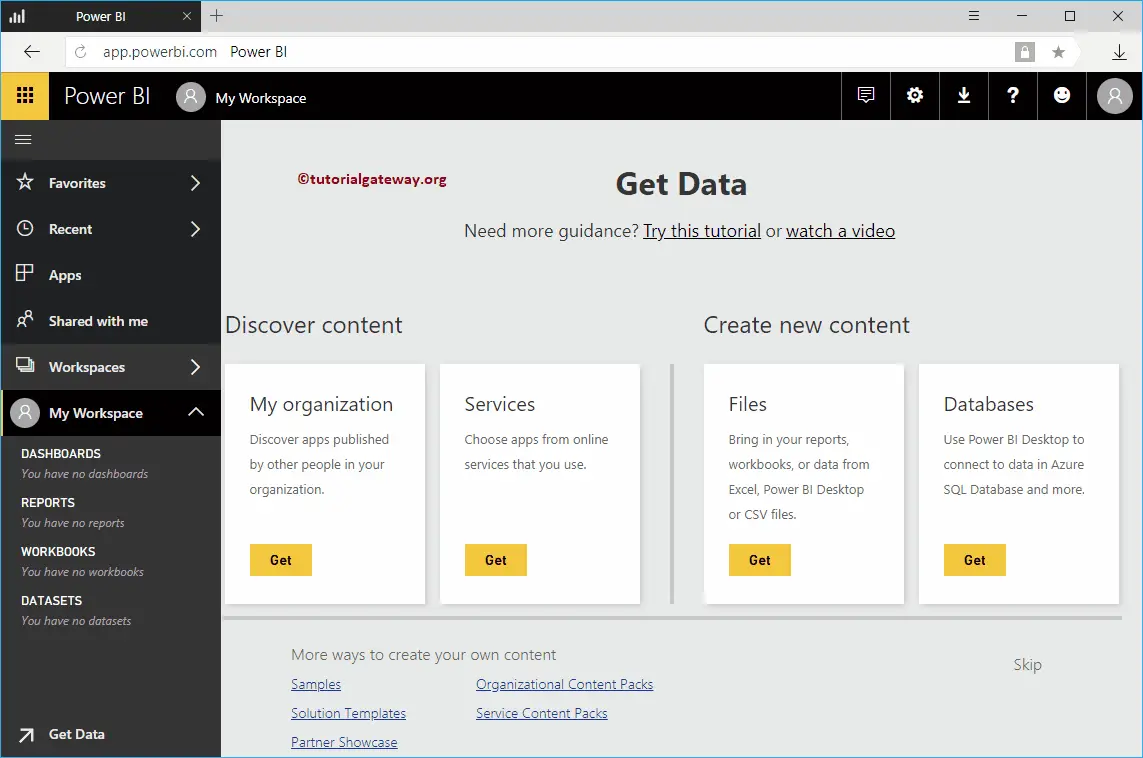
Power BI Favorites
If you find something interesting, I mean a report or a dashboard, then you can add them to favorites for quick access. Those items will display in this section. I suggest you refer to the Power BI favorites article to understand the addition of dashboards and reports to Power BI favorites.
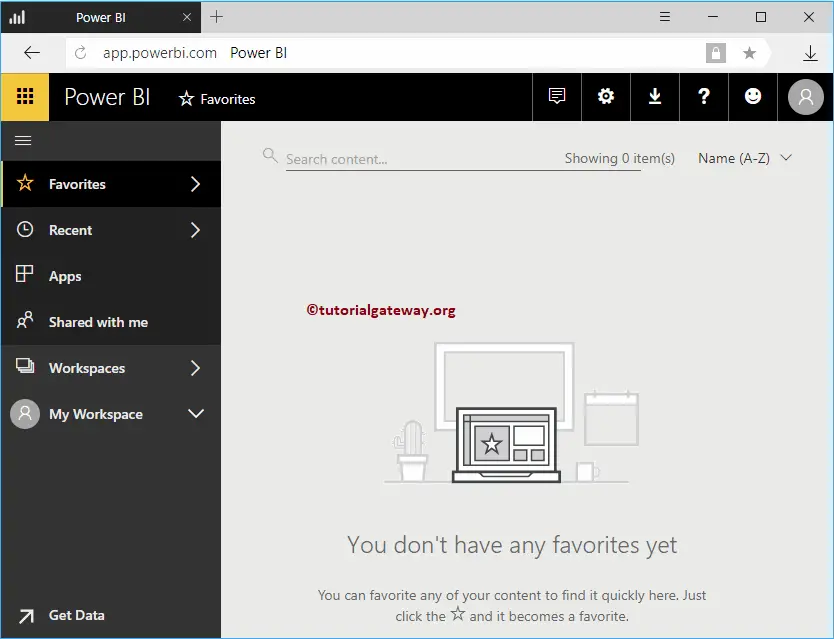
Power BI Recent
Same as Recent files in Windows. It displays the reports, dashboards that we have seen recently.
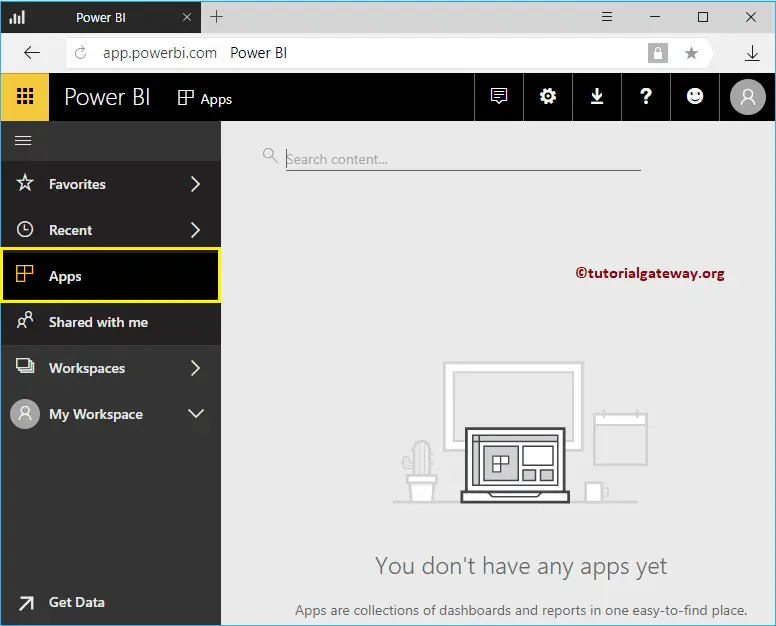
Power BI Apps
Power BI Apps are a collection of reports and dashboards that helps you to analyze the business. This section displays the available Apps.
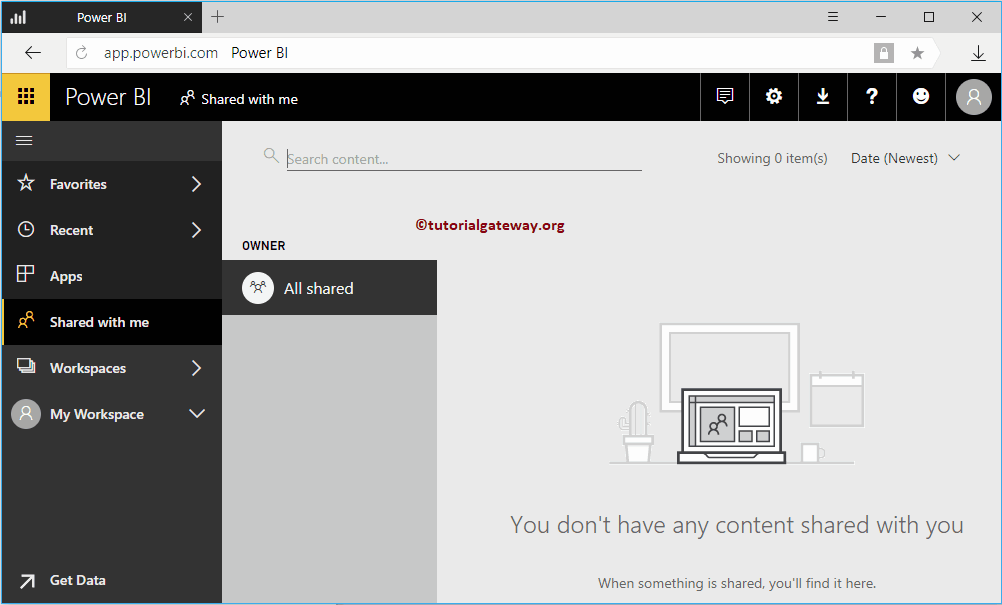
Power BI Shared With Me
If someone in the organization shared a report or dashboard with you, then those shared items displayed in this section. Please refer to Share a Dashboard, and Share a Report article to know about the sharing options.
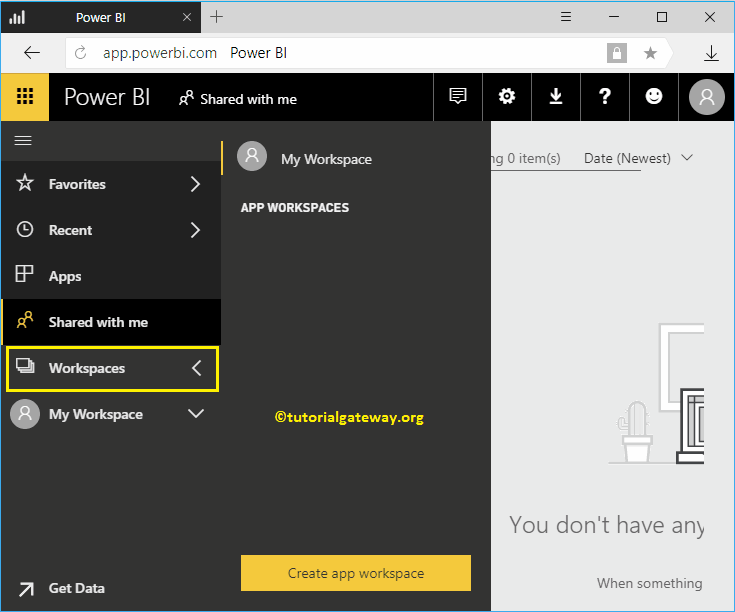
Power BI Workspaces
Power BI Workspace is a collection of Dashboards, Reports, Workbooks, and Datasets. It displays the workspaces that are available for this account. I suggest you refer to Create Power BI Workspace article to understand the creation of workspace.
My Workspace in Power BI
This is the default workplace created by the Power BI service, and this is the default one too.
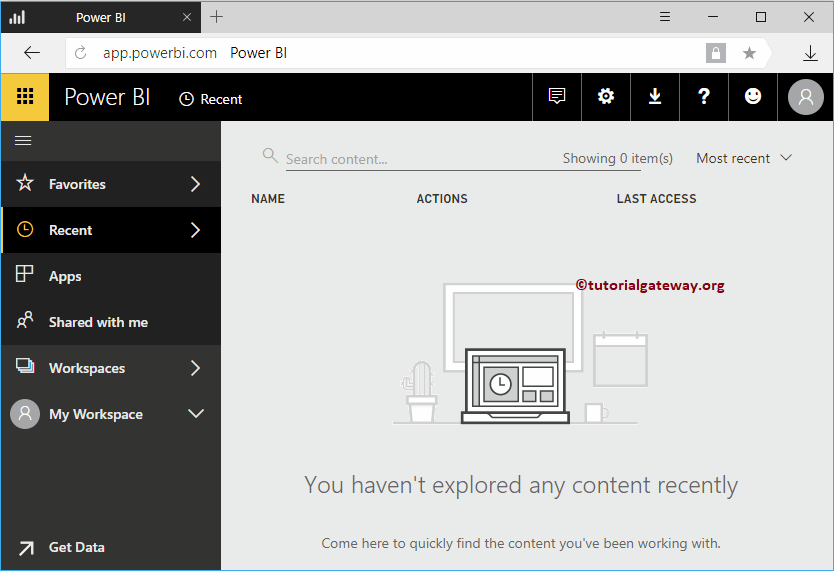
If you are opening this Service for the first time, then it may display the below shown page. You can use this page to import data for creating visualizations.
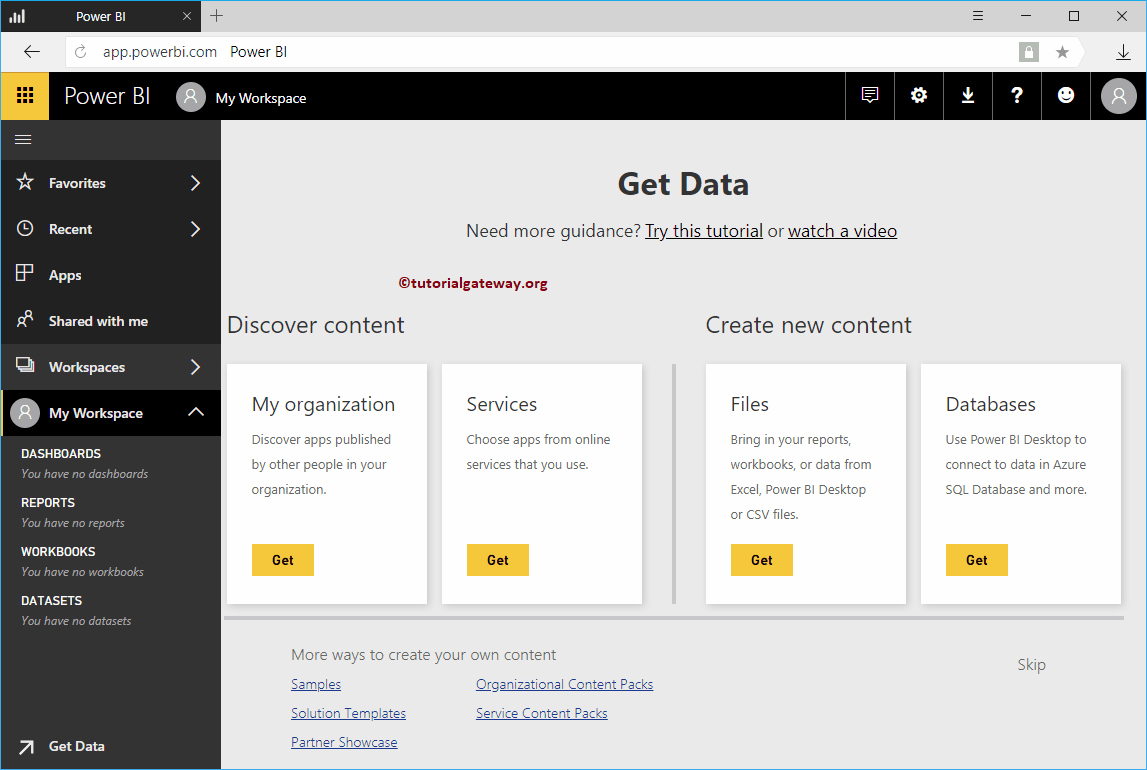
By clicking the Skip button, or clicking the My Workspace tab opens the following window.
- Dashboards: The Power BI dashboard section display the Power BI dashboard (s) that are available in this workspace. Using the create button, you can create a Dashboard too. I suggest you refer to Create a Dashboardarticle.
- Reports: Reports tab display the Reports that are available in this workspace. Using the create button, you can create a new report also. I suggest you refer to Create a Report article.
- Workbooks: This section displays the Workbooks available in this workspace. It means, Excel workbooks that you uploaded (not imported) into the workspace. I suggest you refer Upload Excel Files article.
- Datasets: This section displays the list of available datasets. You can create a Dashboard using the create button.
Connect Power BI Desktop with Power BI Service
In this section, we show you how to connect Power BI Desktop with Power BI Service or Power BI Pro. It is very important to publish your reports.
TIP: I suggest you refer Register to Power BI service article to create a Power BI account.
How to connect Power BI Desktop with Power BI Service
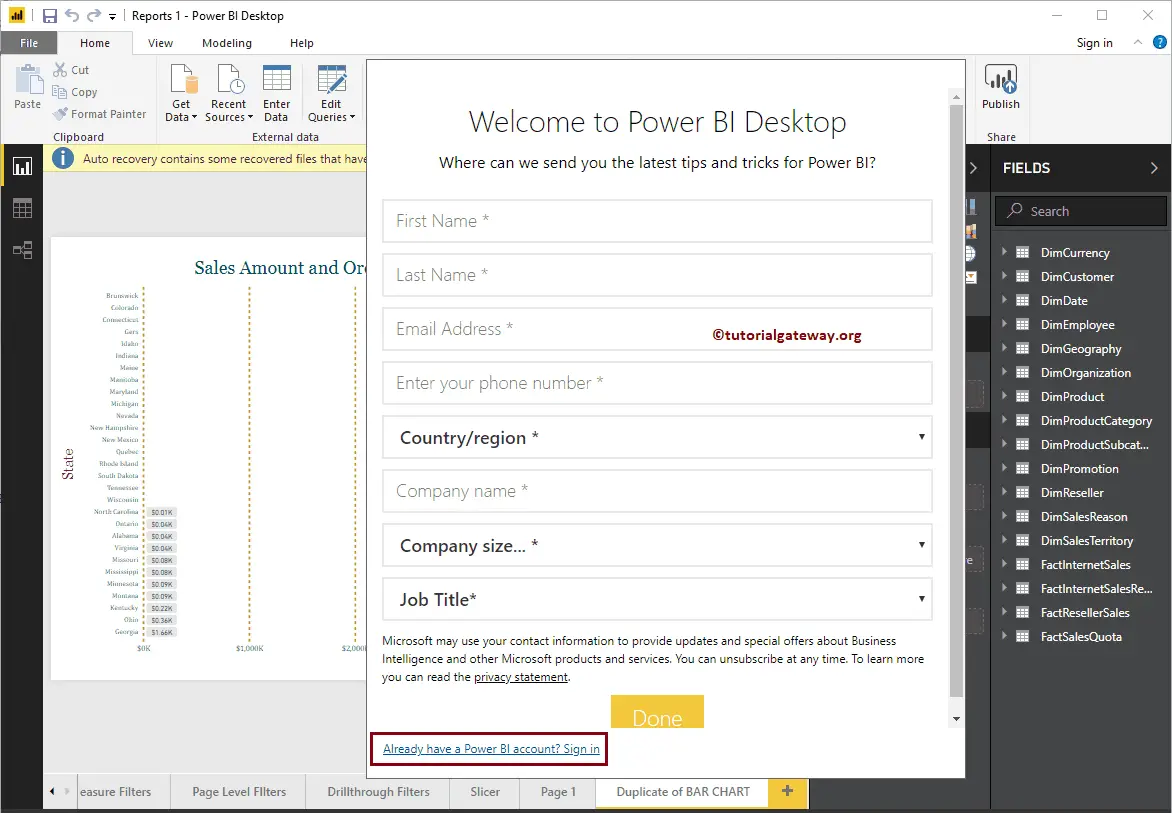
If you haven’t started the Power BI Desktop yet, Double click on the Power BI desktop to open. Once it is open, it asks you to register or to sign in as we below screenshot. You can use this form to create a new account.
Please click on the Already have a Power BI account? Sign in hyperlink
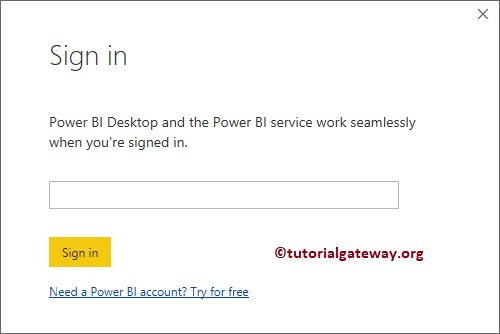
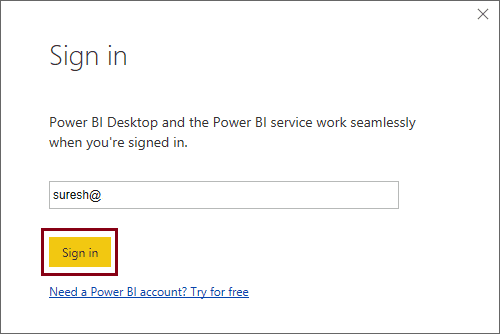
Clicking the hyperlink opens a Sign in window. Here, you have to provide the username.
Connect Power BI Desktop Approach 2
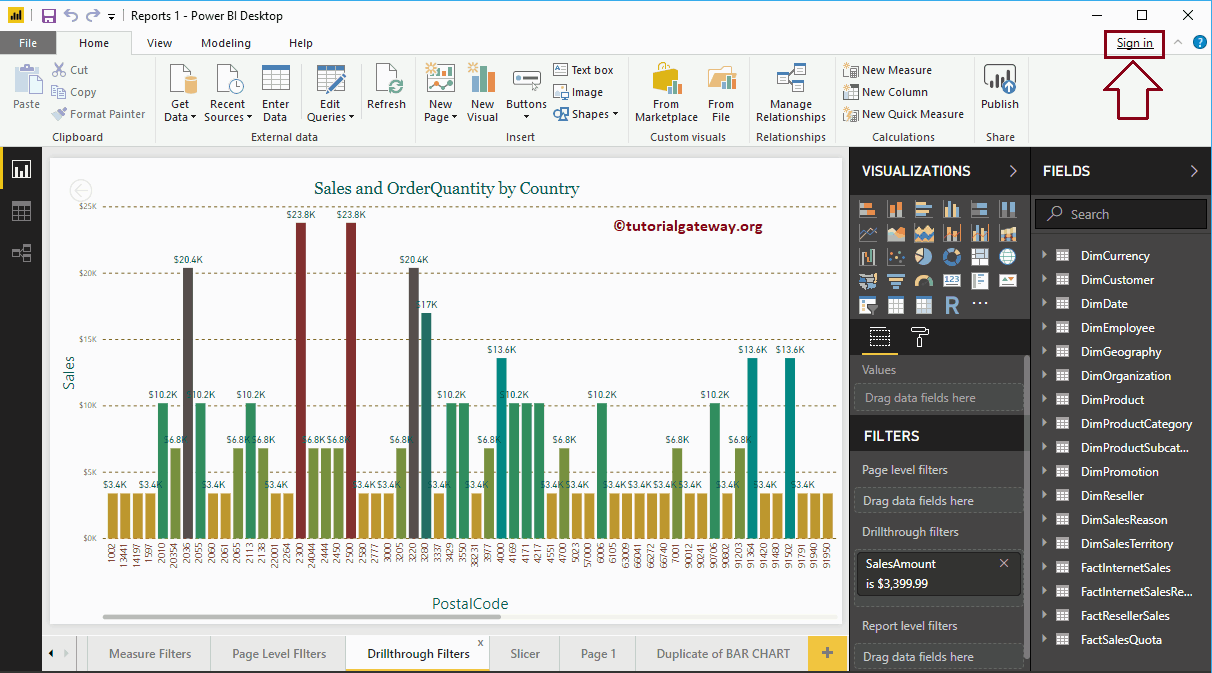
Somehow if you forgot to log in when the Desktop is loaded, then you can follow this approach.
Click on the Sign in hyperlink in the top right corner.
Please provide the Email Id that was provided by your company. Remember, it only accepts organization ids, not your personal email accounts like Gmail.
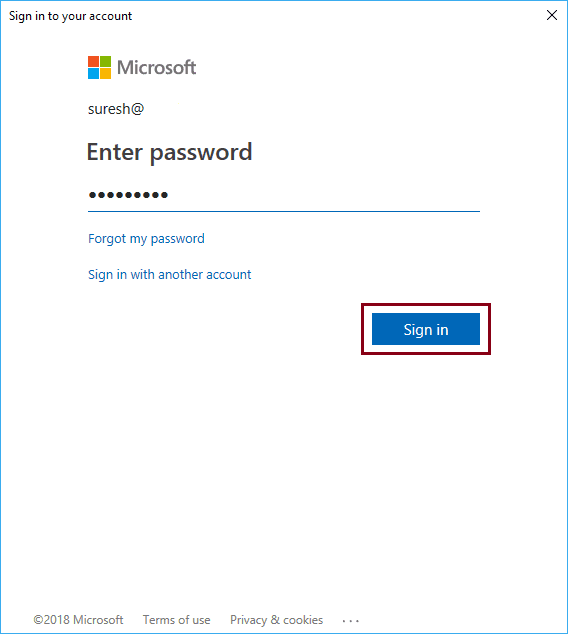
Please provide the password
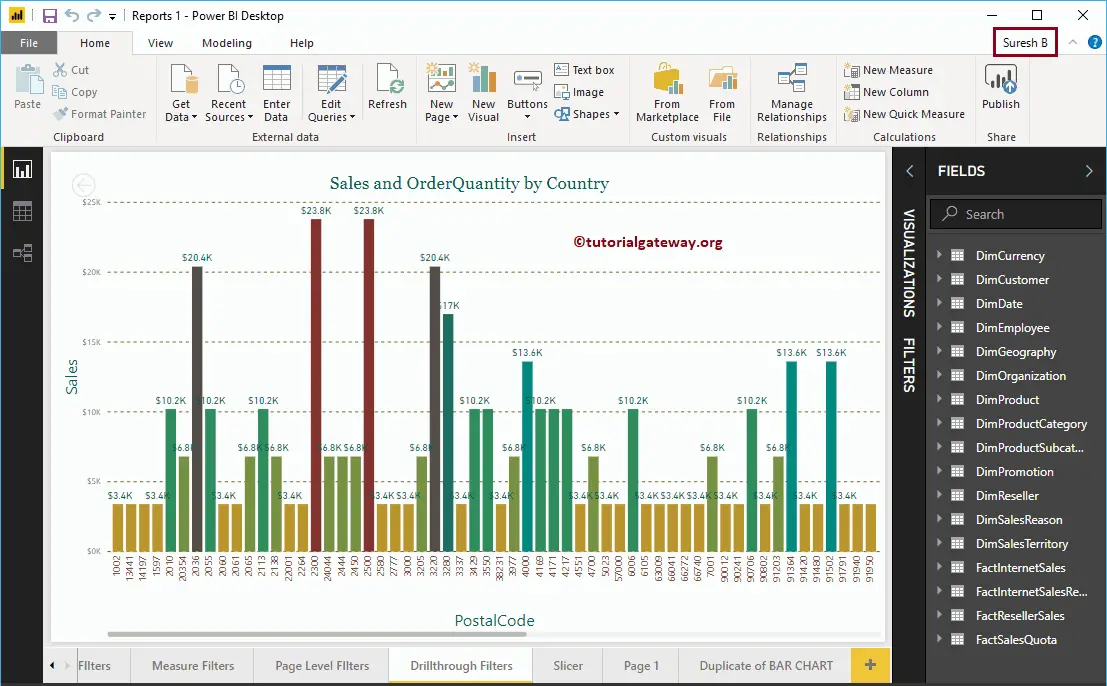
Now you can see that I logged in as Suresh.
Publish Power BI Desktop Reports
In this article, we show you the step by step approach in publishing Power BI desktop reports into Power BI Service with a practical example. Before you start publishing reports in Power BI Desktop, you have to sign in to your account using Pro credentials.
TIP: I suggest you refer Connect Power BI Desktop with Power BI Service article to understand the procedure to sign in Power BI.
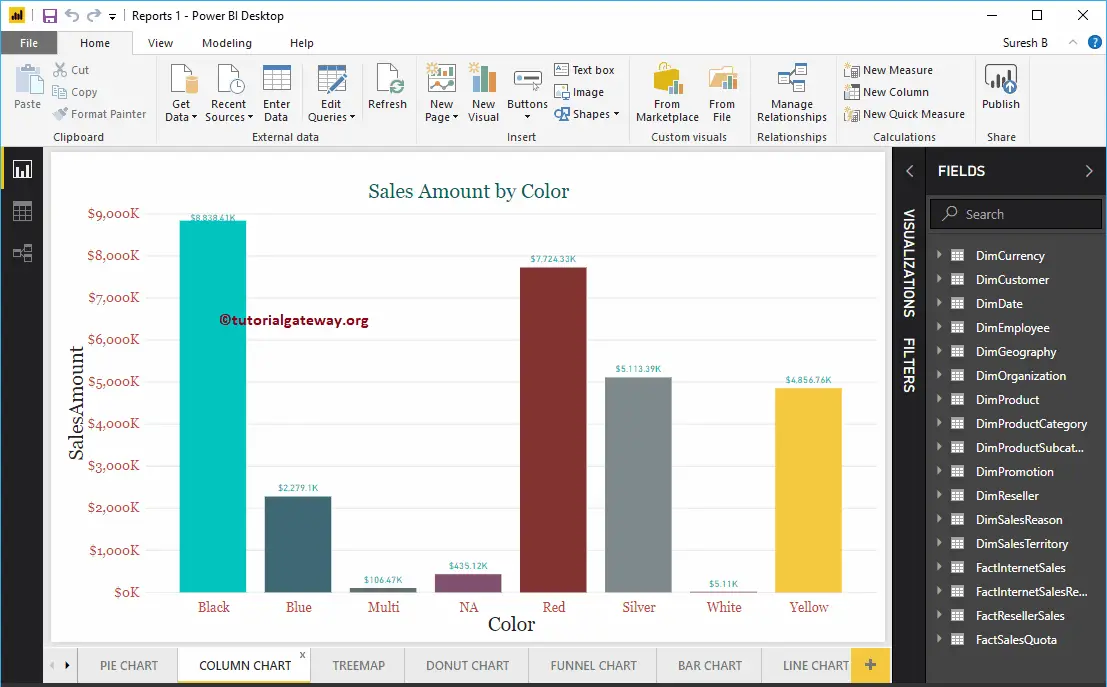
How to Publish Power BI Desktop Reports
Please Navigate yourself to the Home tab, and click the Publish button on the Top right corner.
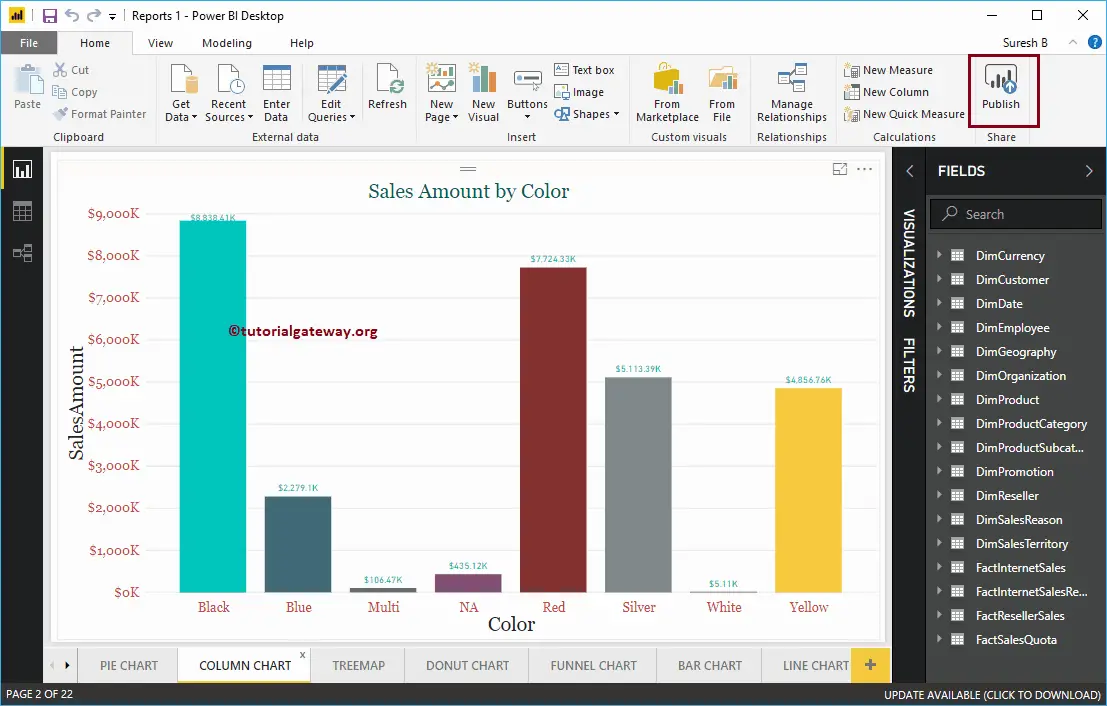
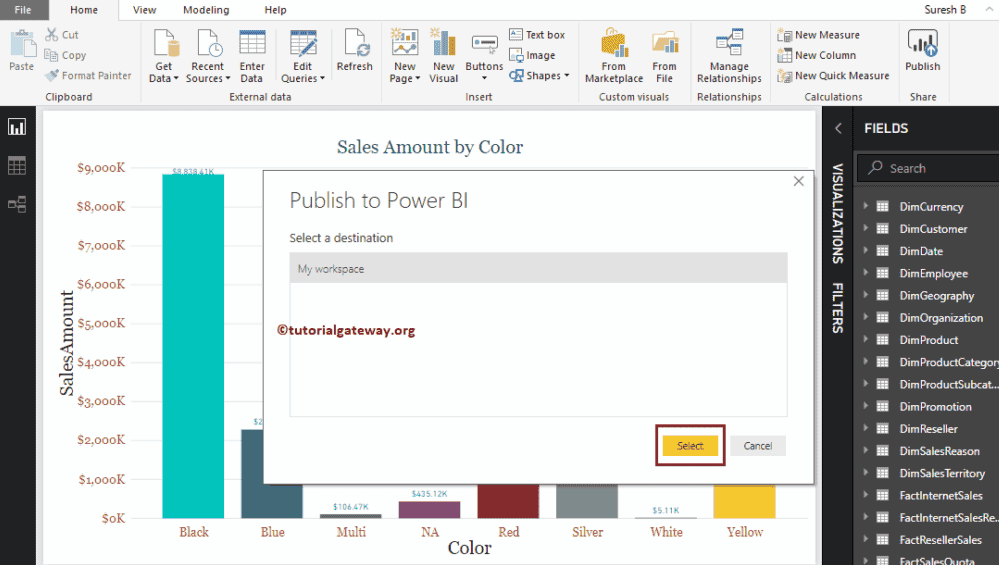
Clicking the Publish button opens a new window called Publish to Power BI. Under the destination section, you have to select the Workspace (if any); otherwise, select the default My Workspace.
Please wait until the publishing finished.
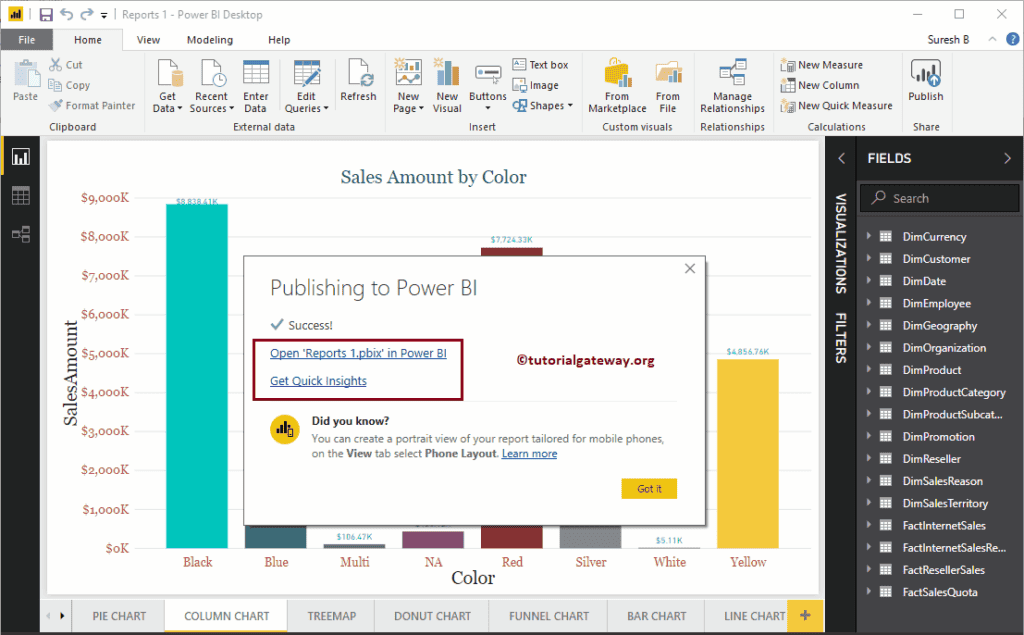
As you can see from the screenshot below, the report is published successfully. By clicking the Open Report hyperlink, you can see the report, and by clicking the Quick insights, you can see the data insights.
Let me open the Report in Power BI
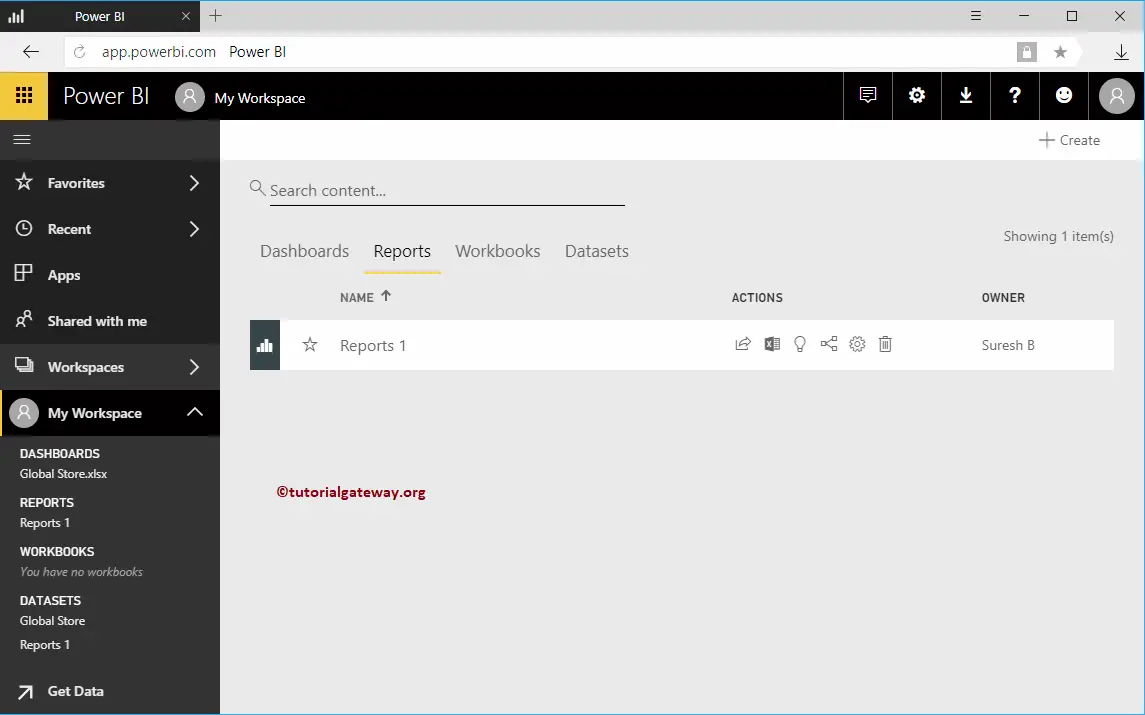
Now you can see the Report 1 inside your Workspace -> Reports tab. Click on Report 1 to see the pages inside that report
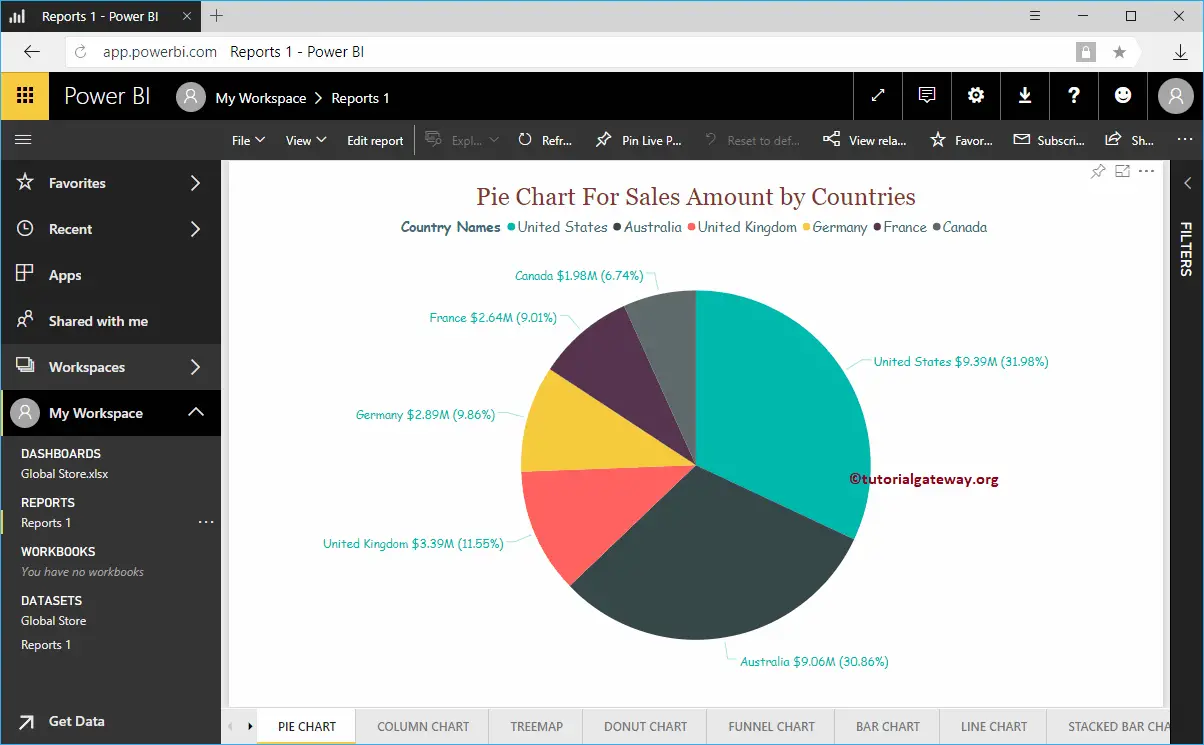
You can see the pages in the Report
Create Power BI Workspace
Power BI Workspace is a collection of Dashboards, Reports, Workbooks, and Datasets. The Power BI workspace is the complete work area of your organization. In this article, we show you how to create Power BI Workspace with a practical example.
Before we start creating Power BI Workspace, let me show you the list of Workspaces that are currently available.
As you can see from the screenshot below, currently, there is only one workspace available for this account. It is the default workplace created by the Power BI service.
How to Create Power BI Workspace
Please click on the Create App Workspace to create a new workspace in Power BI
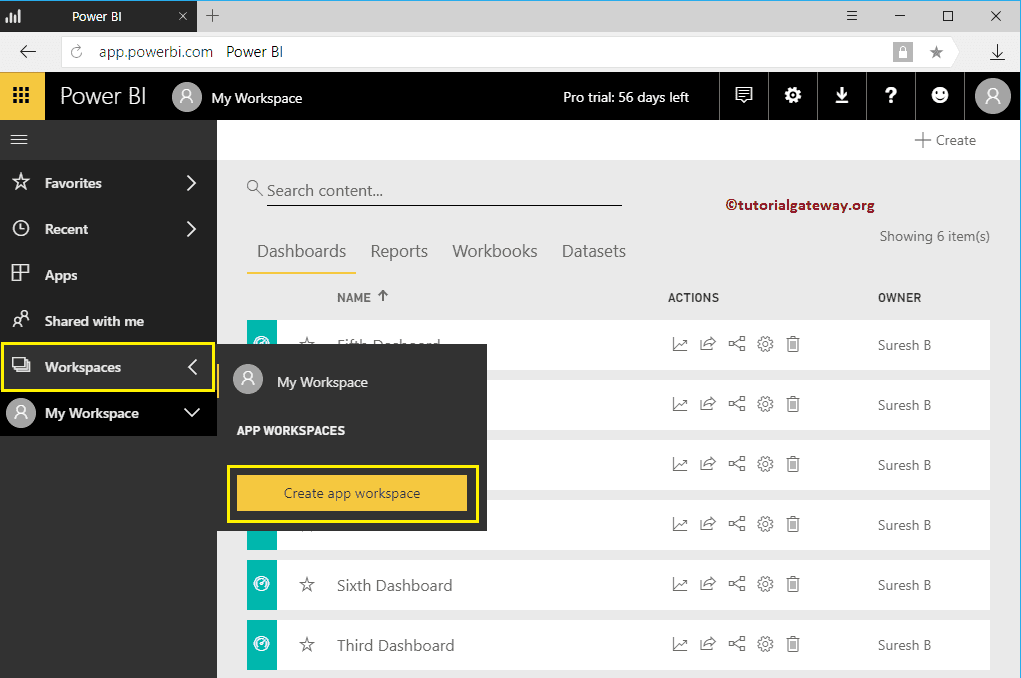
Clicking the Create App Workspace opens a new window to define the workspace.
- Name your workspace: Please specify the unique and valid name for your workspace.
- Add Workspace Members: You can add a member of this workspace.
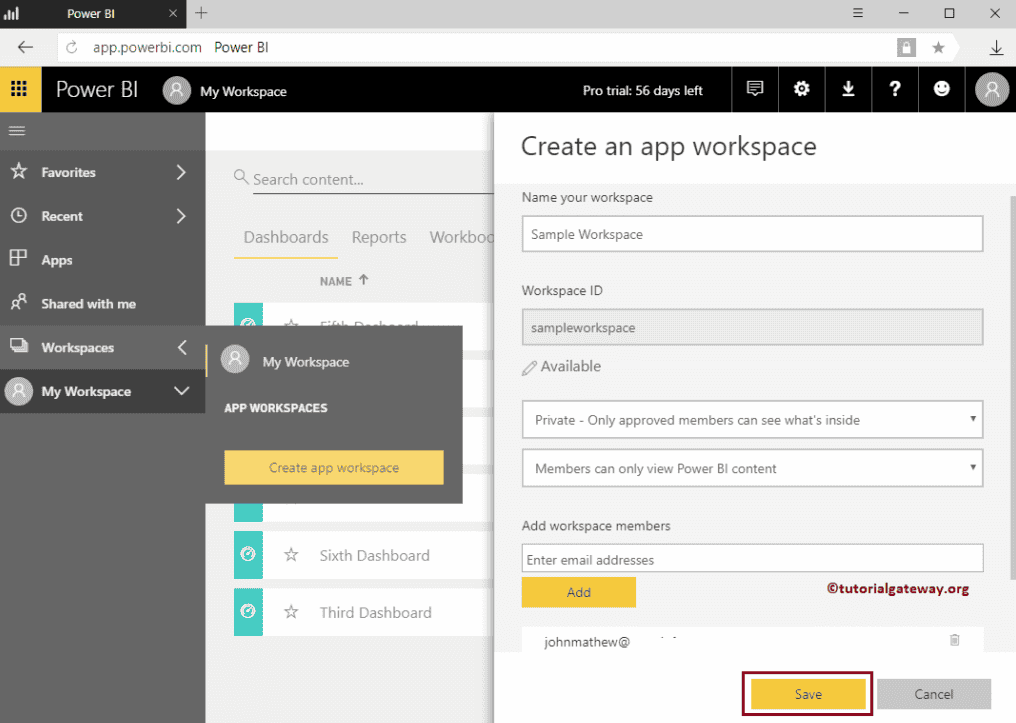
- Public – Anyone can see what’s inside: Anyone in this organization can see this workspace
- Private – Only approved members can see what’s inside: People added to this workspace can view
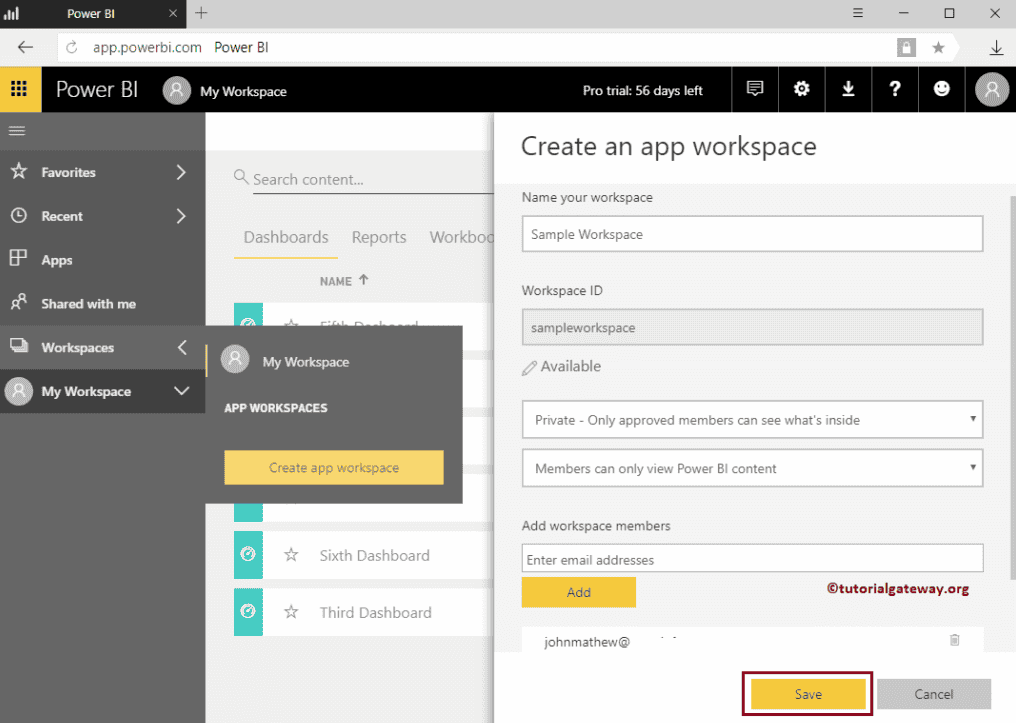
- Member can edit Power BI content: Allow people to edit the content
- Members can only view Power BI content: Restrict them from editing workspace content.
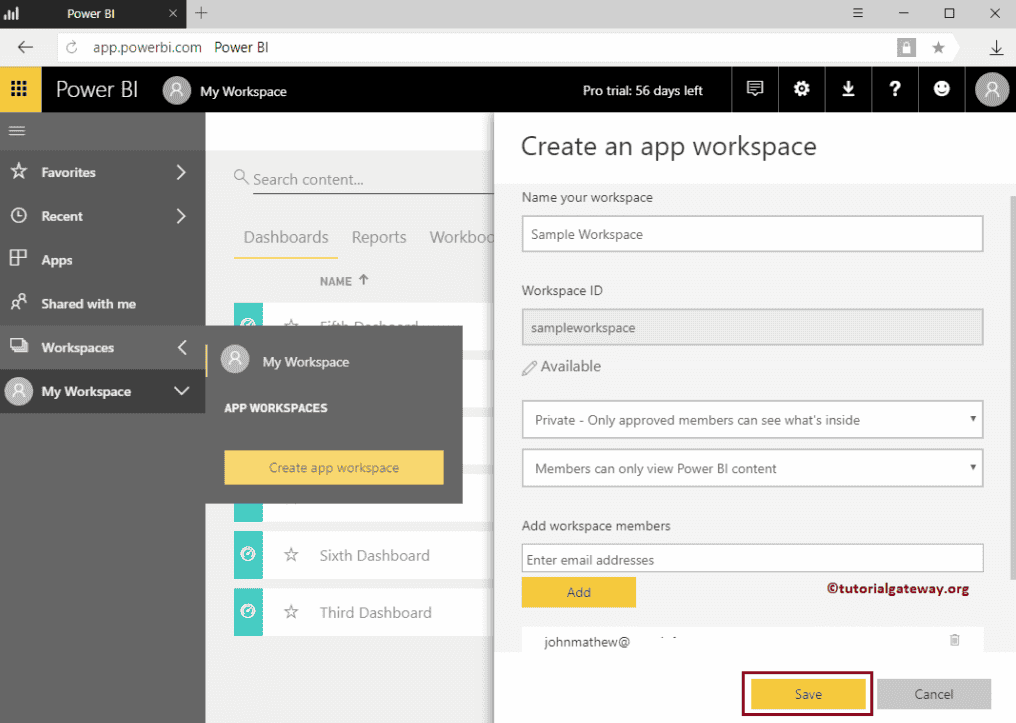
As you can see from the screenshot below, we assigned the name as Sample Workspace, restricted members to view (no alter). Next, we also added one of my colleagues, John, as this workspace member.
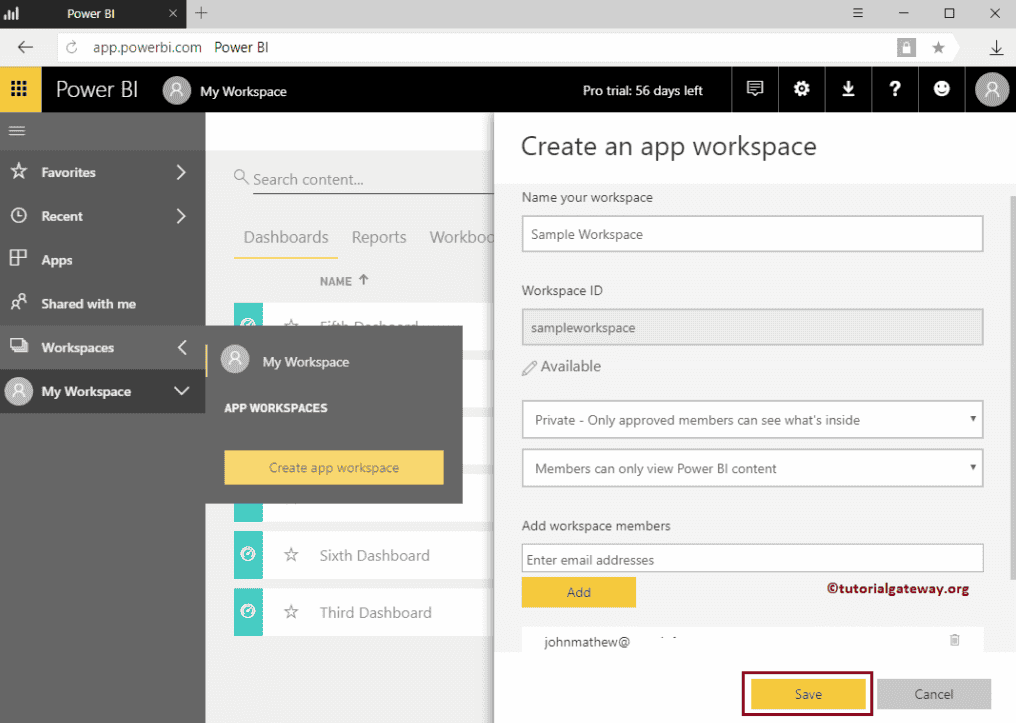
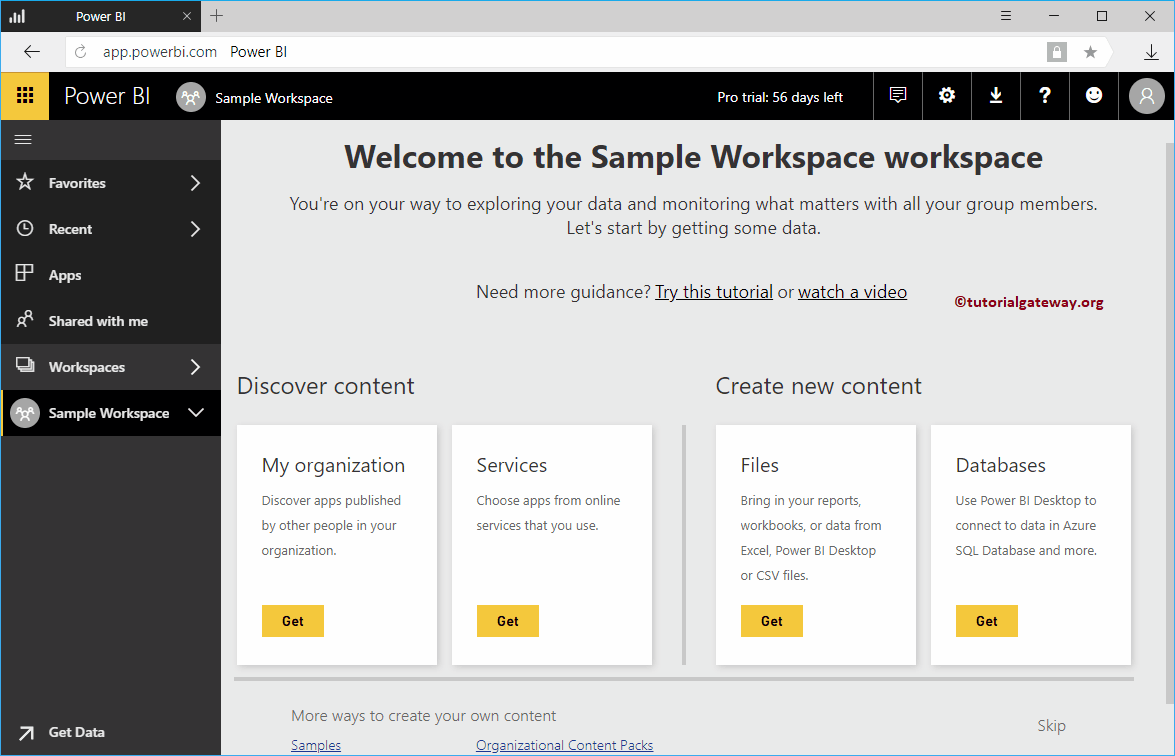
Clicking save button creates a New workspace in Power BI called Sample Workspace. By default, it opens the following window.
Either you can use this window to get data from different sources, or you can skip this page by clicking the skip button.
Once you click Skip hyperlink, the following window will display. Use this window to create Dashboards, Reports, Datasets, and Workbooks.
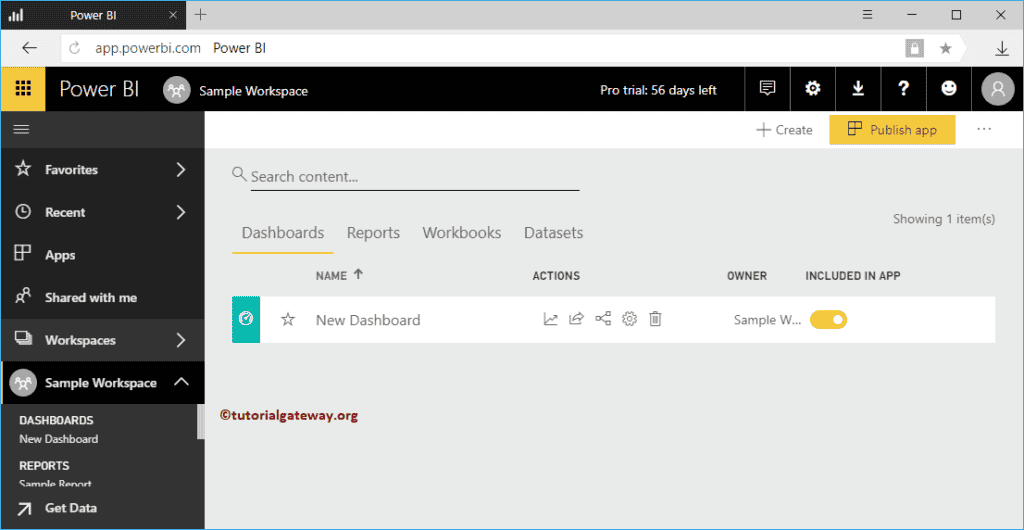
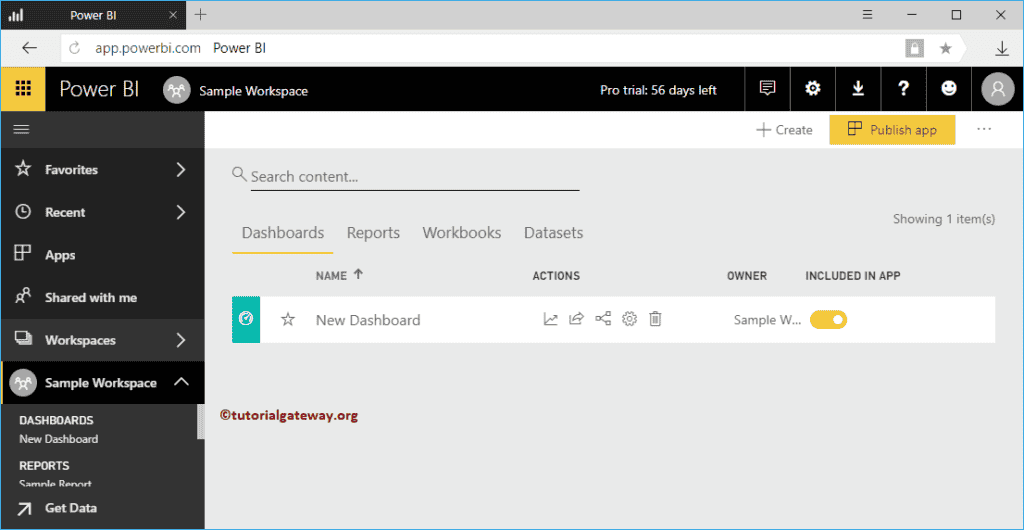
We just created one simple dashboard
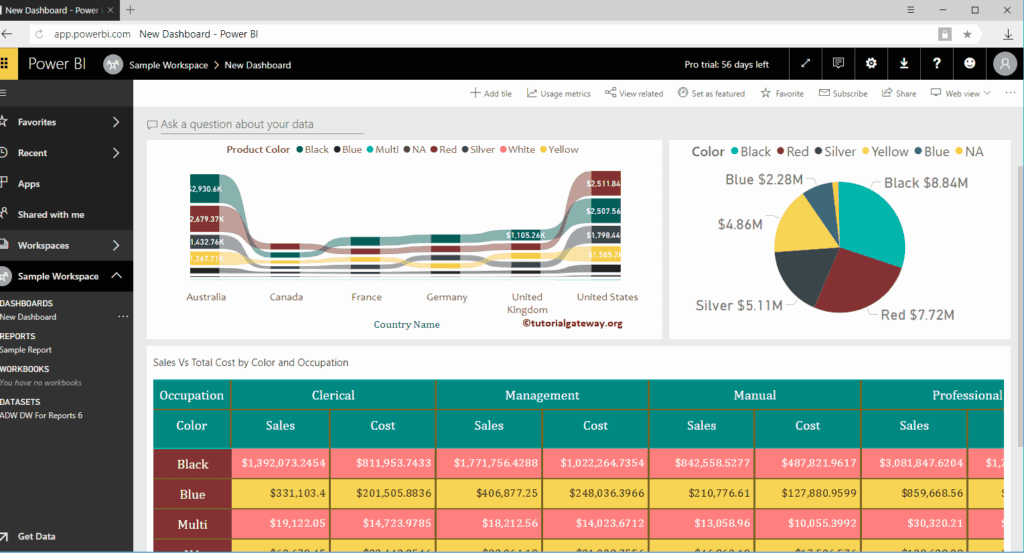
Let me show you the reports or tiles inside this dashboard
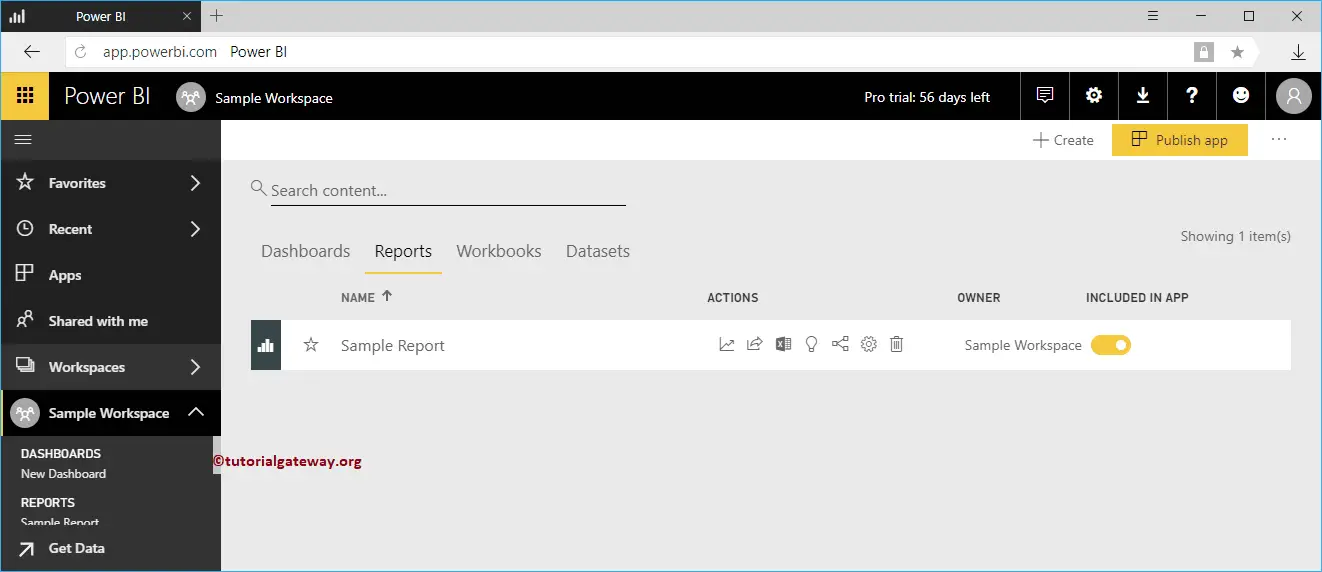
The screenshot below shows the Reports inside this Sample Workspace.
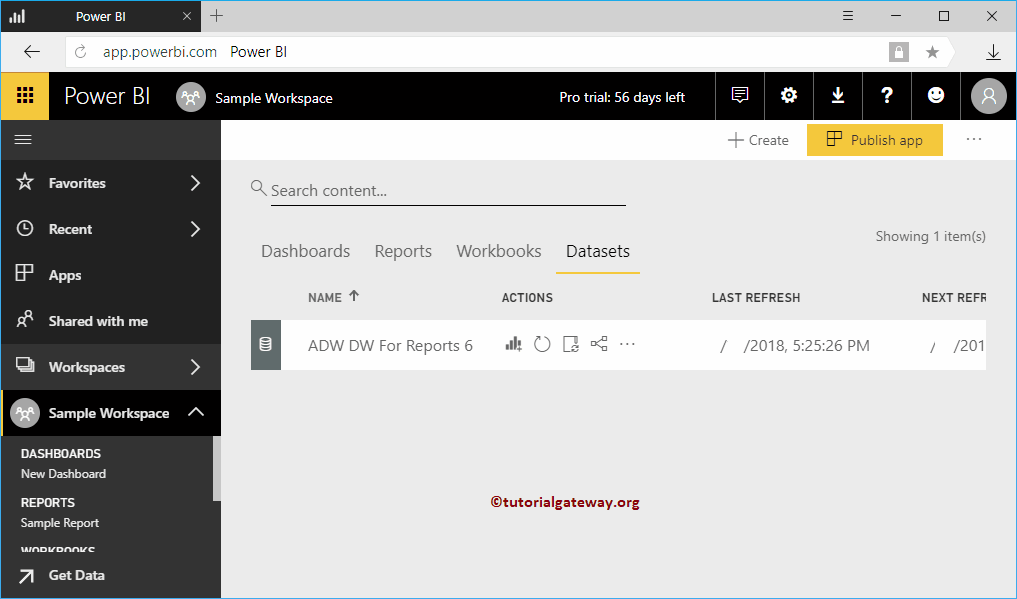
The screenshot below shows you the corresponding dataset. I suggest you to refer Publish reports from Desktop article to publish reports from Power BI desktop.
Create a Power BI Dashboard
Power BI Dashboard is a collection of reports that explains everything about the business. In this section, we show you how to create a Power BI dashboard with a practical example.
Before we start creating Dashboard, let me show you the list of dashboards that are currently available in my Power BI workspace.
As you can see from the screenshot below, currently there are no dashboards available in my workspace.

How to create a Power BI Dashboard
Creating a Dashboard is easy and straightforward. You have to use the + Create button for creating a dashboard inside your workspace.
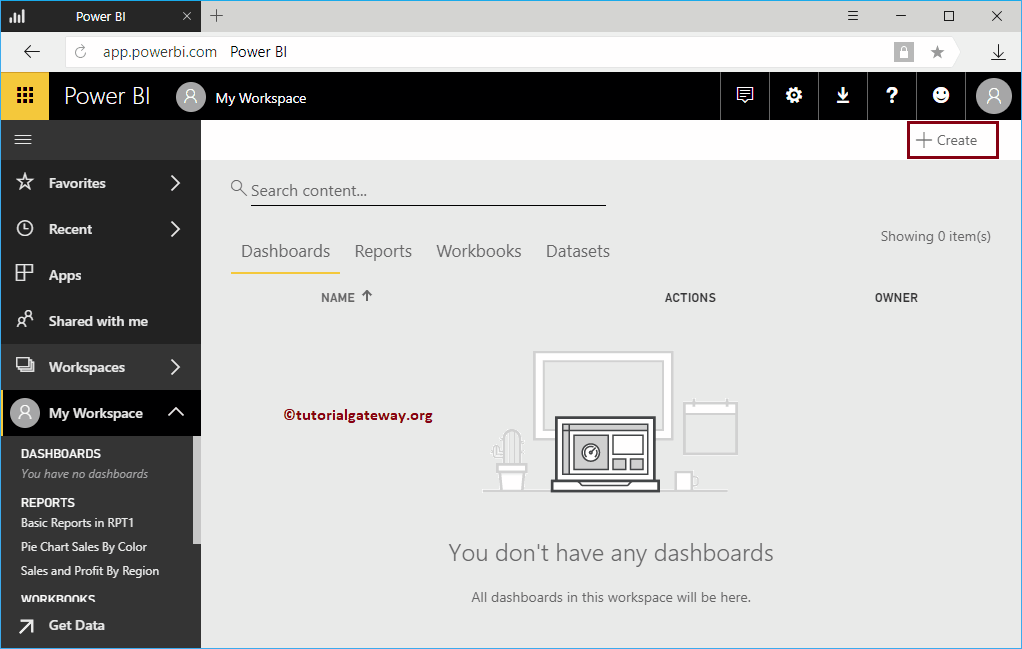
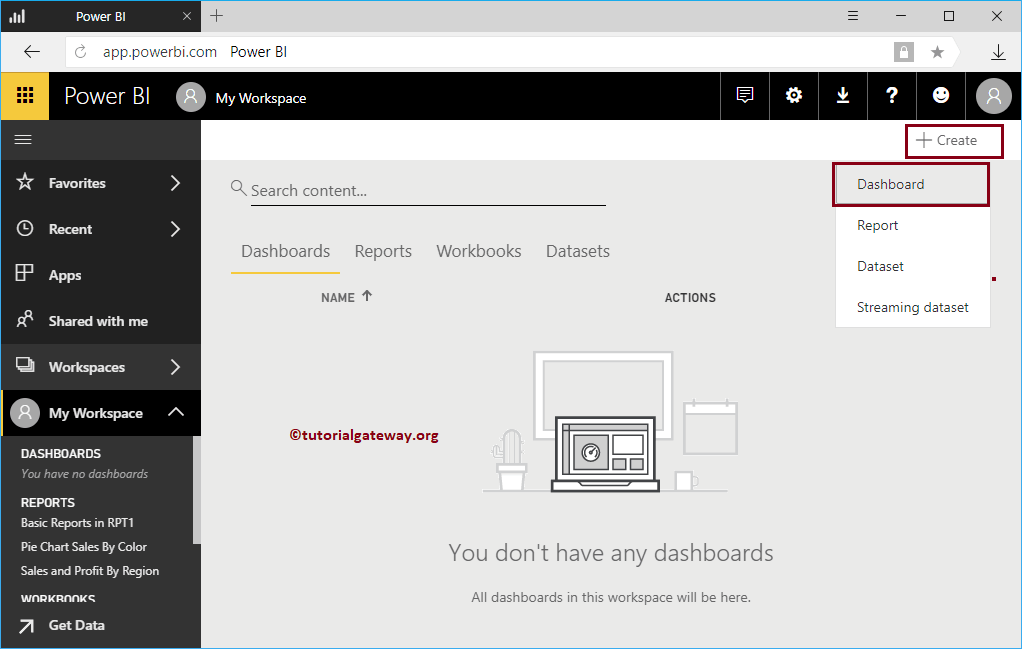
To create a new dashboard, click the Create button, and then select the Dashboard option from the context menu.
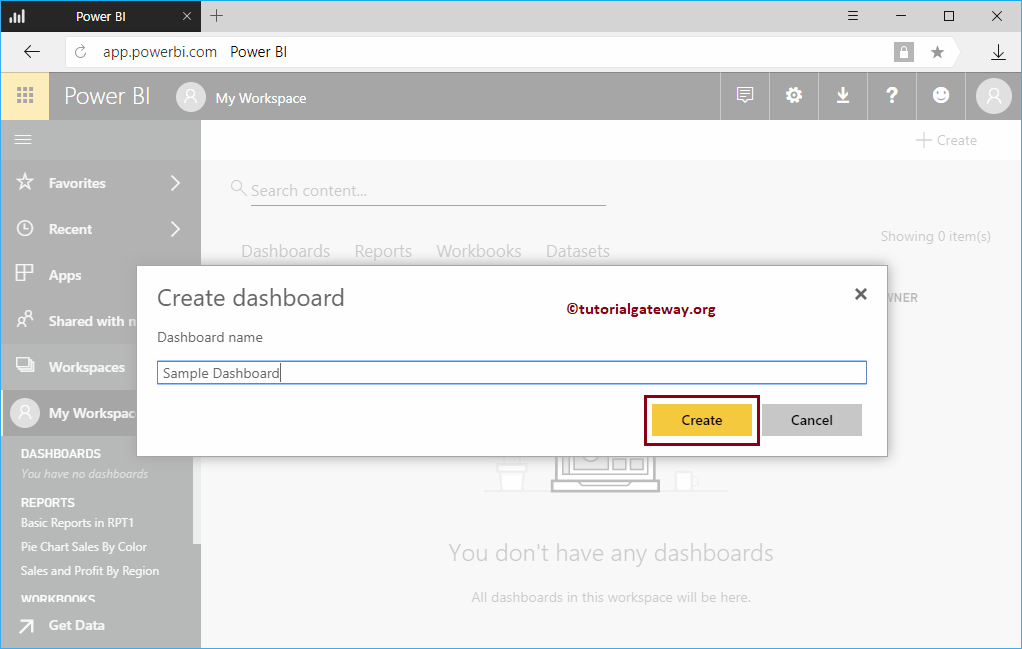
Selecting the Dashboard option opens a Create dashboard pop-up window. Please specify the dashboard name as per your requirement.
For now, we are assigning the Power BI dashboard name as Sample Dashboard
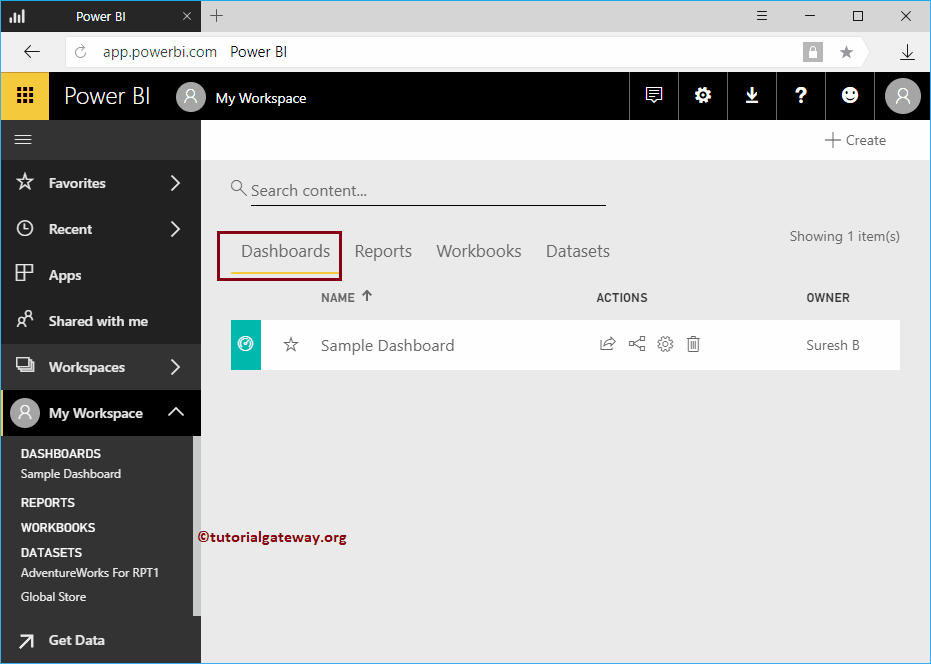
Now you can see the Sample dashboard under the My Workspace section in the left pane.
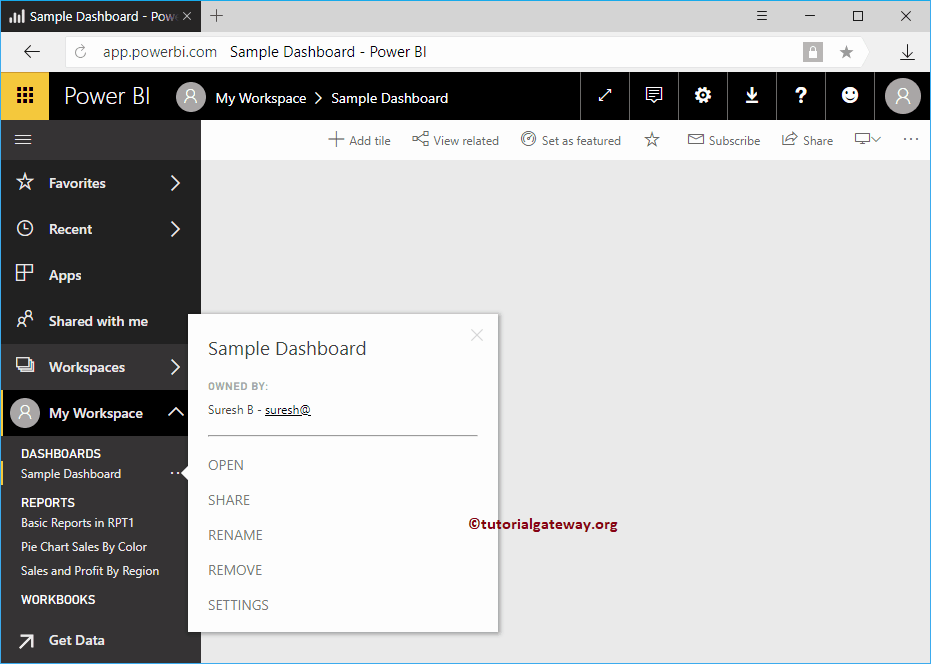
Let me navigate to My Workspace. Under the Dashboards tab, you can see the newly created dashboard.
Power BI Favorites
Power BI Favorites are the same as the Favorites of your Browser. If you find something (report, or a dashboard) interesting, then you can add them to Power BI favorites. By this, you can quickly access them.
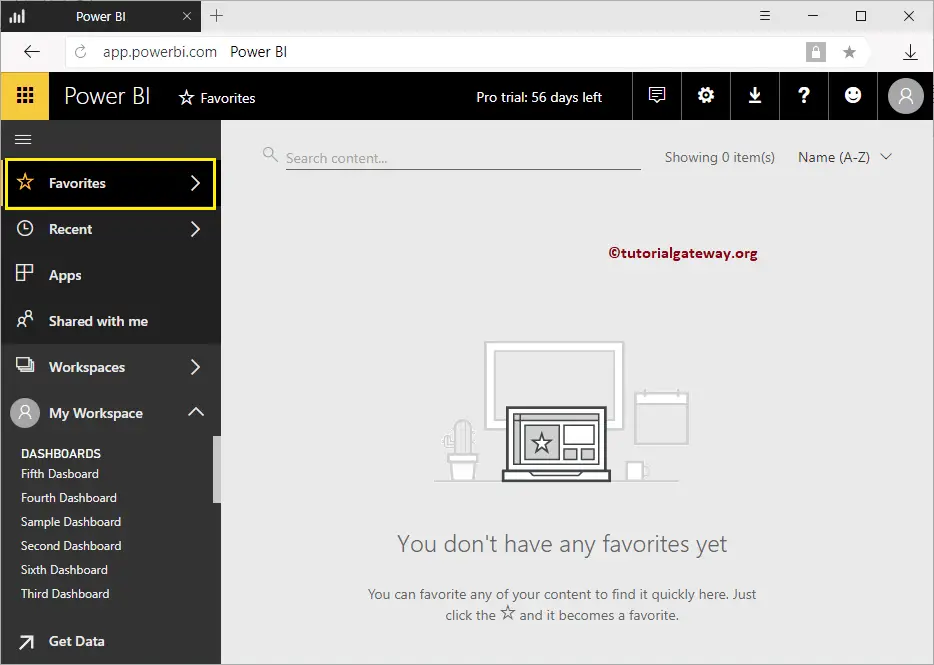
In this article, we show you the step by step approach to add Reports and dashboards to Power BI Favorites with a practical example. Before we start adding items to Favorites, let me show you the existing Favorites in my workspace.
To view them, please click on the Favorites tab in Power BI Left Navigation Pane. As you can see from the screenshot below, currently, there are no favorites in my workspace.
Add Dashboard to Power BI Favorites
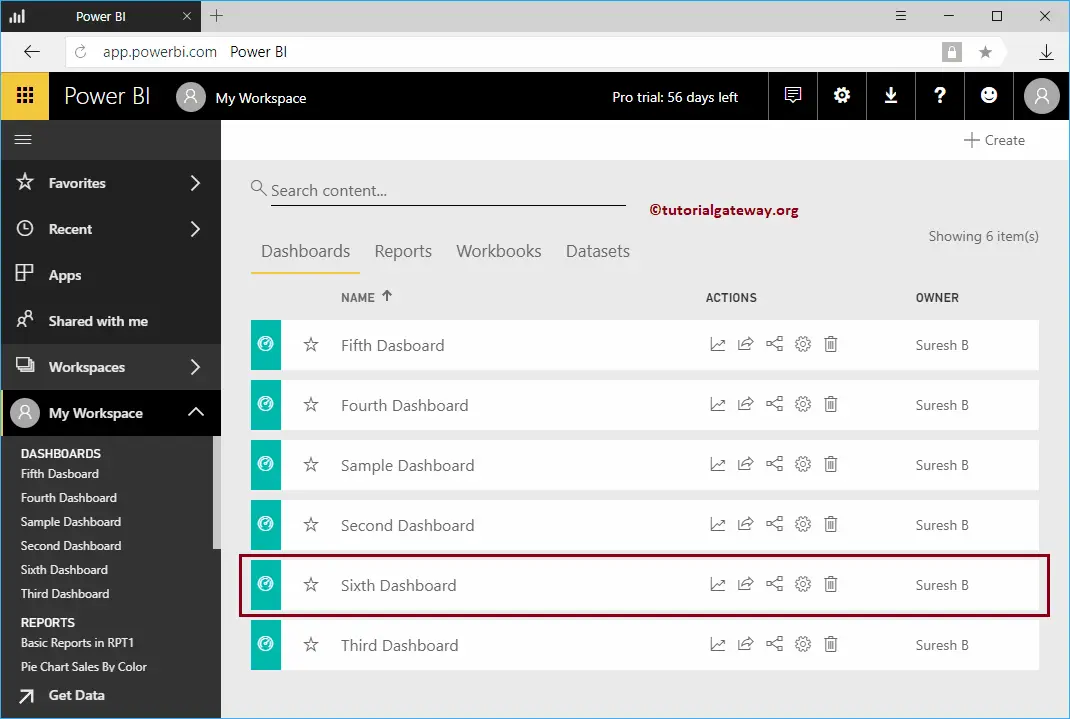
In this example, we add a dashboard to Power BI favorites. Before we start, let me show you the list of available dashboards.
To view them, please click on the Power BI My Workspace, and then go to the dashboards tab. In this example, we mark the Sixth Dashboard as favorite.
Let me click on the dashboard to see the visuals on it.
From the screenshot below, you can see the visuals available on this dashboard. Click on the Favorite button on Topbar
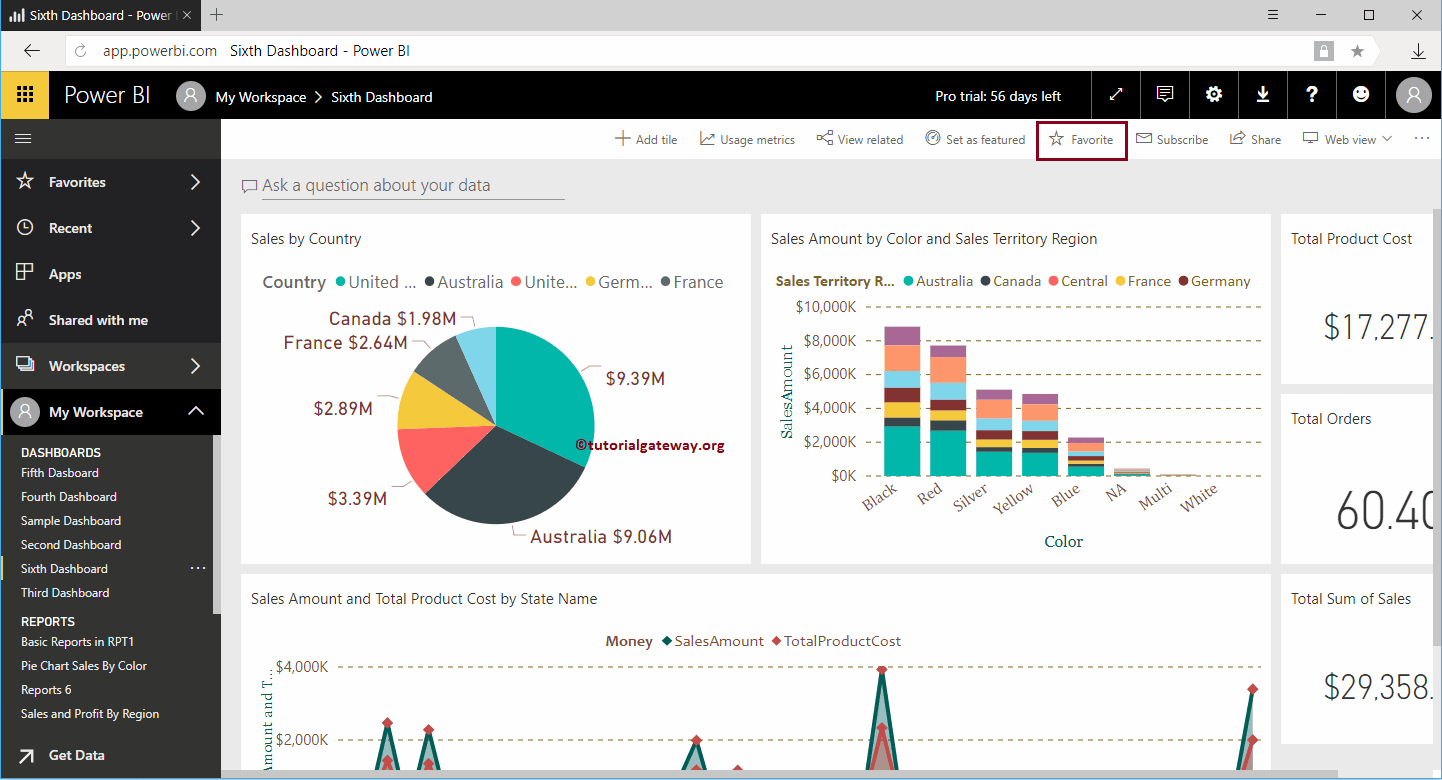
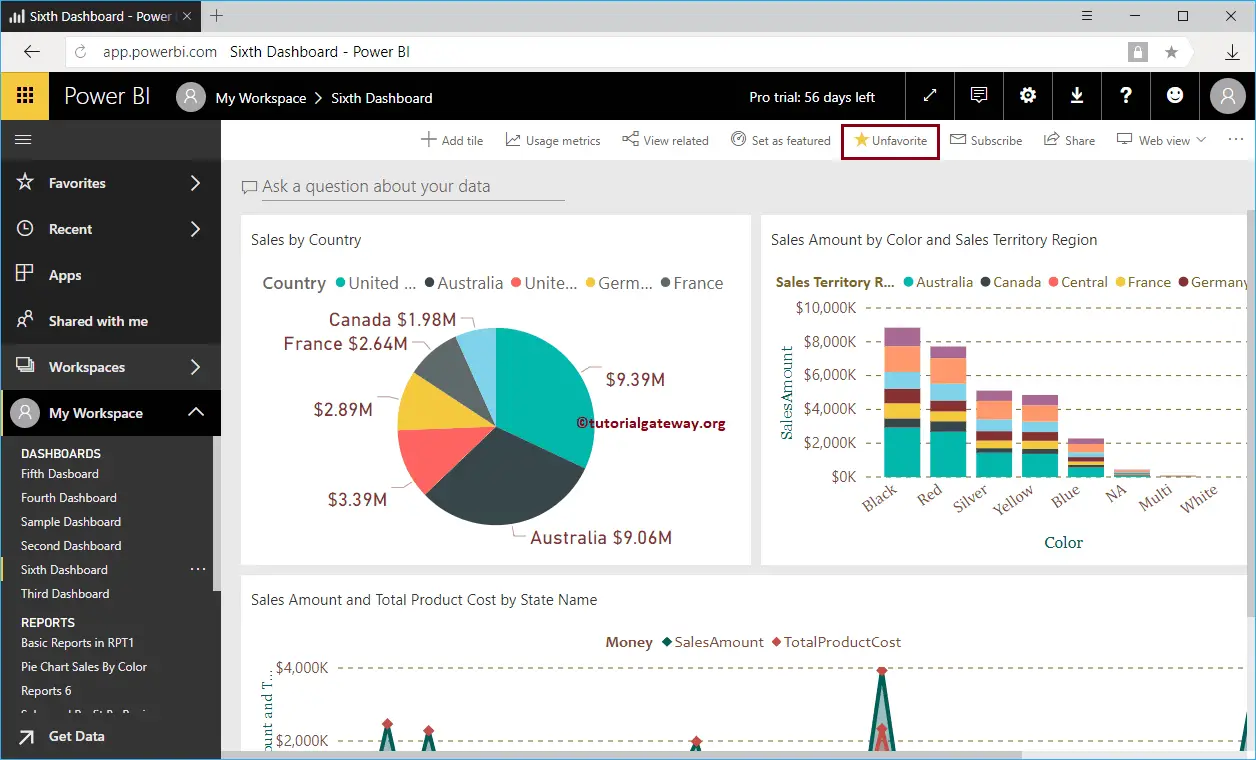
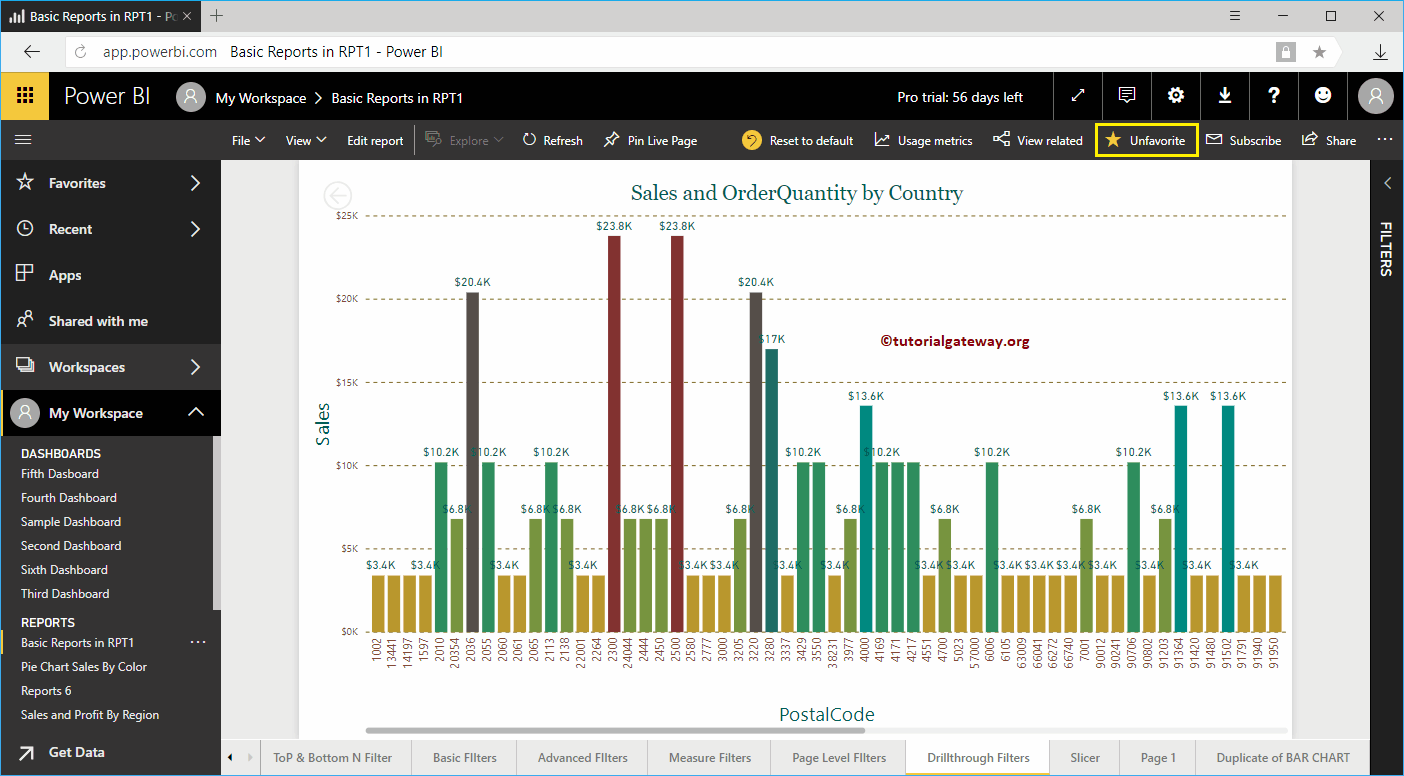
As you can see, it has added to the favorite list. Remember, you can click the Unfavorite button to remove this dashboard from the favorite list.
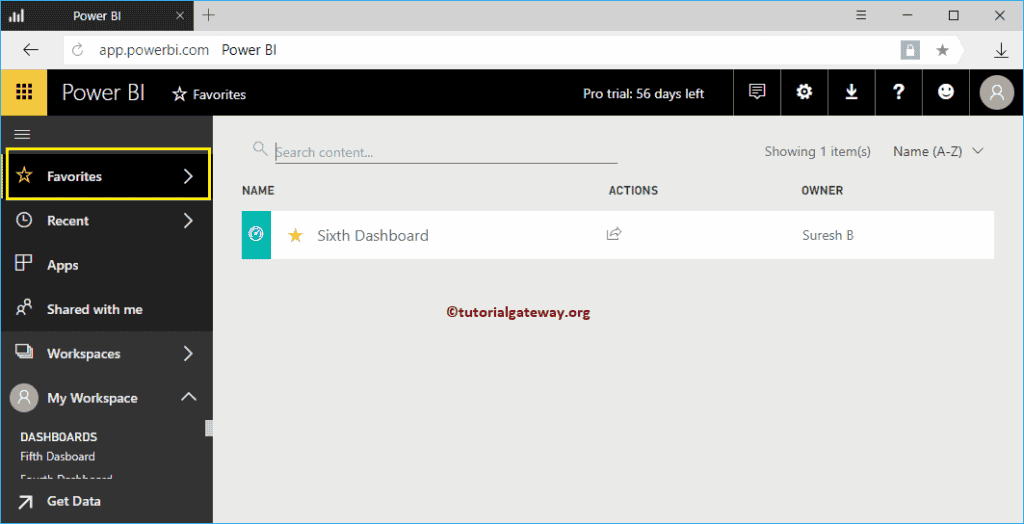
Let me open my favorite list.
From the below screenshot, you can see the Sixth Dashboard under this section.
Add Report to Power BI Favorites
In this example, we add Report to Power BI favorites. Let us see the list of available Reports.
To view the reports, please click on the Power BI My Workspace, and then go to the Reports tab. For the demonstration purpose, we mark Basic reports in RPT1 as a favorite.
Please click on the report to see the visuals on it.
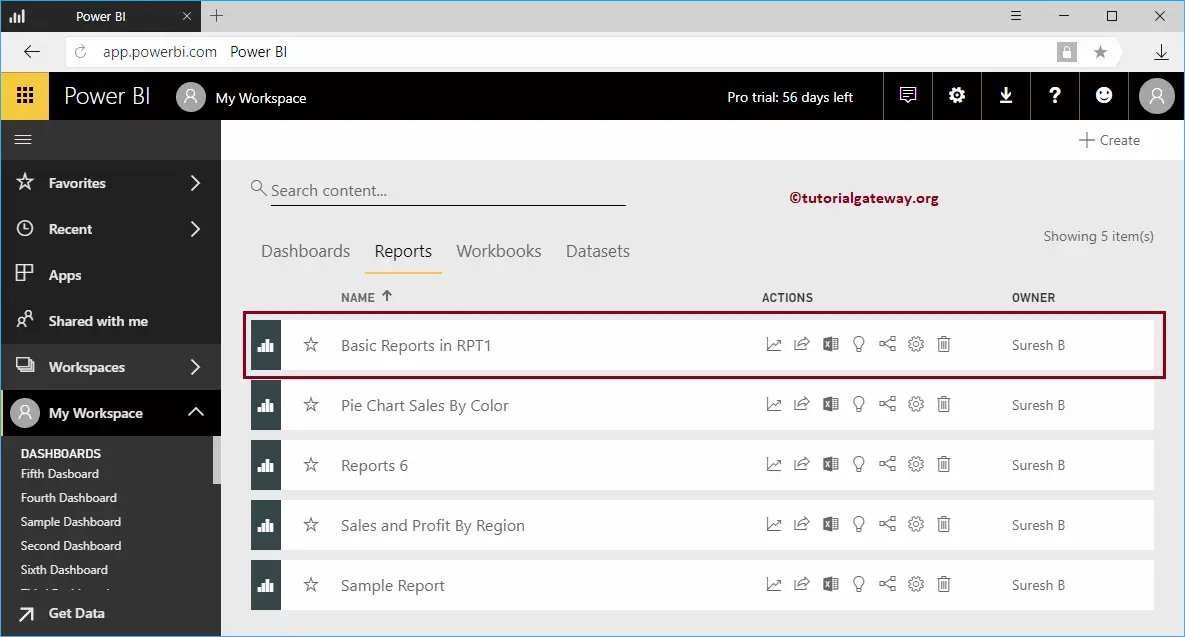
Next, click on the Favorite button on Top bar
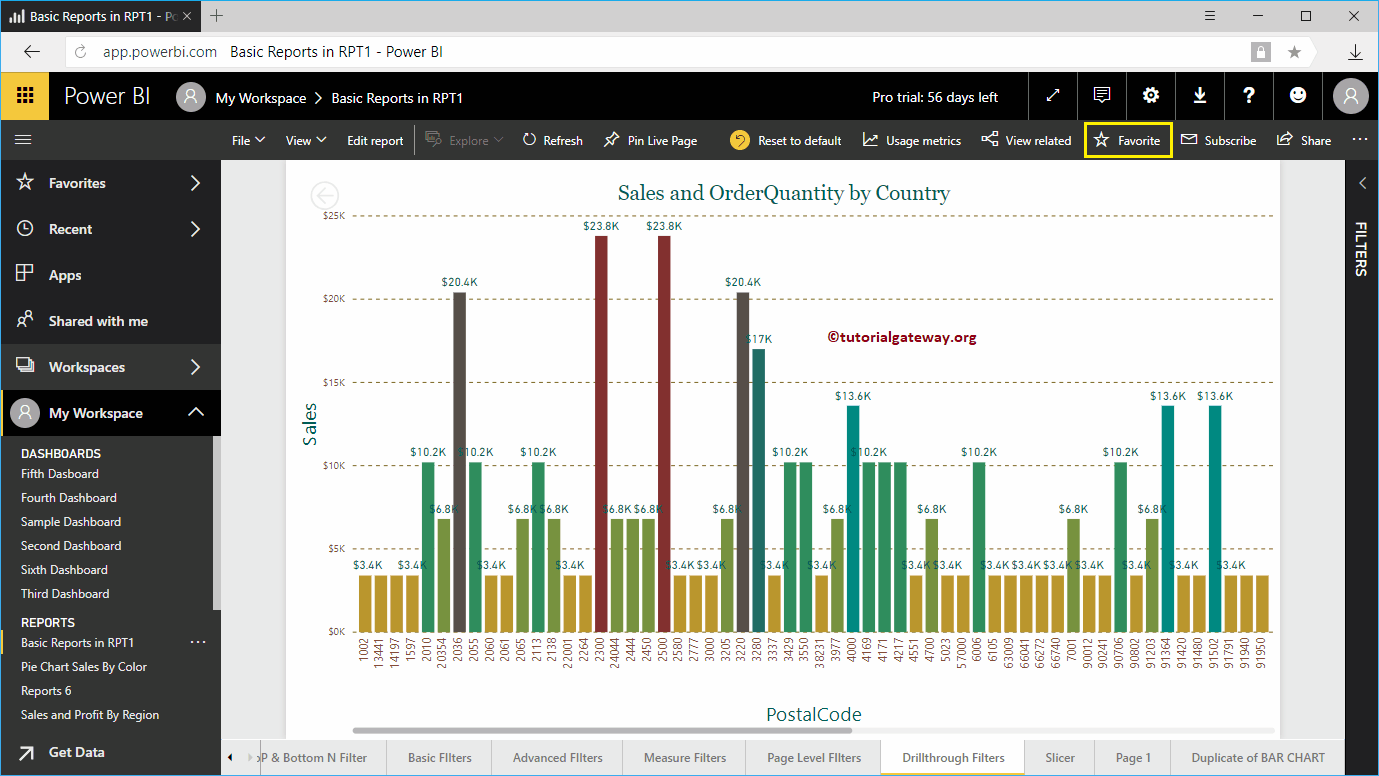
As you can see from the below, the report has added to the favorite list. Remember, click on the Unfavorite button to remove this report from the favorite list.
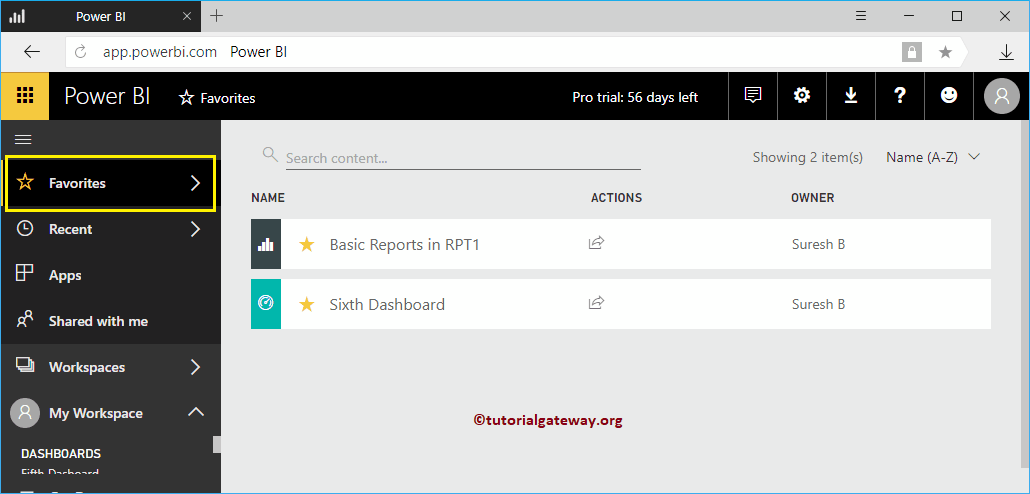
Please go to the favorite list to check whether we successfully added or not.
From the screenshot below, you can see the Basic reports in the RPT1 report under this section.
Remove Power BI Favorites
By clicking that little start, you can remove that item from favorite. For the demo purpose, let me remove the Basic reports in RPT1 from the favorite list.
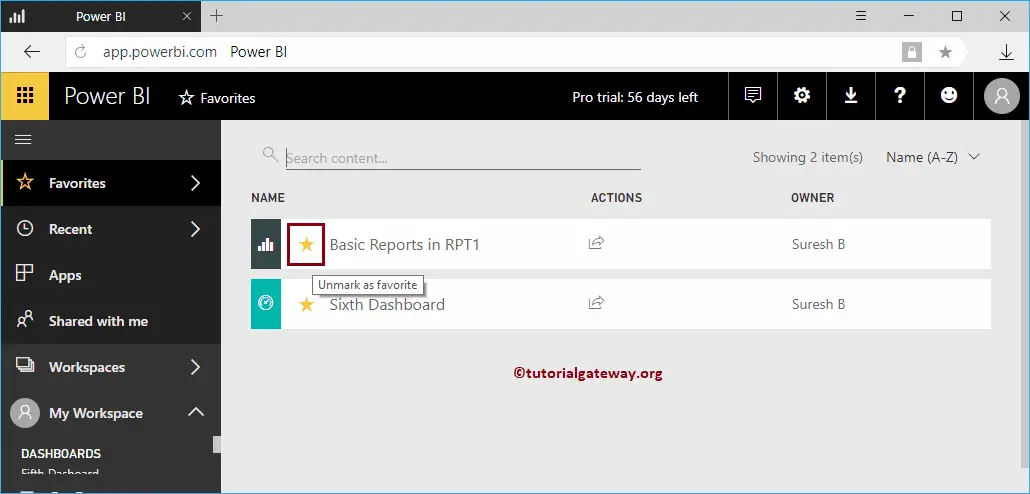
Now you see that the report removed
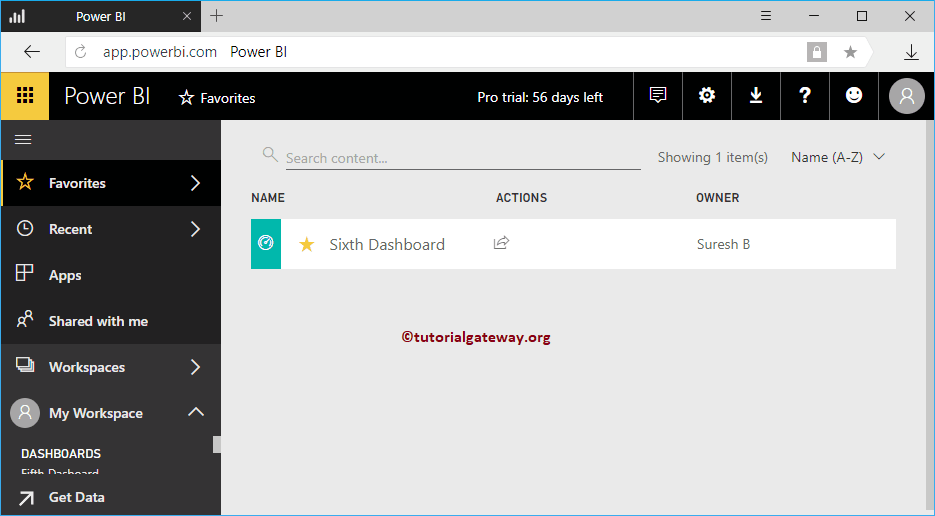
Add Dashboard to Power BI Favorites – Second Approach
It is a straightforward approach. Please go to the dashboards tab and click on the Star button beside the dashboard that you want to add as a favorite.
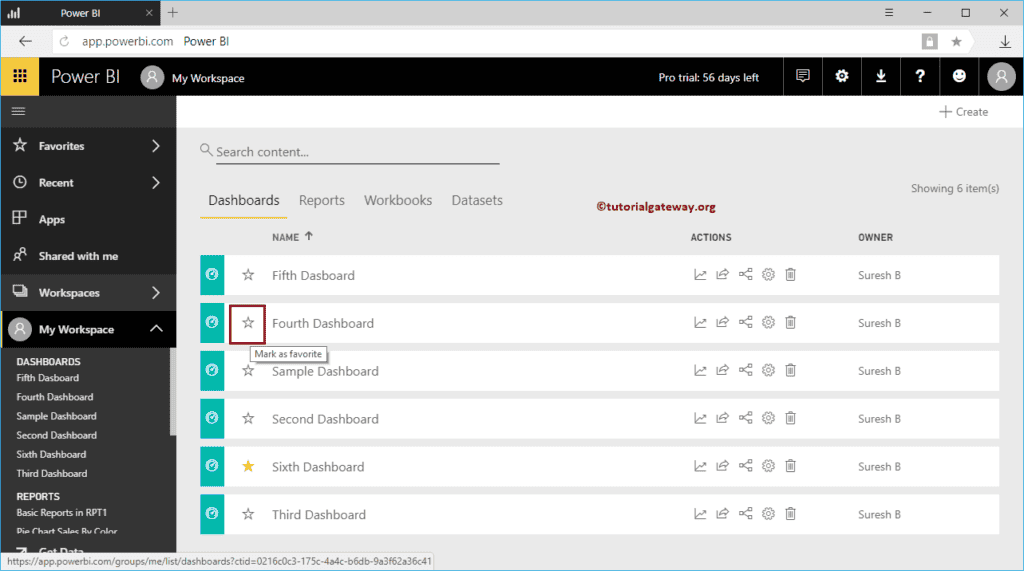
Add Reports to Power BI Favorites – Third Approach
Please go to the Reports tab and click on the Star button beside the report that you want to add as a favorite. Let me add Report 6 to the favorites list
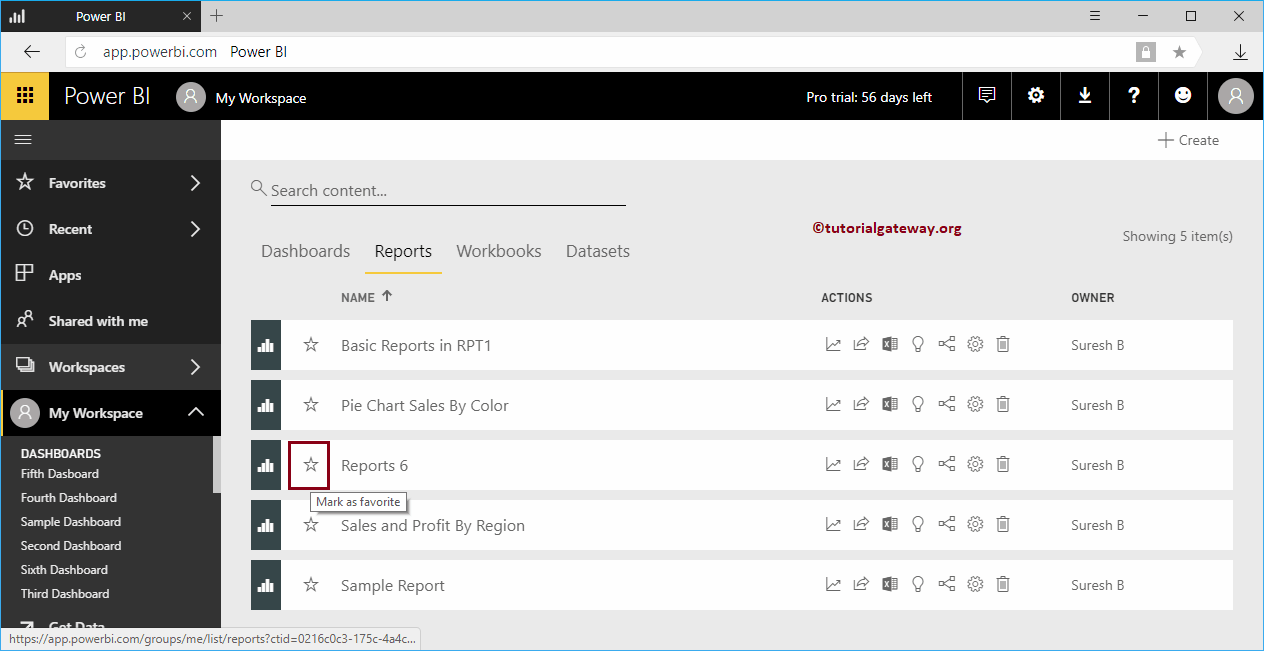
Now you can see the report 6 as a favorite
