Power BI Tutorial - Power BI Desktop Tutorial
Posted by Superadmin on August 19 2020 16:03:47
Power BI Tutorial
This MS Power BI Tutorial helps you to learn this tool from basic to advanced. Below set of Power BI links will show you the step by step approach to connecting with multiple data sources, data transformations, and creating reports like charts, tables, matrix, maps, etc with screenshots. Use them to learn Power BI step by step.
Power BI is one of the most popular Data Visualization tool, and a Business Intelligence Tool. This ms Power BI tool is a collection of data connectors, apps, and software services, which are used to get data from a different source, transforms data, and produce beautiful reports.
Power BI also allows you to publish them for your organisation. So that you can access them using mobiles, tablets etc. This MS Power BI tutorial explains this steps as well. So, read this completely to learn Power BI
Power BI Desktop Tutorial
We can install the Power BI desktop on our local computer to create our reports. By using this Power BI desktop, we can connect to different data sources such as text files, databases, excel files, etc. Next, we use this data to build Power BI reports by dragging the required charts. Finally, we can share those reports across the organization.
This section of Power BI tutorial covers the establishing connections, preparing data etc
- Download and Install BI Desktop
- Add, Rename, Duplicate, and Delete Pages
- Connect to SQL Server
- Connect to Multiple Excel Sheets
- Get Data from Excel Files
- Get Data from Text Files
- Load Data from Multiple Data Sources
- Remove Unwanted Columns from Tables
Download and Install Power BI Desktop
In this section, we show you how to Download and Install Power BI Desktop with screenshots. Installing the Power BI Desktop includes the following steps. So, please follow the steps as we mentioned below.
Steps to Download and Install Power BI Desktop
The following are the steps involved in download and install Power BI Desktop.
Download Power BI Desktop
Power BI Desktop is a Free windows based application. You can use this Desktop to Shape the data in a proper format, and to design reports as per the requirements.
In order to download Power BI Desktop, first Go to the official tableau website by clicking this link Download Link.
TIP: You need Power BI Pro access to publish the report, and sharing them.
The below screenshot shows you the Downloads page. Either you can click the Download button, or you can click the hyperlink of Advanced Download Options.
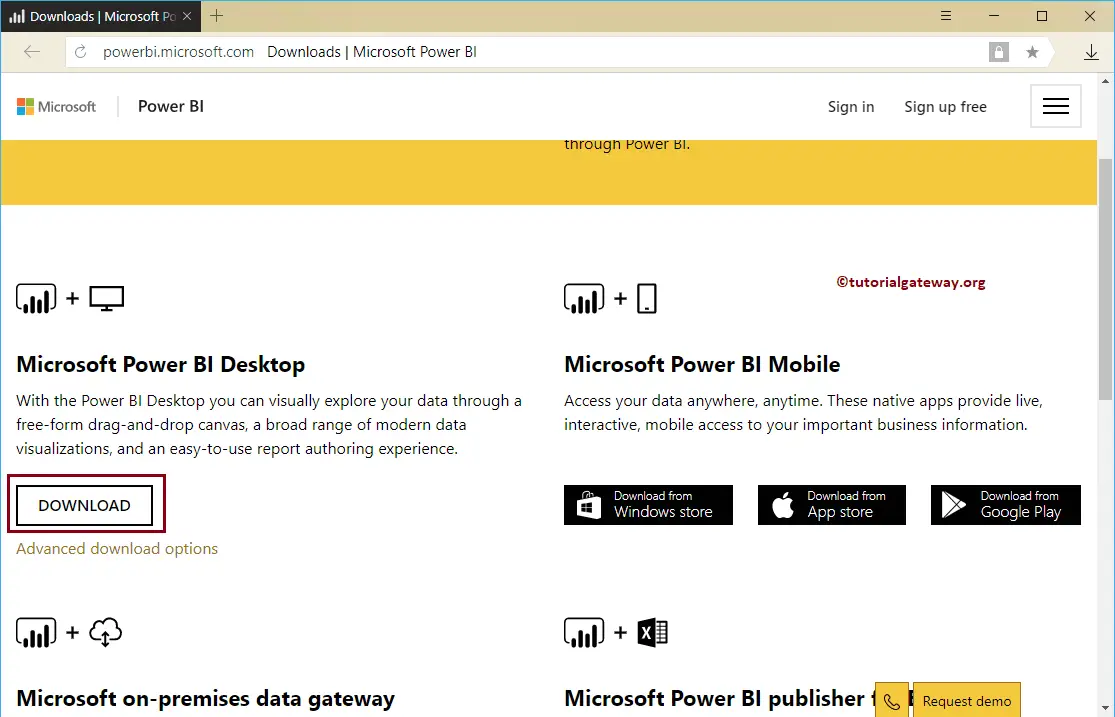
Clicking the Advanced Download Options takes you to the Microsoft website. Here, you can read the Installation steps, software, and hardware requirements.
Click the Download button to download the Microsoft Power BI desktop from this location
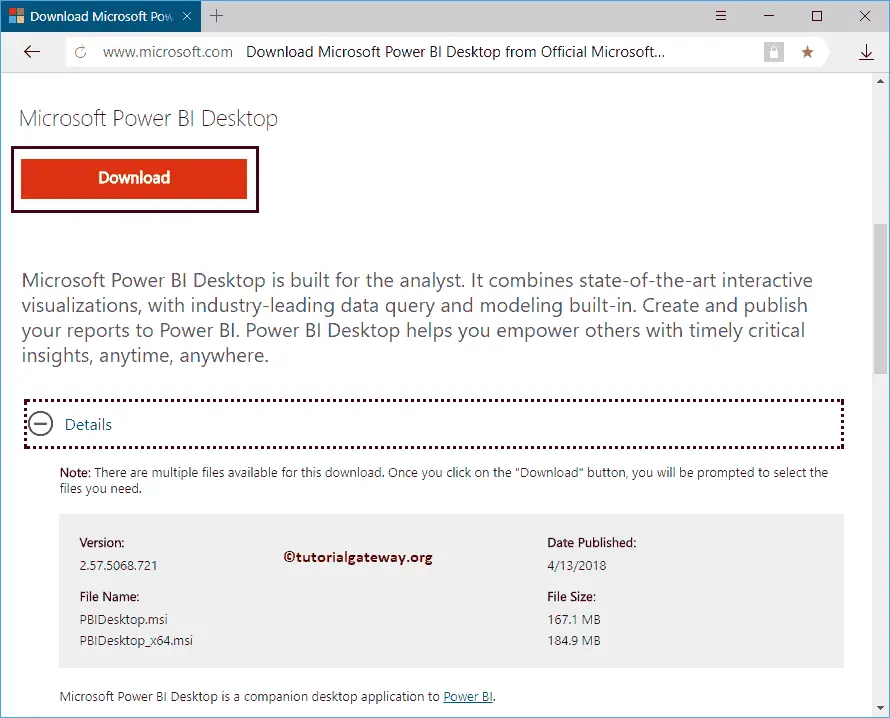
Install Power BI Desktop
To install the Power BI desktop, Please navigate your file system to the Power BI Software that we downloaded previously. Next, click on the application.
Once you click on the application, the below-shown window will open. It is a Security warning, and it may appear if you have any security measures; otherwise, skip to the next step.
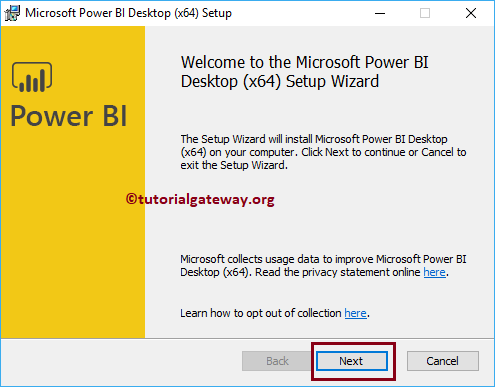
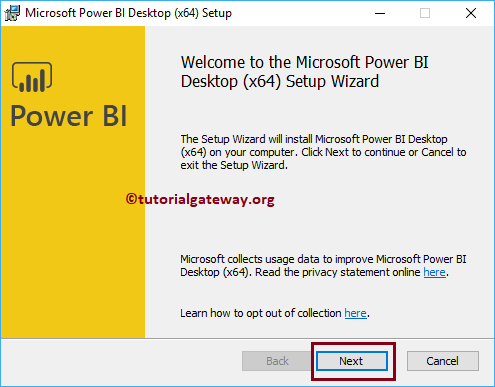
The first page of the Power BI install is a Welcome page. Please click the Next button
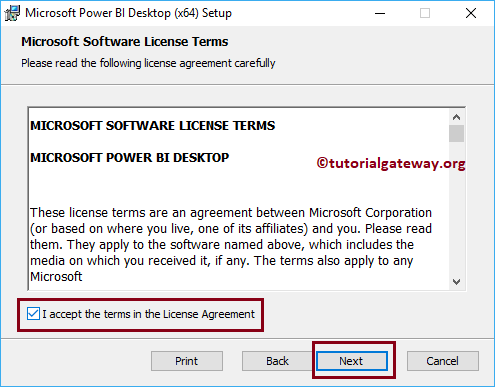
Please, checkmark the I accept the terms of the Licence Agreement option and click the Next button.
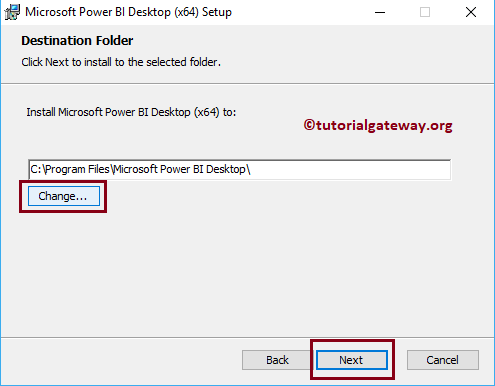
Select the location where you want to install this application. Here, either you can leave the default C location or use the Change button to alter the installation directory.
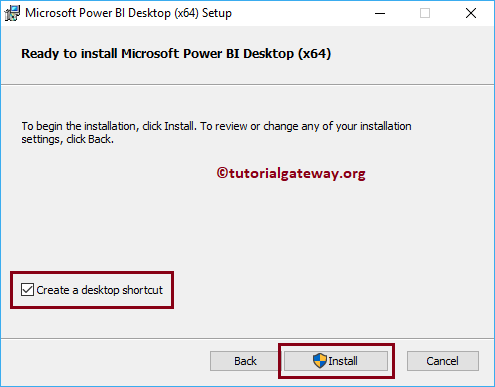
Next, Click the Install button
Wait until the installation completed.
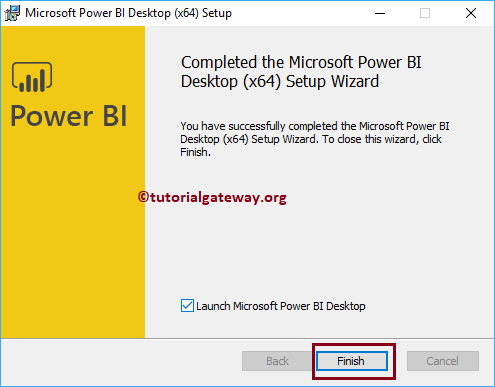
Click the Finish button to complete the installation process
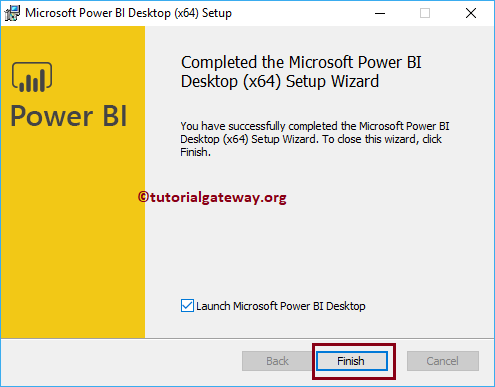
Wait till the Power BI Desktop initializes the desktop features.
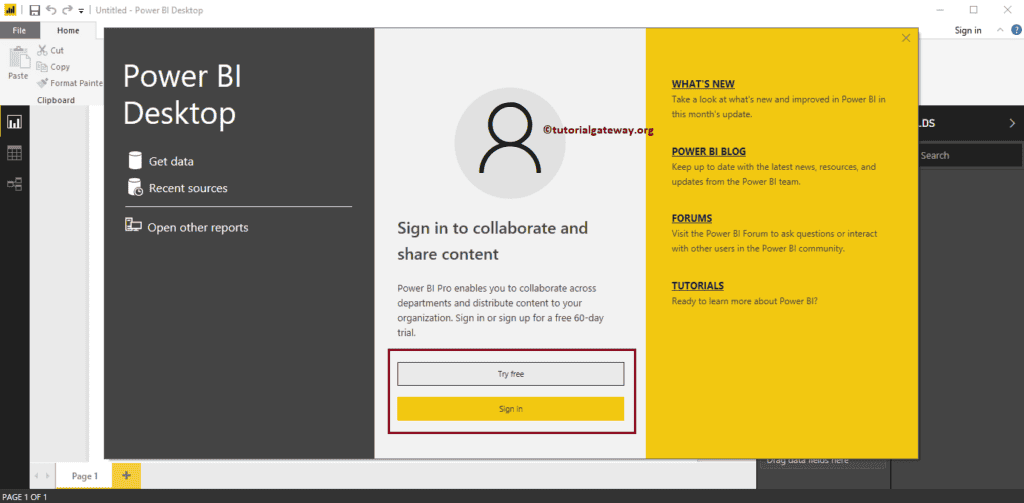
Now you can see the installed Power BI Desktop. Let me close the start page
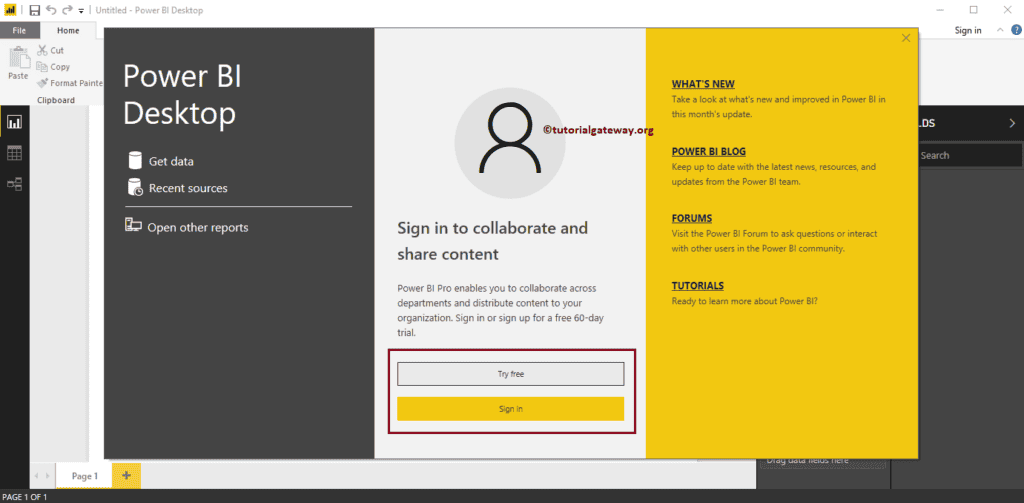
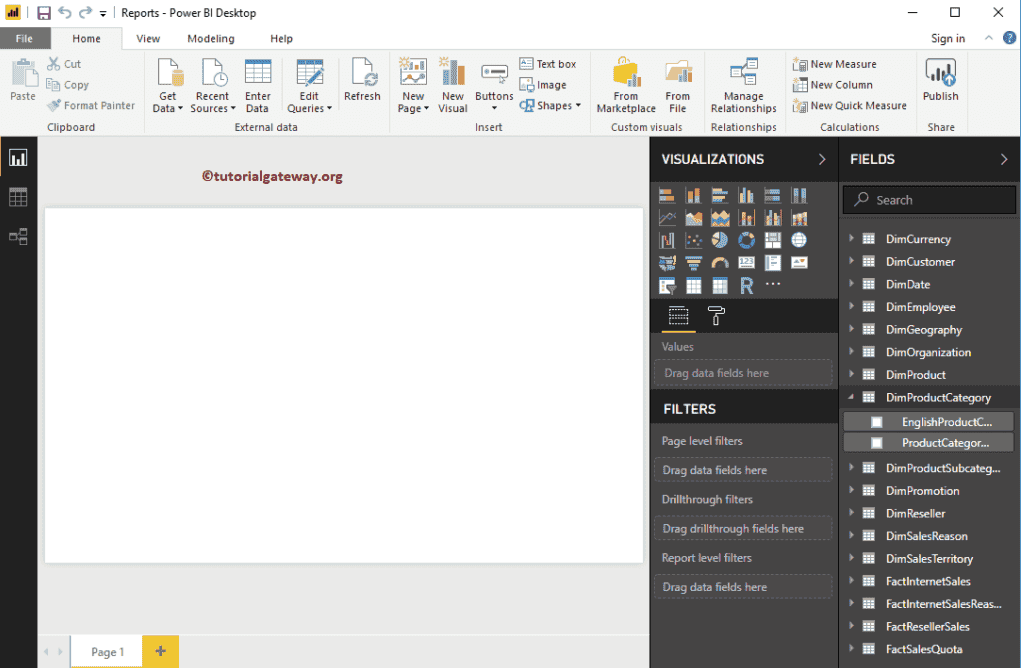
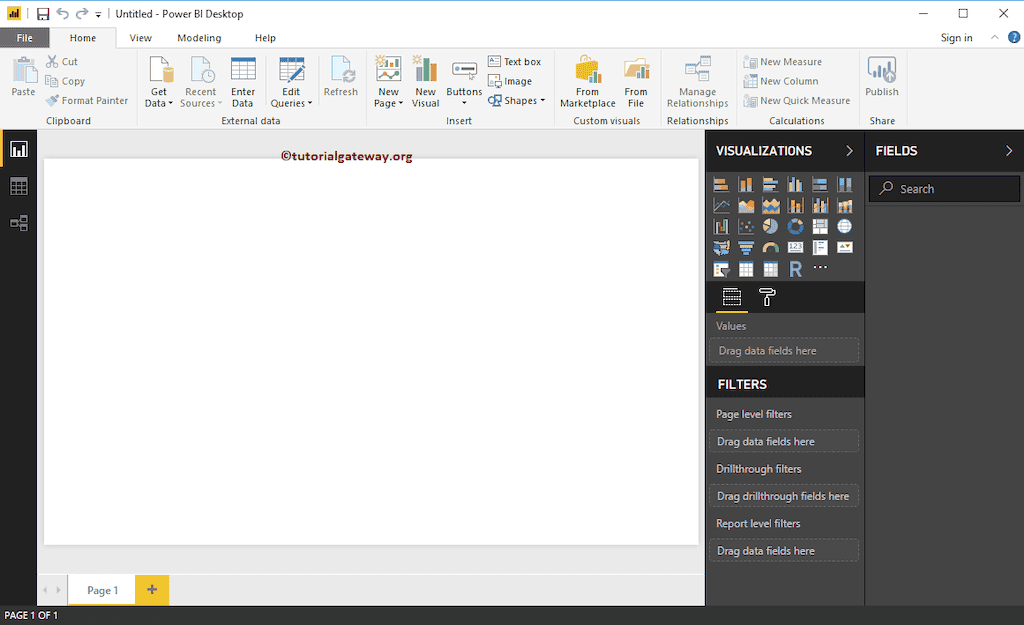
It is the Power BI Desktop, where we load data from different sources, design reports, and publish them.
Add Rename and Duplicate Pages in Power BI
In this article, we show how to add New Pages, Rename the Pages, Hide Pages, Duplicate Pages, and Delete Pages in Power BI with an example.
For the Add Rename and Duplicate Pages in Power BI demo purpose, we are going to use the Pie Chart that we created earlier. Please refer Pie Chart in Power BI article to understand the steps involved in creating Power BI Pie Chart.

Add Rename and Duplicate Pages in Power BI
The following are the ways to change page names, add new pages, duplicate existing pages, and delete pages in Power BI.
Rename a Page in Power BI
Right-click on the existing page name at the bottom open the context menu. Please select the rename option, as shown below. Or double-click on the Power BI page title allows you to rename it.
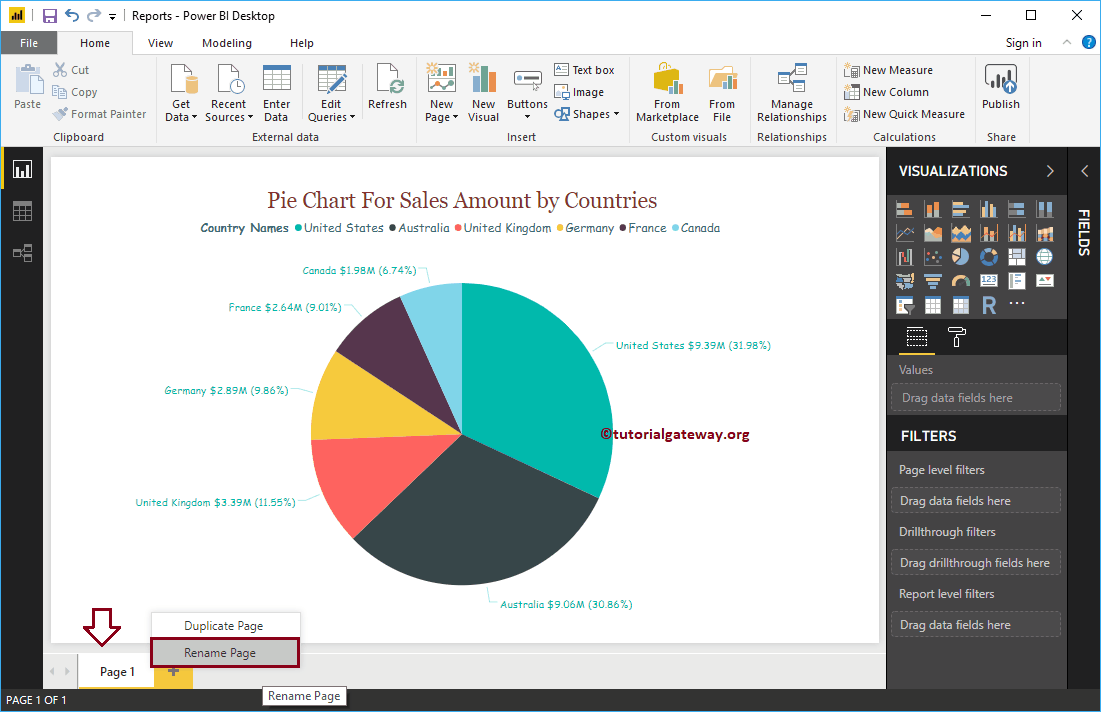
We are renaming the Page to Pie Chart
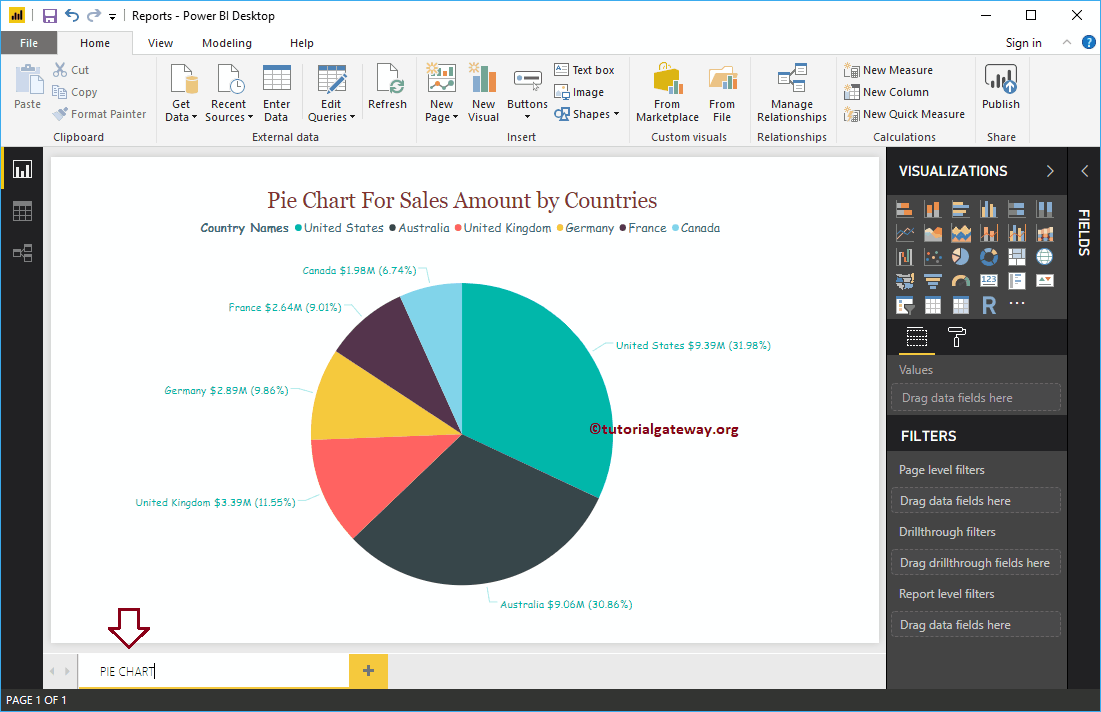
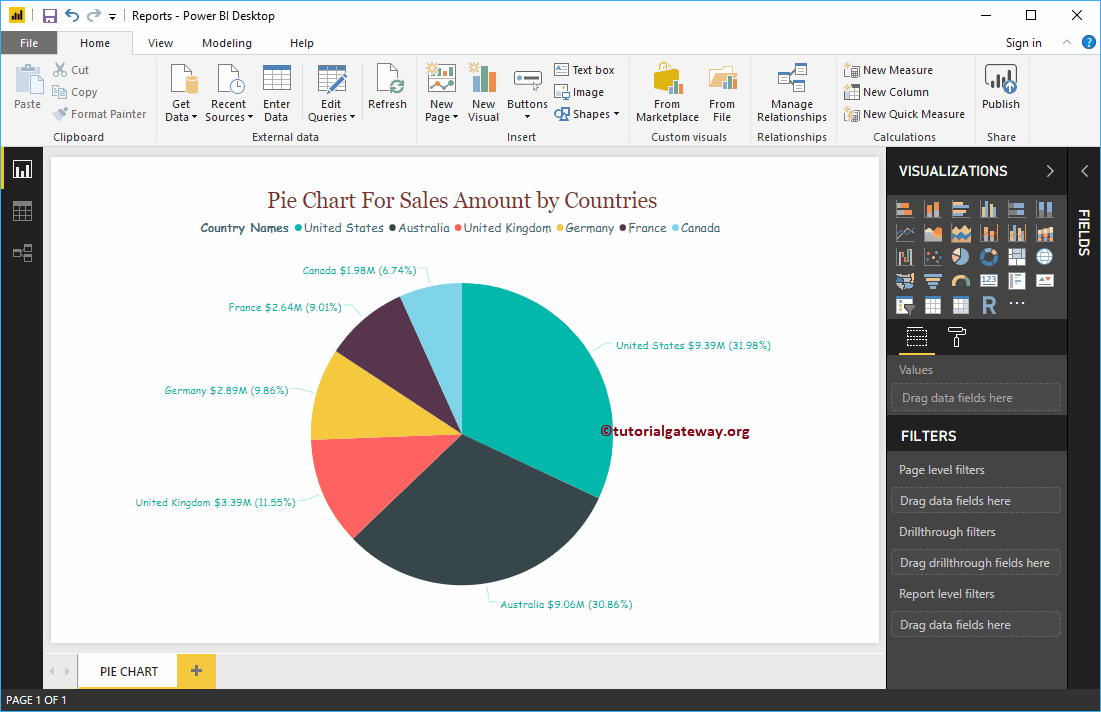
And you can see that the page name has changed
Duplicate a Page in Power BI
Right-click on the existing page that you want to duplicate open the context menu. Please select the Duplicate Page option, as shown below.
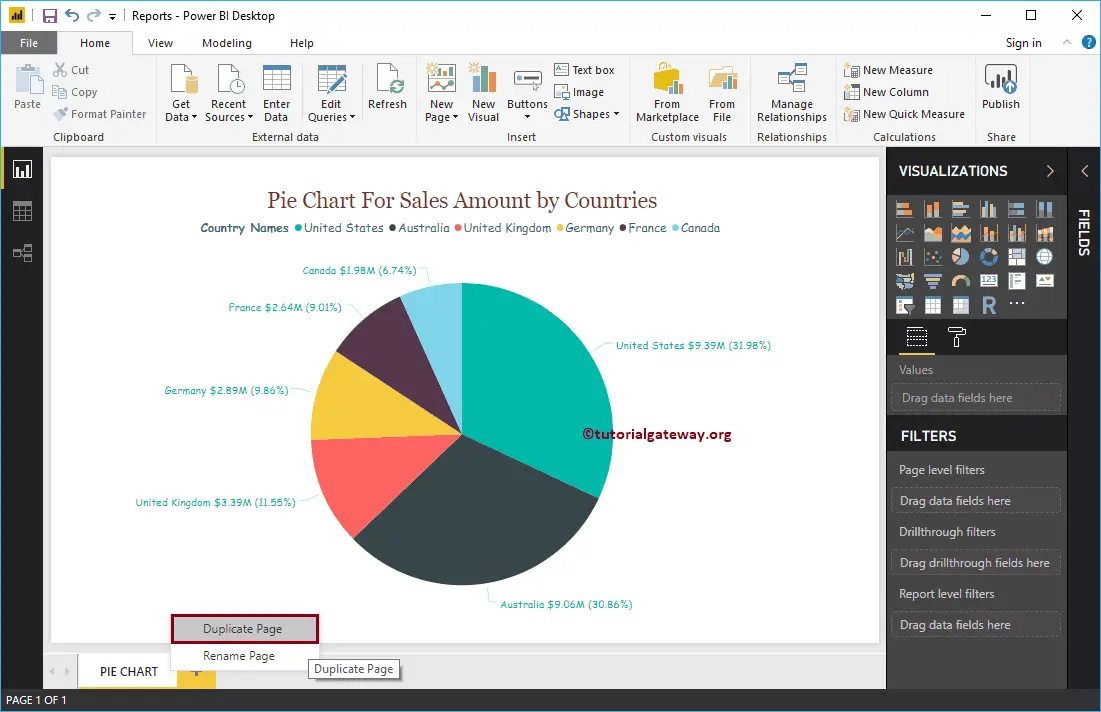
It duplicates the Page for you
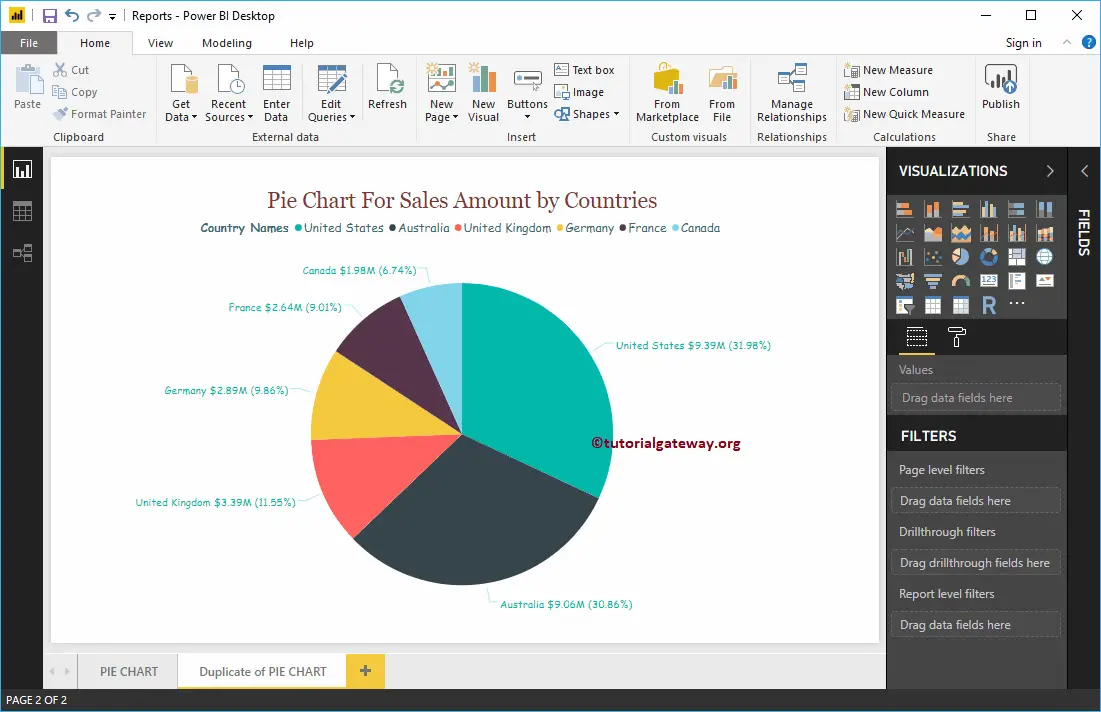
Create a New page in Power BI
Please click on the Plus + button to create a new page in Power BI
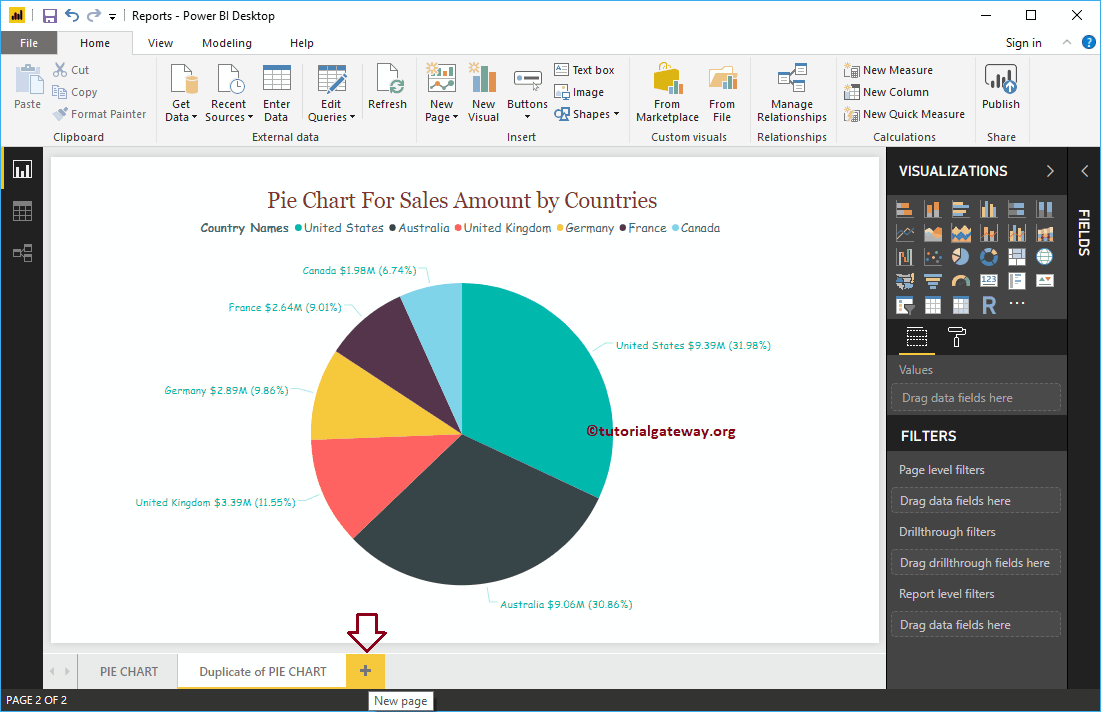
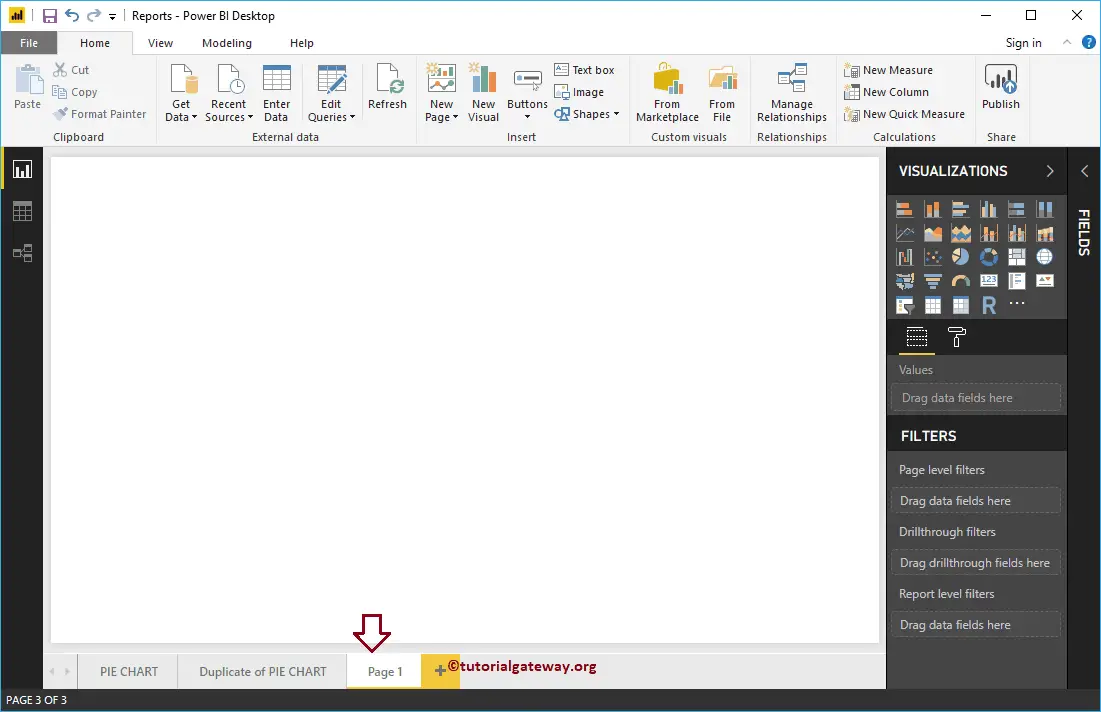
And you can see the New page.
Delete Pages in Power BI
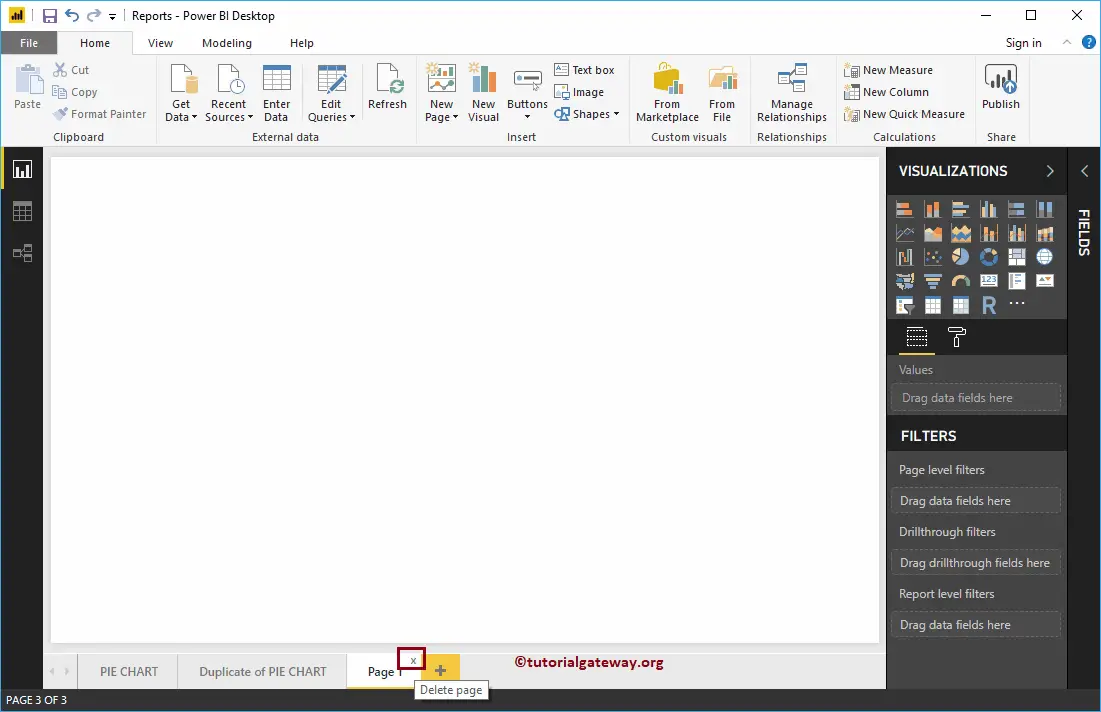
Please click on the X button on top of the existing page
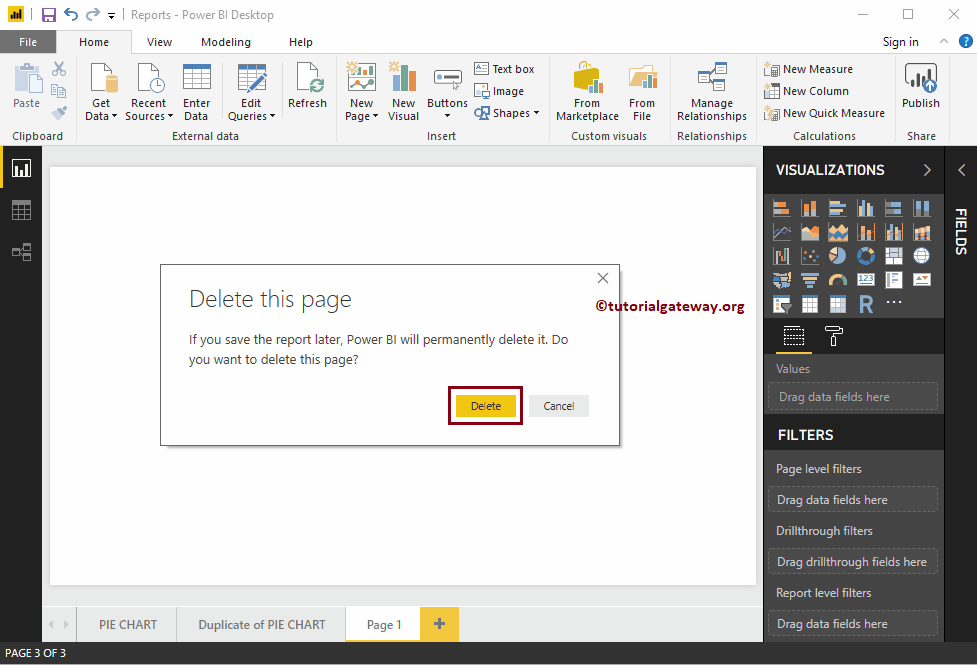
A pop-up message box displayed. Please click on the Delete button to delete the Page.
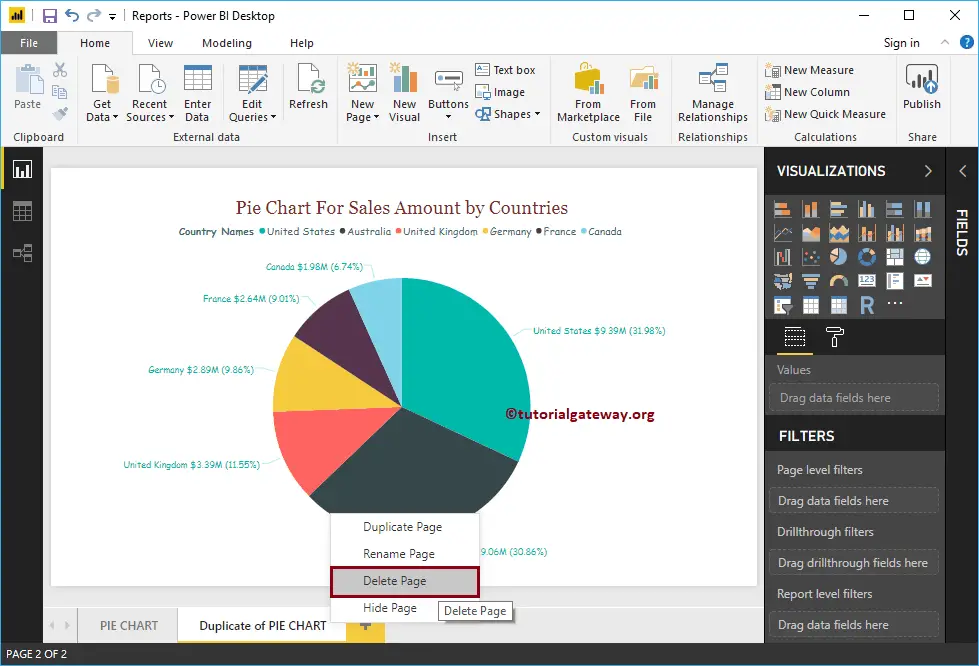
Or, right-click on the existing page that you want to delete open the context menu. Please select the Delete Page option.
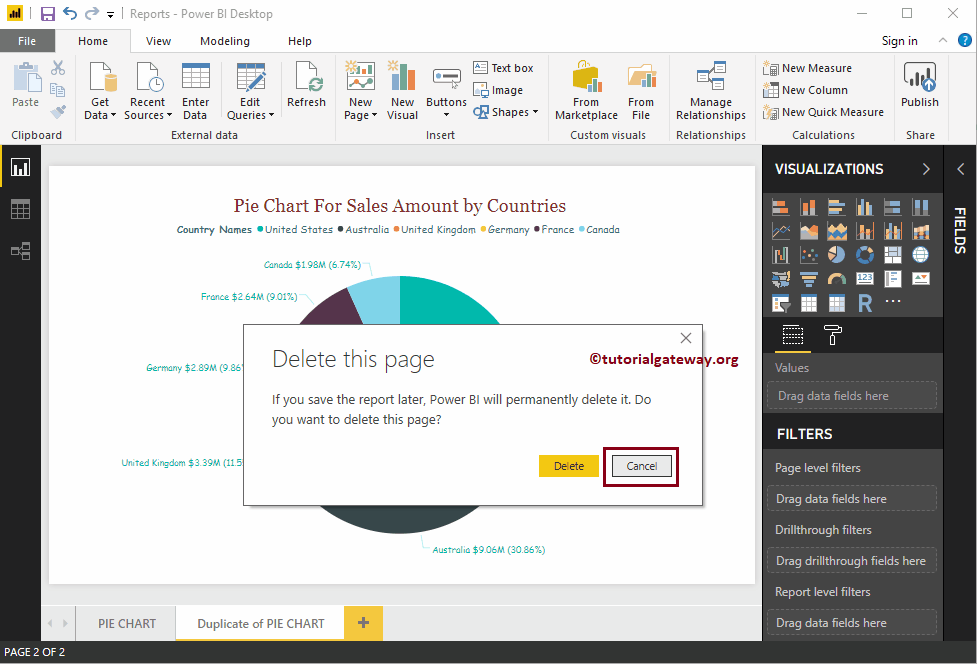
It opens the Message box. This time, I will click the Cancel button.
Hide Pages in Power BI Desktop
Right-click on the page that you want to hide and select the Hide Page option from the context menu.
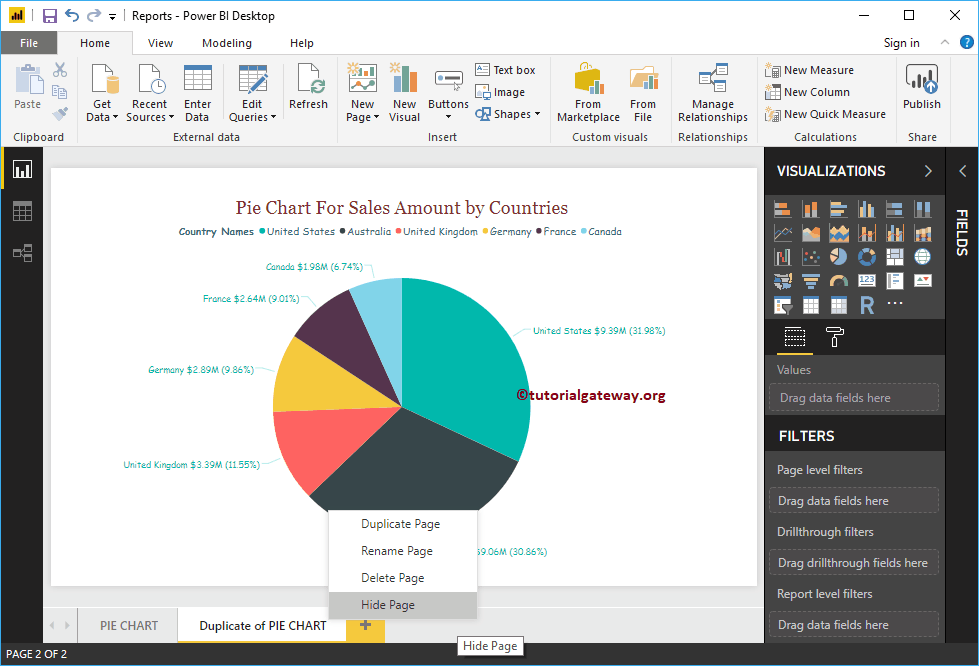
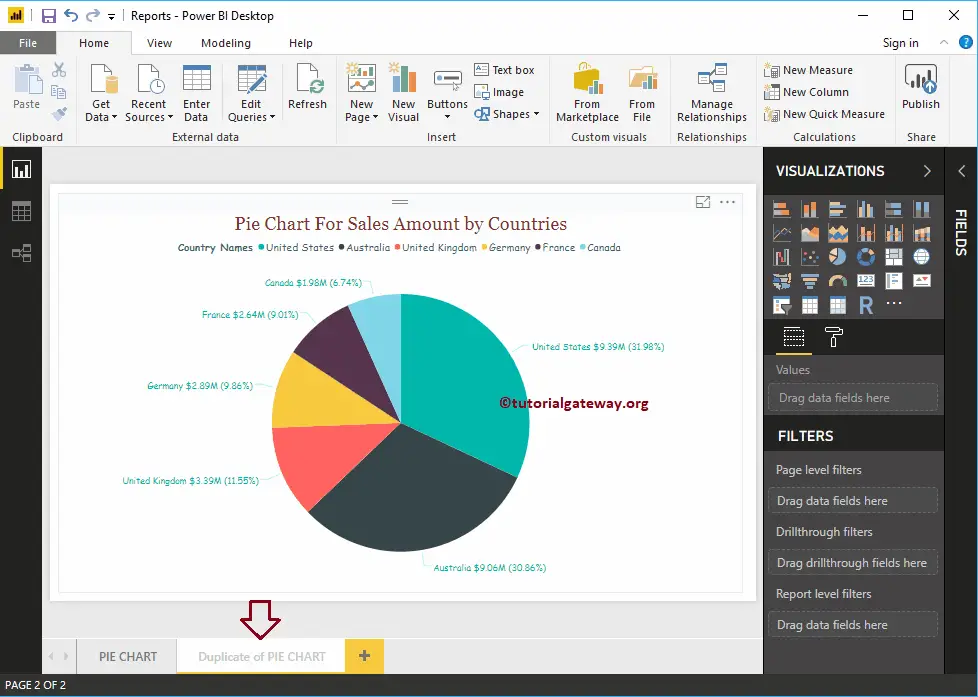
And you can see the page is hidden
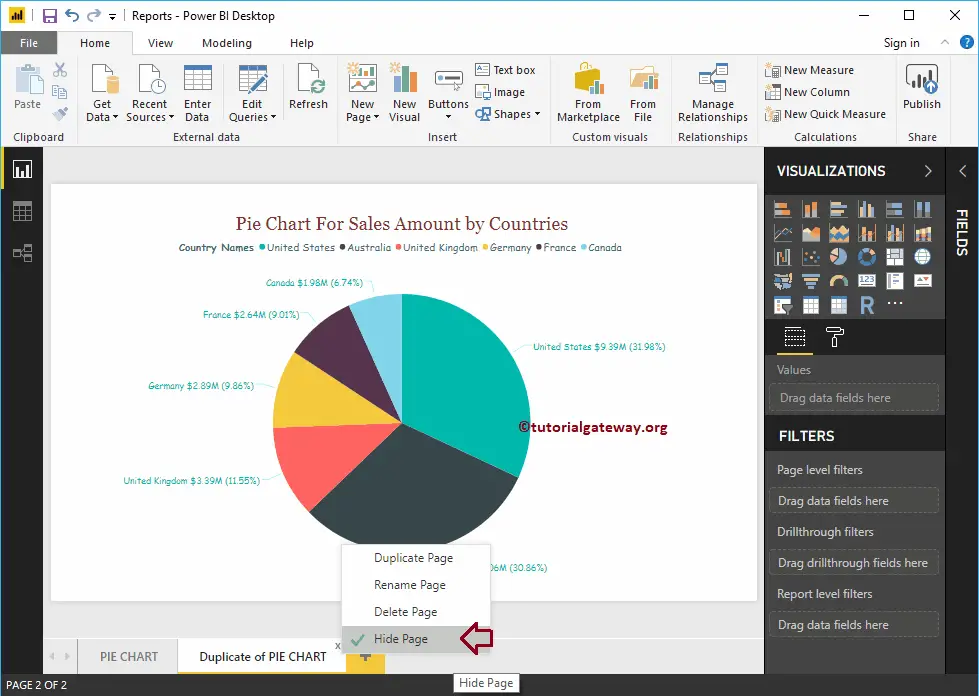
Unchecked the Hide Page option to remove the Hide option
Connect Power BI to SQL Server
Let us see the step by step approach to connect Power BI to SQL Server Database. In addition to this Connect Power BI to SQL Server, how to use SQL Queries against the data present in SQL Tables with an example.
Step by Step approach to Connect Power BI to SQL Server
If you haven’t started the Power BI Desktop yet, Double click on the Power BI desktop to open. Once it is open, it looks like the below screenshot. Please click on the Get Data hyperlink
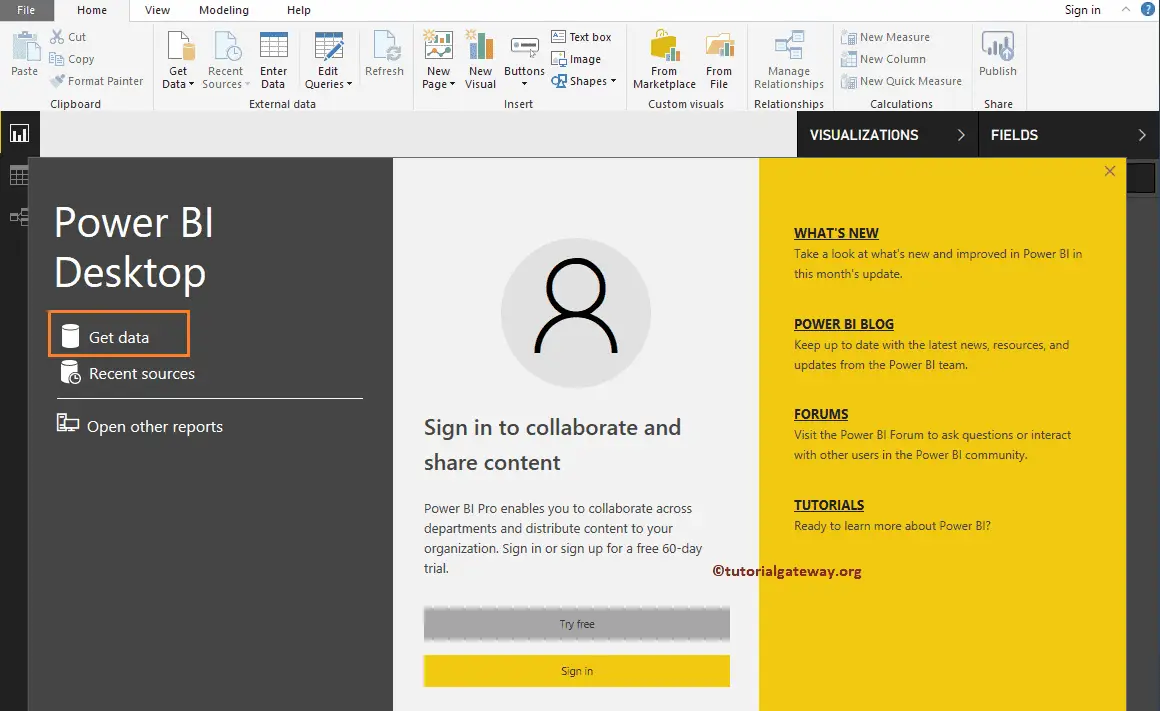
If you are in the Power BI visualization page, under the Home tab, click the Get Data option and select the SQL Server, as we showed below. Or select More options.

We are selecting More options to show you the following window. Use this window to select your desired Data source. Here, we are discussing hot to Connect Power BI to SQL Server. So, let me select the SQL Server Database Option.

Connect Power BI to SQL Server
The following are the list of available fields to fill to connect Power BI to SQL Server Database
- Server: Please provide the SQL Server Instance name. If you installed SQL with default instance, then the instance name is the computer name or localhost.
- Database: This is optional. If you want to use a custom SQL query then it is required.
- Data Connectivity Mode: Please select whether you want to import or Direct query.
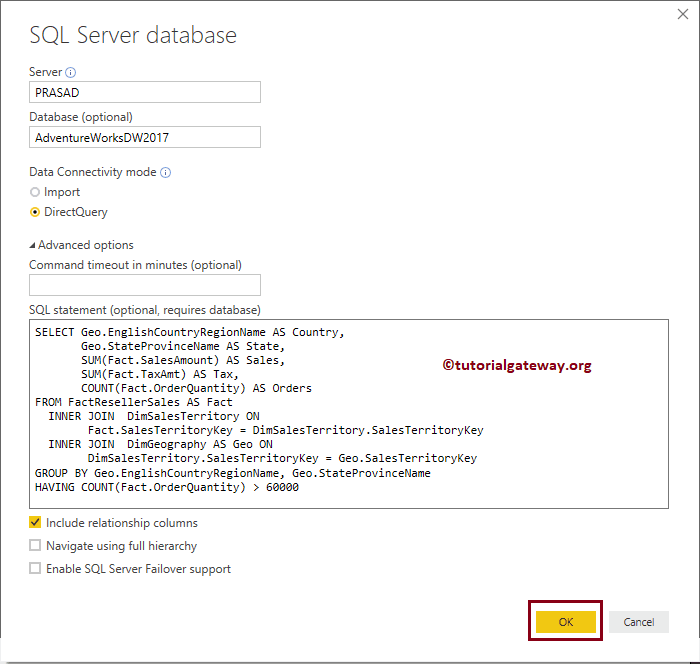
Clicking the Advanced option show you the advanced properties.
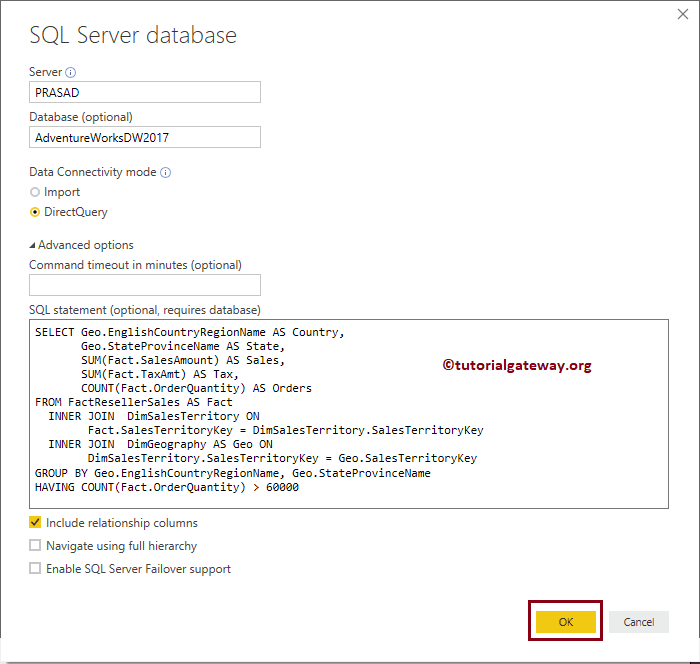
You can write your own SQL query to extract data from the specified Database. To do this, write your query inside the SQL Statement box
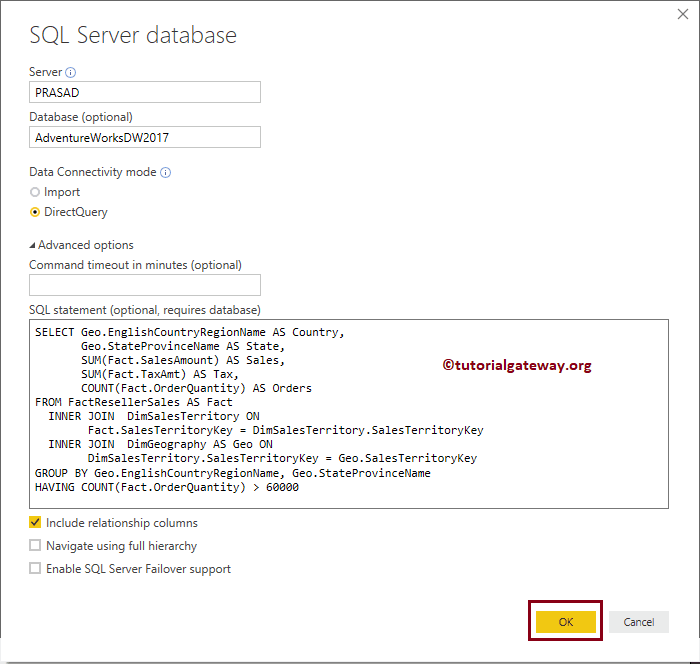
Custom Query that we used in the above Connect Power BI to SQL Server screenshot is:
-- Connecting Power BI to SQL Server
SELECT Geo.EnglishCountryRegionName AS Country,
       Geo.StateProvinceName AS State,
       SUM(Fact.SalesAmount) AS Sales,
       SUM(Fact.TaxAmt) AS Tax,
       COUNT(Fact.OrderQuantity) AS Orders
FROM FactResellerSales AS Fact
  INNER JOIN
     DimSalesTerritory ON
        Fact.SalesTerritoryKey = DimSalesTerritory.SalesTerritoryKey
  INNER JOIN
     DimGeography AS Geo ON
        DimSalesTerritory.SalesTerritoryKey = Geo.SalesTerritoryKey
GROUP BY Geo.EnglishCountryRegionName, Geo.StateProvinceName
HAVING COUNT(Fact.OrderQuantity) > 60000
If you want to use this data, then click Load. For now, let me click the cancel button because I want to select multiple tables.
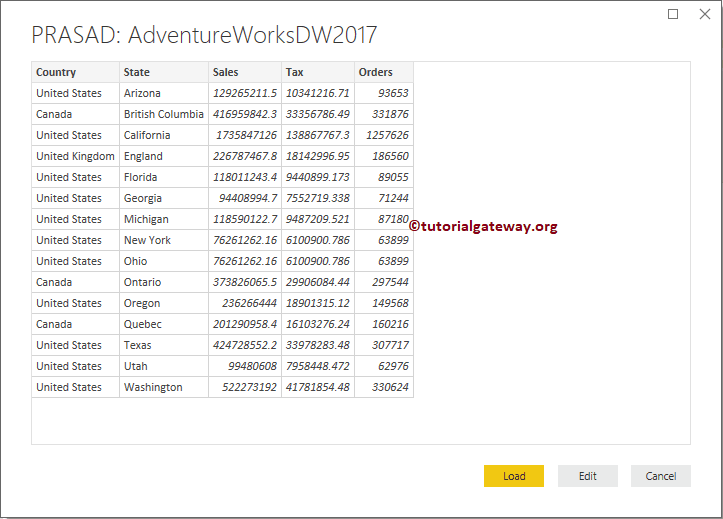
NOTE: Don’t worry above the Query, Just understand the procedure. However, If you want to learn, please refer to our SQL Server Tutorial
Let me use the local instance, and click OK

For now, we are using the current local windows credentials. If you don’t have the permission to access SQL Server, then use other person windows credential by selecting Use alternative credentials.
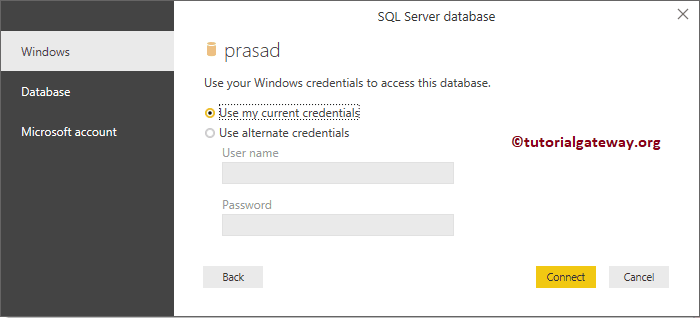
In real-time, we only use SQL Server Database credentials. For this, select the database and enter the username and password provided by the Admin person.
For now, I am using the current windows credentials

Under the Display options, it lists out the Databases that are available for that Instance. In this example, We are selecting the AdventureWorksDW2017 database.
You can download this database from Microsoft official Download Center or GitHub for free.

Expanding the Database folder display the available Tables and Views. Selecting the table shows the Data Preview.
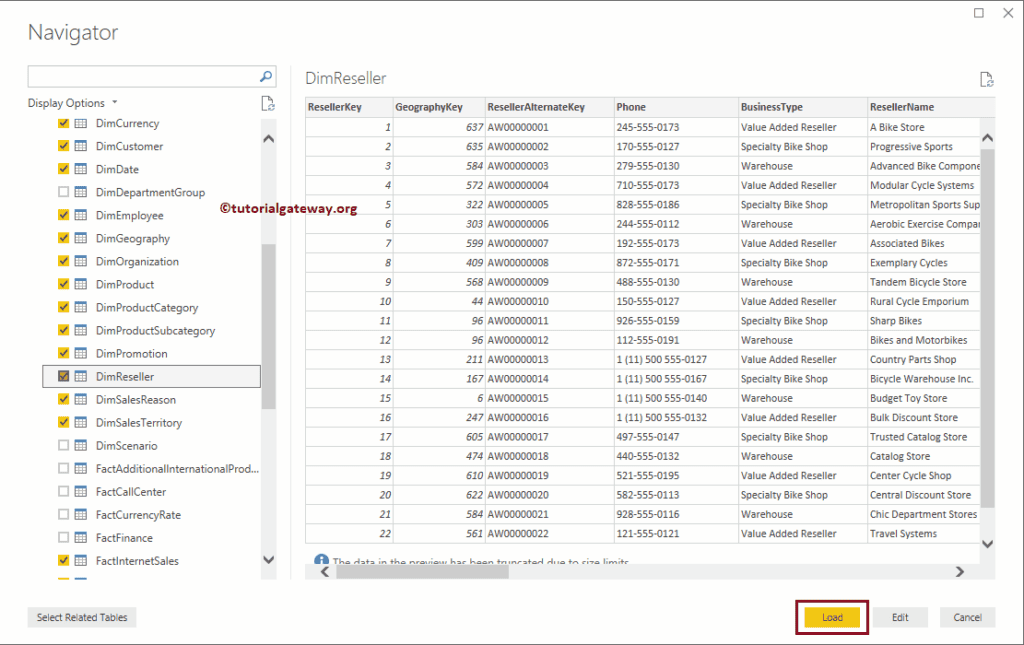
From the below screenshot, you can see that we are selecting the required tables. Remember, if you are confused to select tables, then select one Measure table (Orders, or Sales) and click Select Related Tables button.
- Load: This will load data from selected tables to Power BI. As I know that the data is clean, let me click the Load button
- Edit: Click this button to alter the columns, or to cleanse the data
Please wait until the load is complete
Now you can see the Tables that we selected from the SQL Server database under the Fields section.
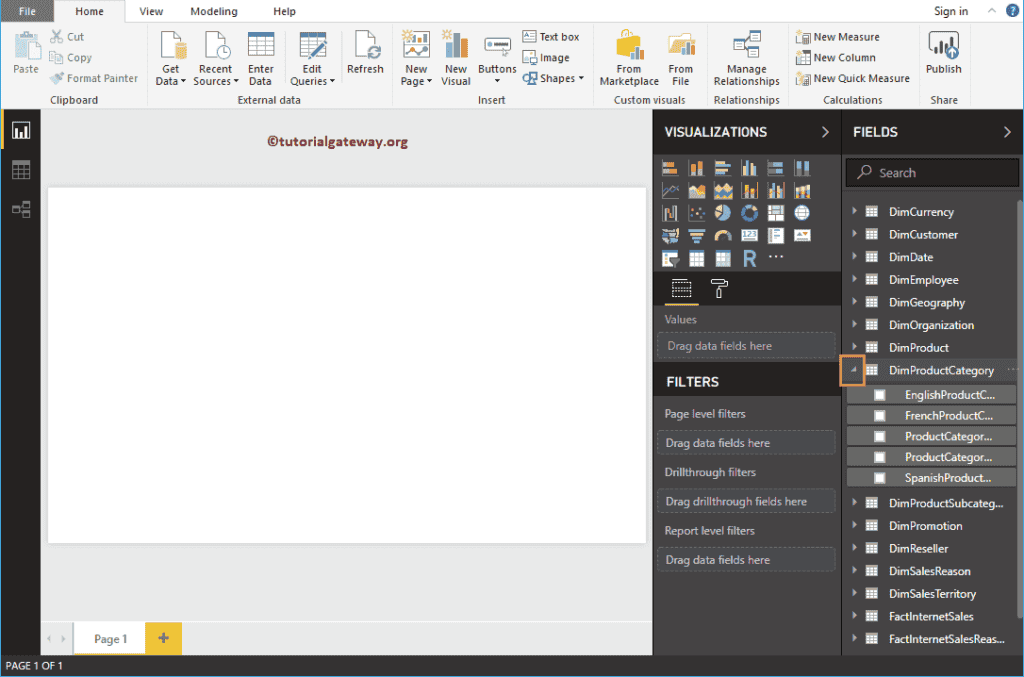
Expand any table to see the columns (fields) inside that table.
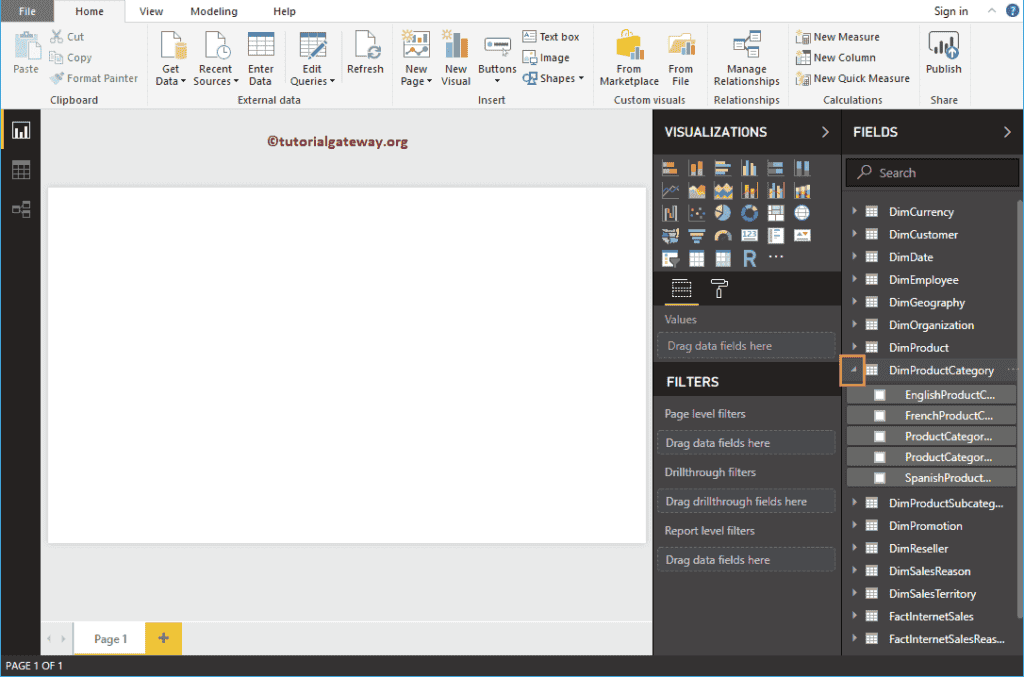
TIP: This is the Dataset that we are going to use in most of the Power BI tutorial.
Connect Power BI to Multiple Excel Sheets
In this article, we show you how to connect Power BI to Multiple Excel Sheets, and how to use data present in those Excel sheets.
To demonstrate the Connect Power BI to Multiple Excel Sheets, we will load data from multiple tables or sheets in an excel file to Power BI, and generate a bar chart.
How to Connect Power BI to Multiple Excel Sheets
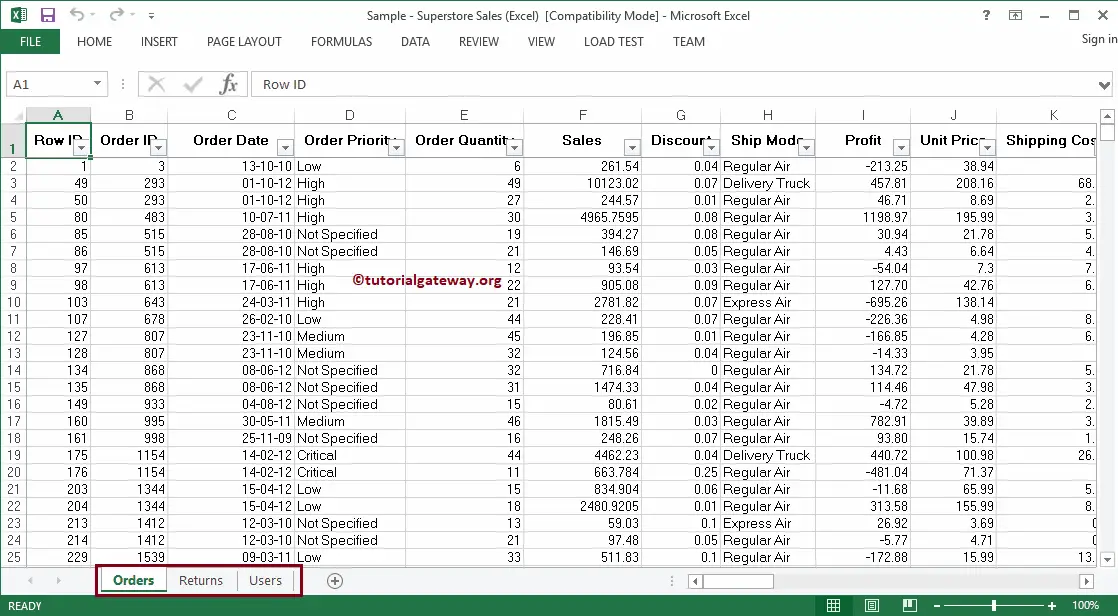
Before we start Connect Power BI to Multiple Excel Sheets, Let us see the data present in the Sample superstore Excel File. From the below screenshot, you can see, it has three sheets Orders, Returns, and Users
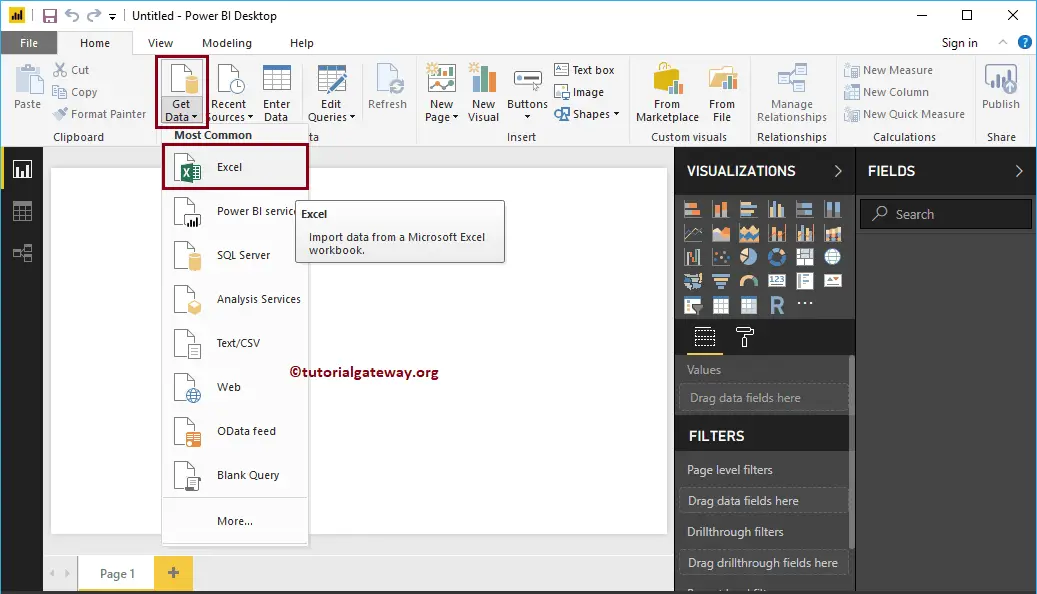
If you are in the Power BI visualization page. Under the Home tab, click the Get Data option and select the Excel, as we have shown below. Or, select More options and select Excel.
Once you click on the Excel tab, a new window will open to select the Excel File from our file system. For now, we are selecting the Sample – Superstore file, as shown below.
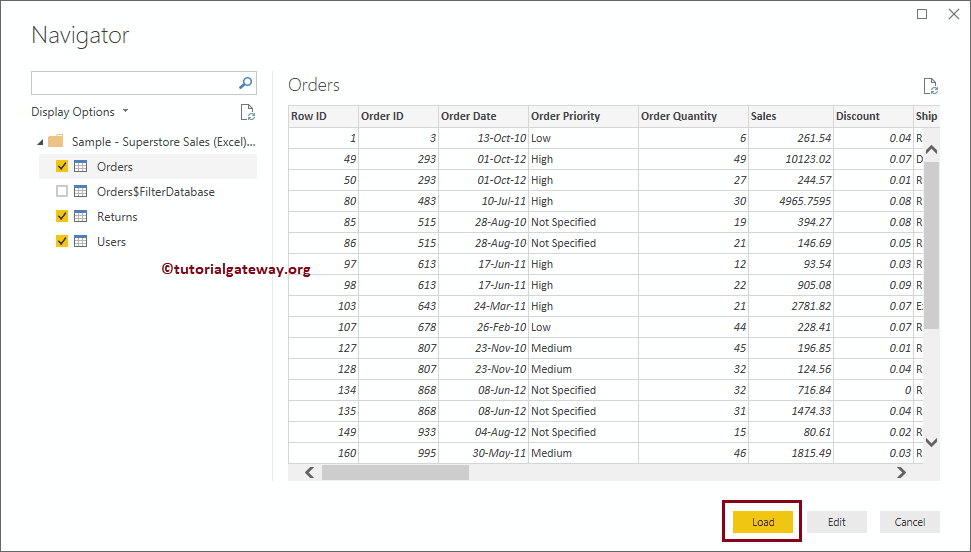
Expanding the Superstore Excel folder will display the list of available sheets.
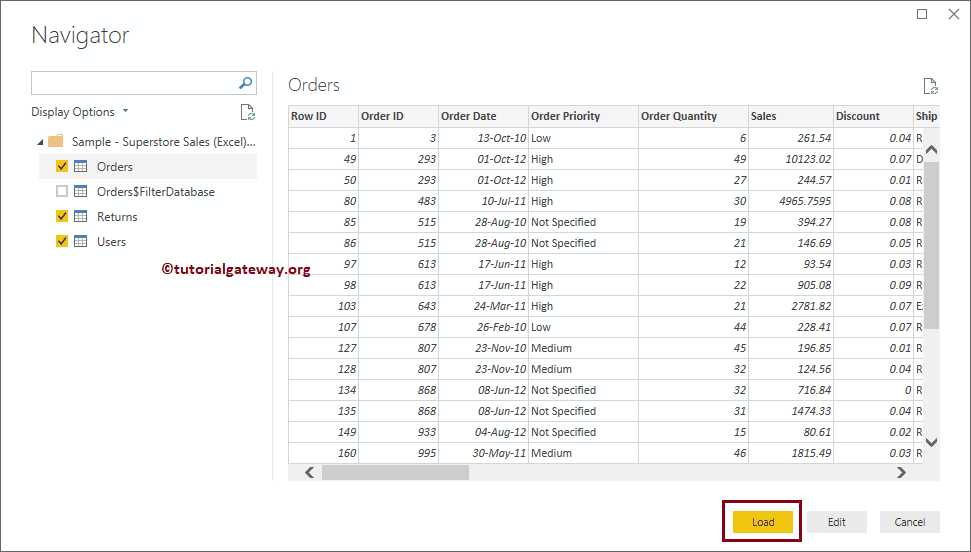
Selecting the sheet or table shows the Data Preview. From the screenshot below, you can see the preview of the sheet. If you are satisfied with the Data and the data types, then click the Load button; otherwise, click the Edit button to make changes.
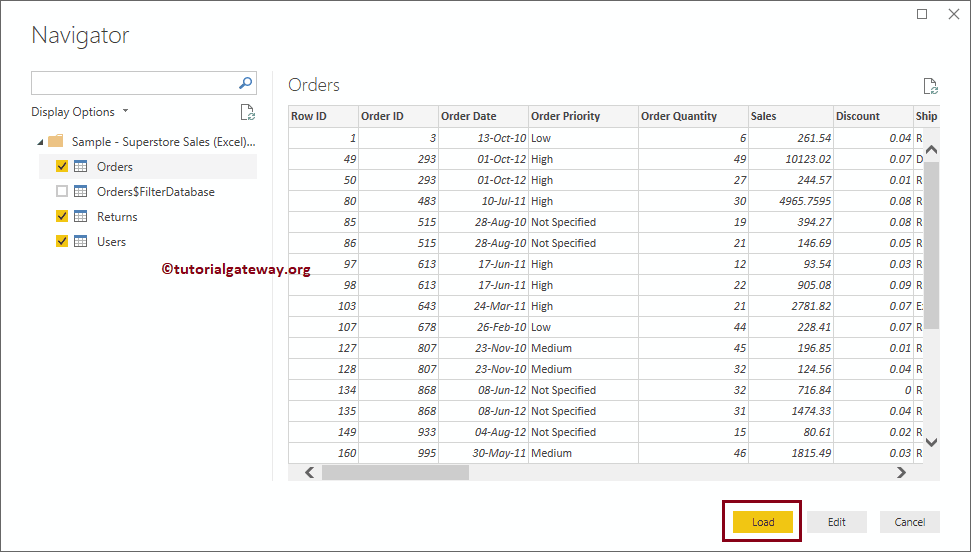
Currently, we don’t want to make any changes to the data. So, let me click on the Load button
Please wait until the load is complete
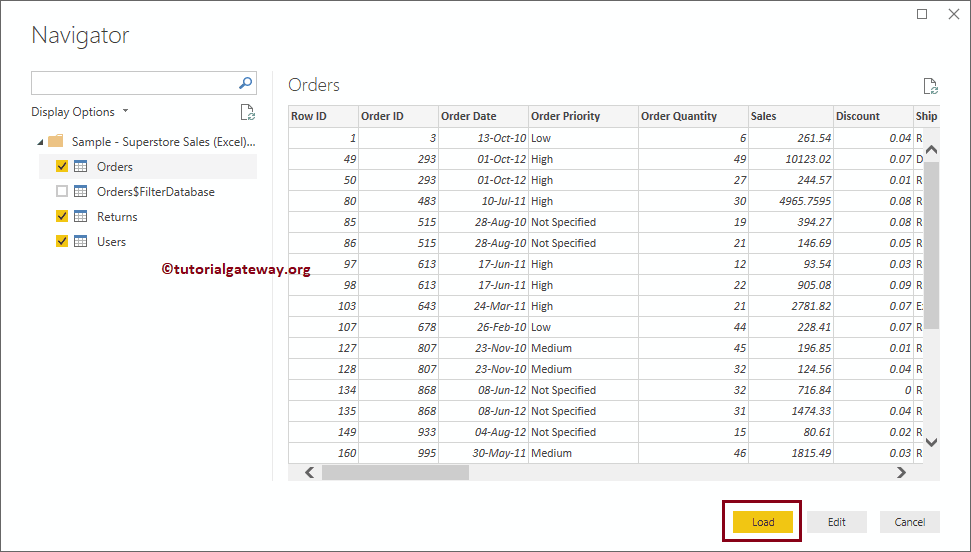
Now you can see all the Columns imported from the excel file under the Fields section. As you can see, there is an issue with the Users table because Power BI hasn’t picked up the column names from the first row.
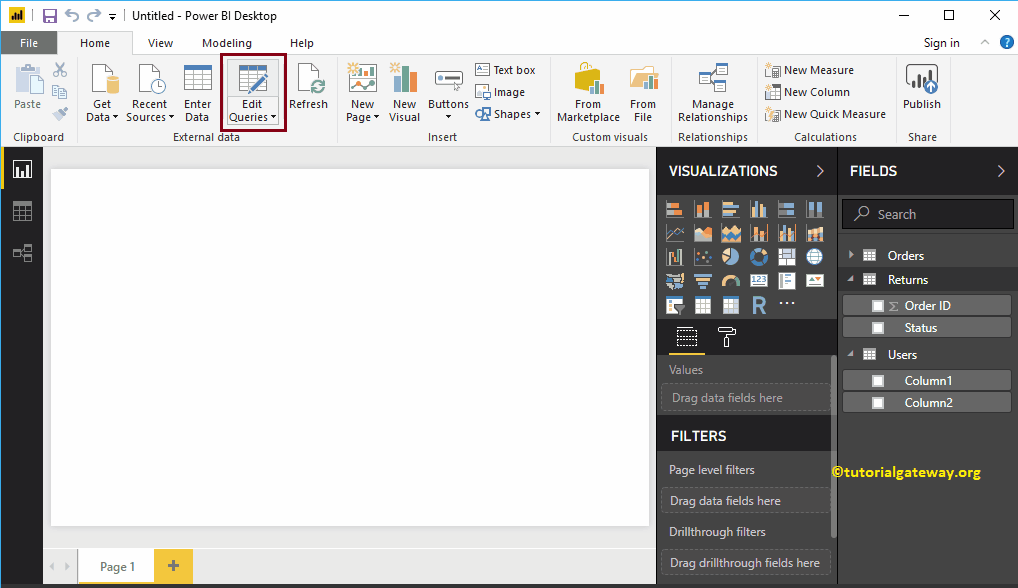
Please click on the Edit Queries tab
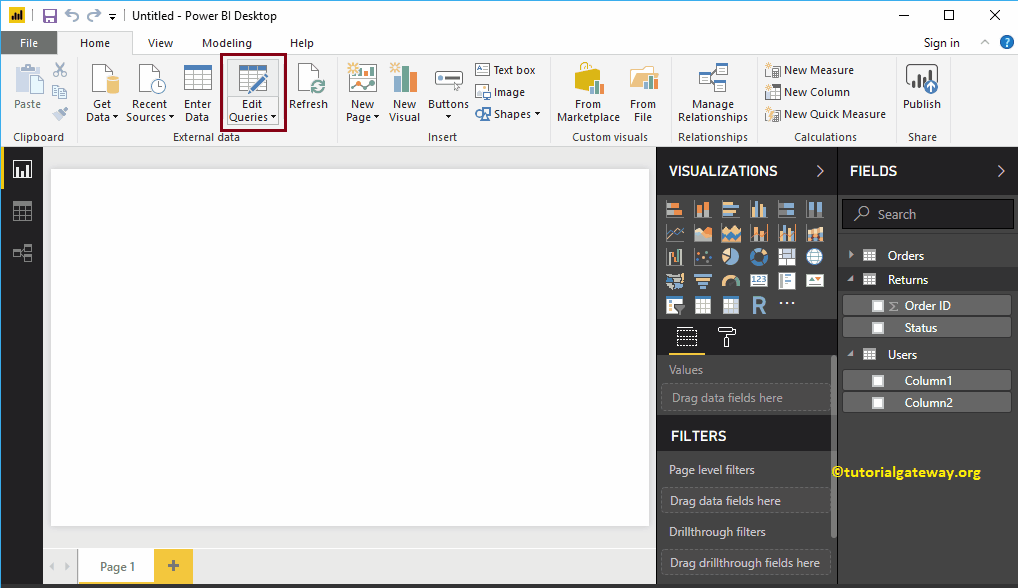
Click on the Use First Row as Headers
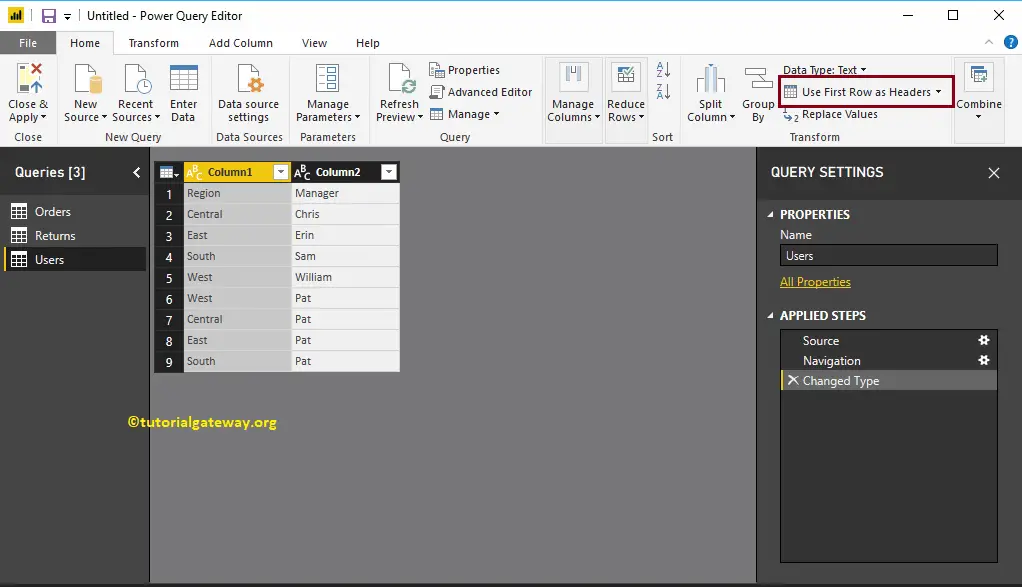
That’s it. We Connected Power BI to Multiple Excel Sheets and loaded data from multiple sheets.
Let me create a Column chart using this data. I suggest you refer, Column Chart in Power BI article to understand the steps involved in creating it.
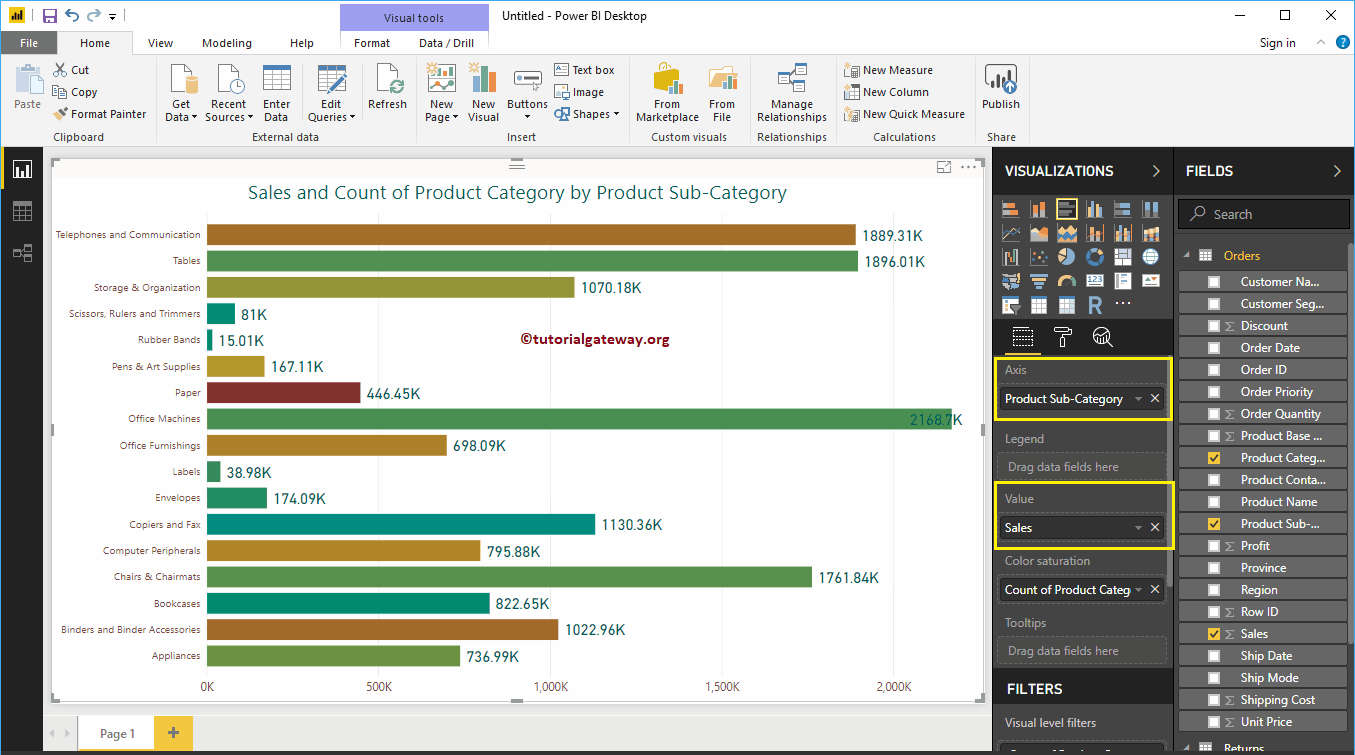
Get Data from Excel to Power BI
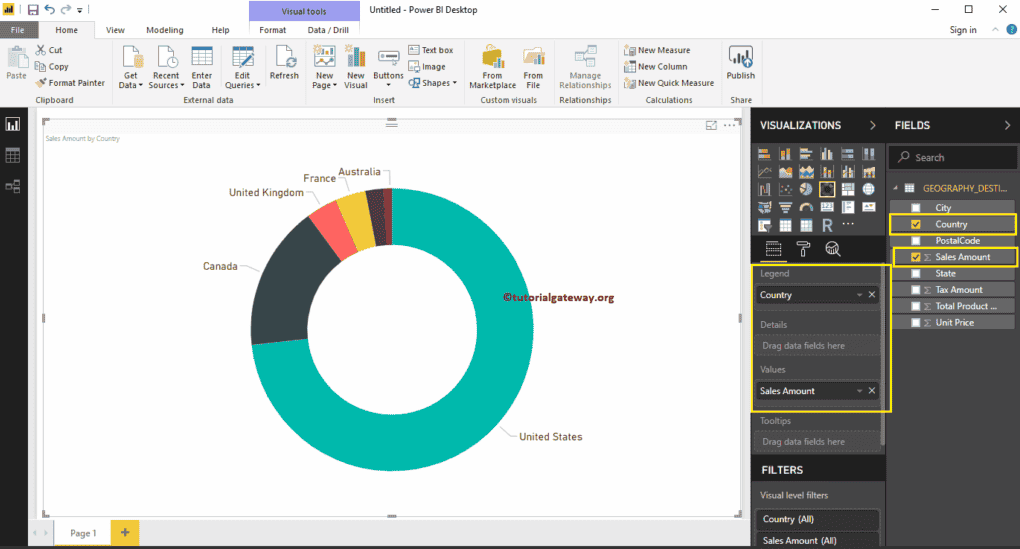
In this section, we show you how to connect Power BI to Excel Files, and how to get data from Excel to Power BI. To demonstrate the Get Data from Excel to Power BI, we will load data from excel file to Power BI, and generate a Donut chart.
How to Get Data from Excel to Power BI
Before we get started, let us see the data present in the Sales By Country Excel File. From the screenshot below, you can see that the First row has the Column names.
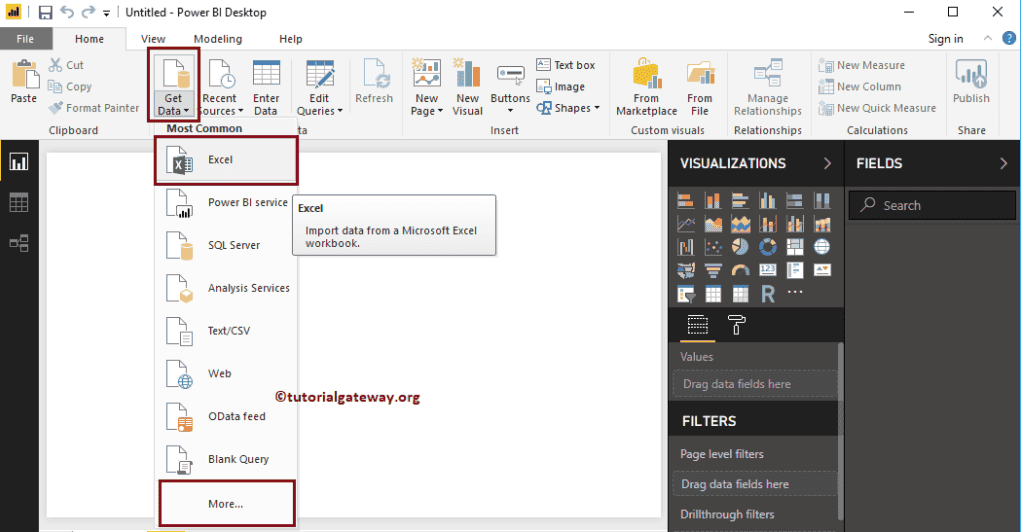
If you haven’t started the Power BI Desktop yet, Double click on the Power BI desktop to open. Once it is open, it looks like the screenshot below. Please click on the Get Data hyperlink.

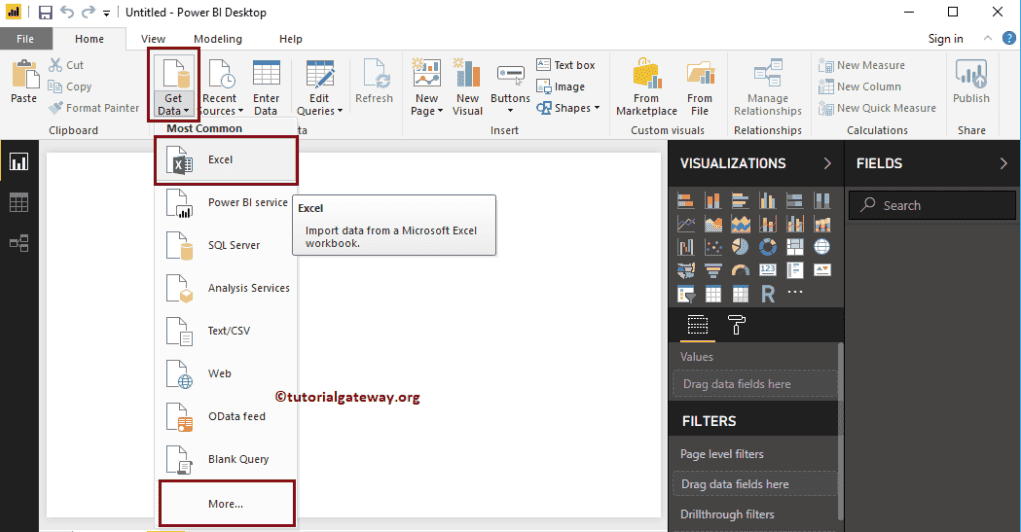
If you are in the Power BI visualization page, under the Home tab, click the Get Data option and select the Excel as we shown below. Or select More options.
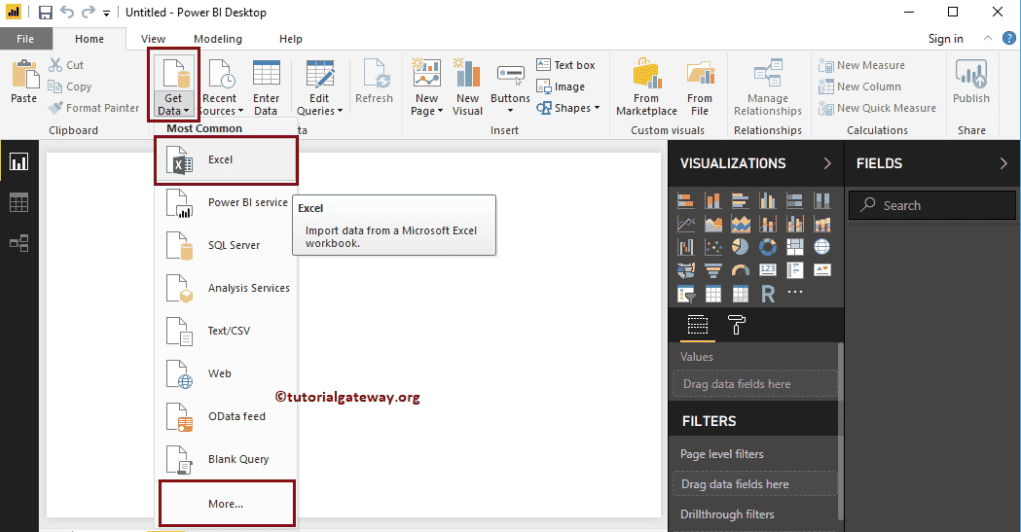
Get Data from Excel to Power BI
When you select the More option, the following window will show. You can use this window to select your desired Data source. For now, let me select the File -> Excel Option and click Connect button
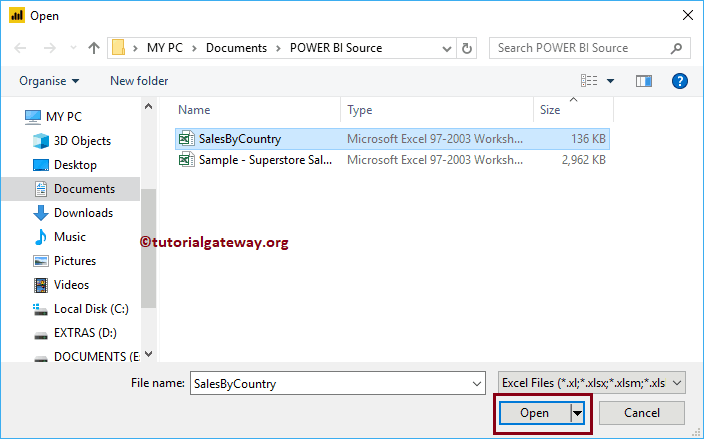
Once you click on the Connect button, a new window opens to select the Excel File from our file system. For now, we are selecting the SalesByCountry.xls file, as shown below.
Expanding the Excel folder display the list of available sheets. If you select the sheet or table, it shows the Data Preview. From the screenshot below, you can see the preview of the sheet.
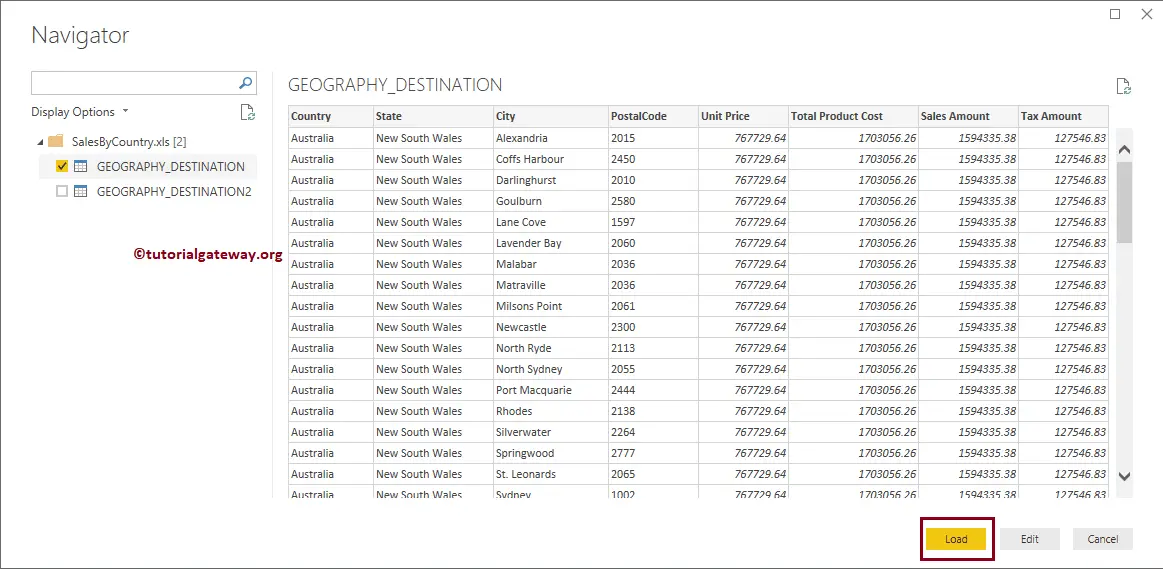
If you are satisfied with the Data and the data types, then click the Load button. Otherwise, click the Edit button to make changes.
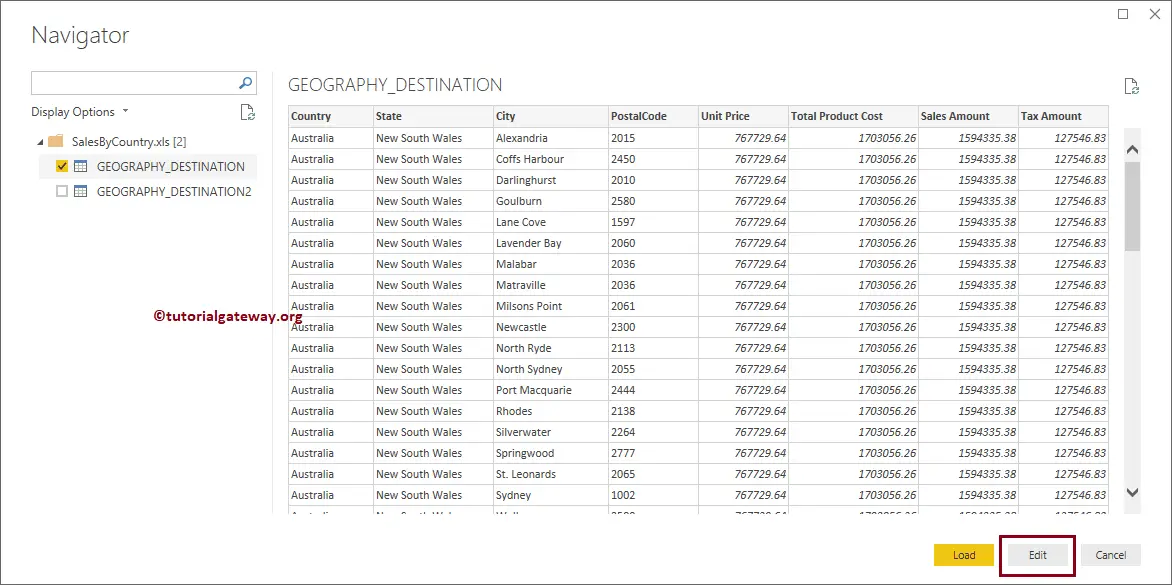
Currently, we don’t want to make any changes to the data. So, let me click on the Load button
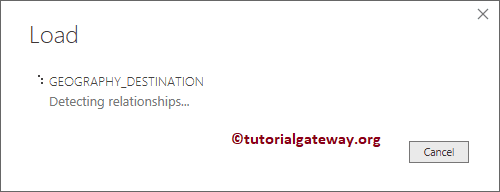
Please wait until the load is complete
Now you can see all the Columns that imported from the excel file under the Fields section.
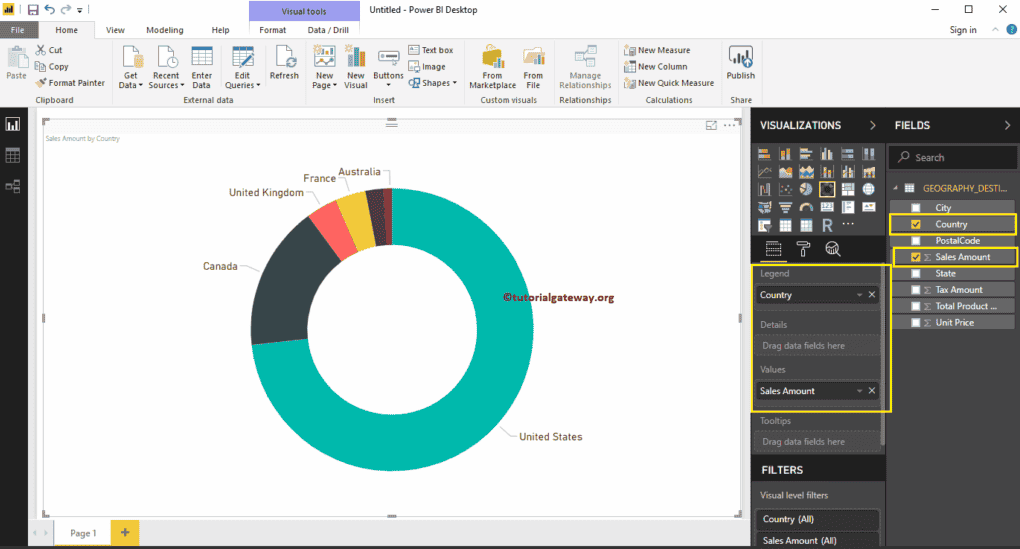
Let me create a Donut chart using this data. I suggest you refer, Power BI Donut Chart article to understand the steps involved in creating it.
Get Data from Text File to Power BI
In this study, we show you how to connect Power BI to Text Files, and how to get data from text file to Power BI. To demonstrate the Get Data from Text File to Power BI, we will load data from a text file to Power BI, and generate a column chart.
How to Get Data from Text File to Power BI
Before we start getting Data from Text File to Power BI, Let us see the data present in the Employee Text File. From the below screenshot, you can see that it is just a normal text file. If you observe closely, the First row has the Column names
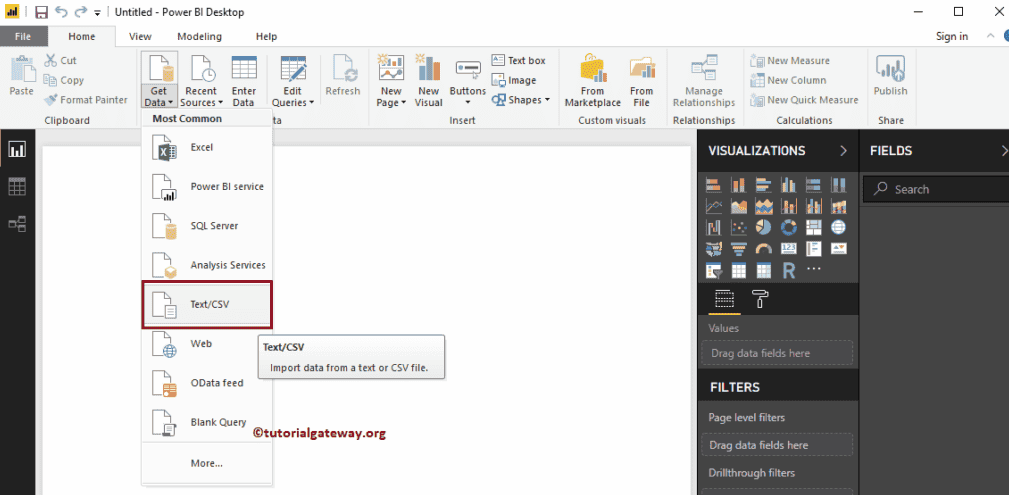
If you haven’t started the Power BI Desktop yet, Double click on the Power BI desktop to open. Once it is open, it looks like the screenshot below. Please click on the Get Data hyperlink

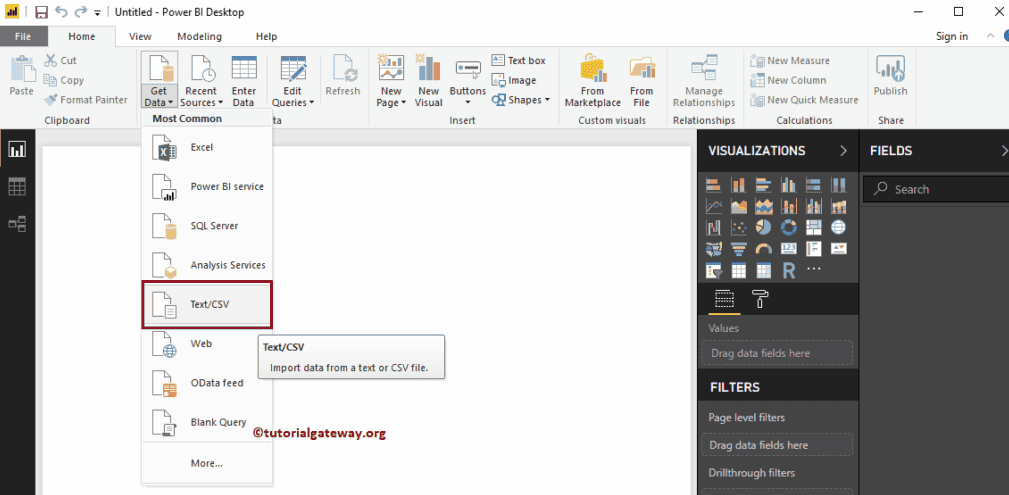
If you are in the Power BI visualization page, under the Home tab, click the Get Data option and select the Text/CSV, as we shown below. Or select More options.
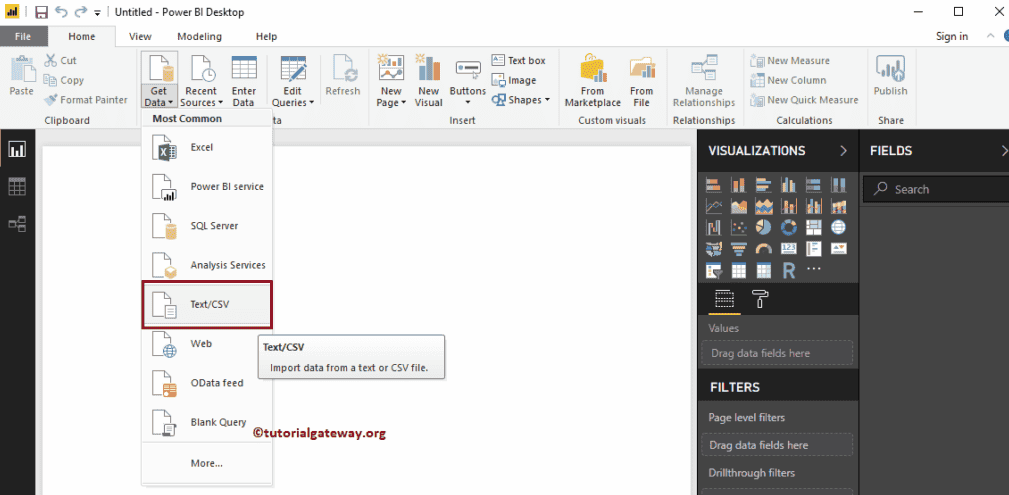
Get Data from Text File to Power BI
When you select the More option, the following window will show. You can use this window to select your desired Data source. For now, let me select the Text/CSV Option and click Connect button
Once you click on the Connect button, a new window opened to select the Text File from our file system. For now, we are selecting the Employee.txt file, as shown below.
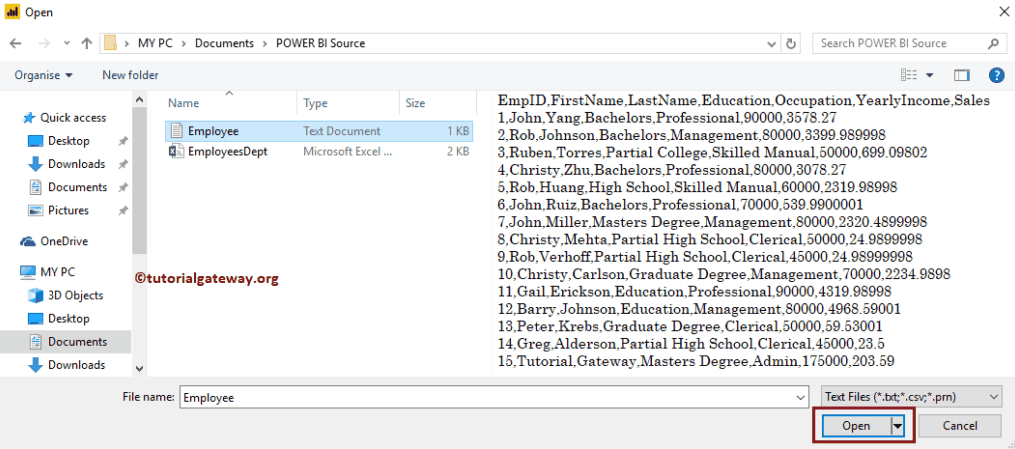
Please wait until the connection established
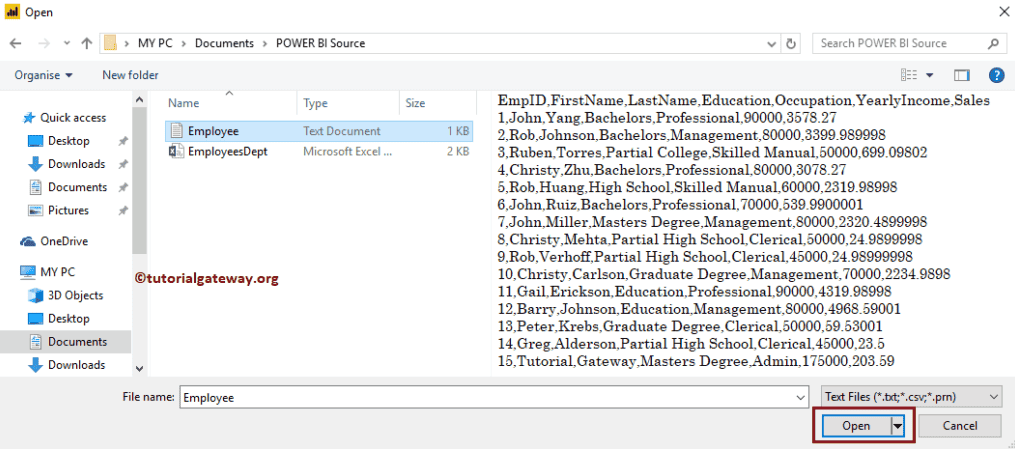
Now you can see the preview of the data present in the text file.
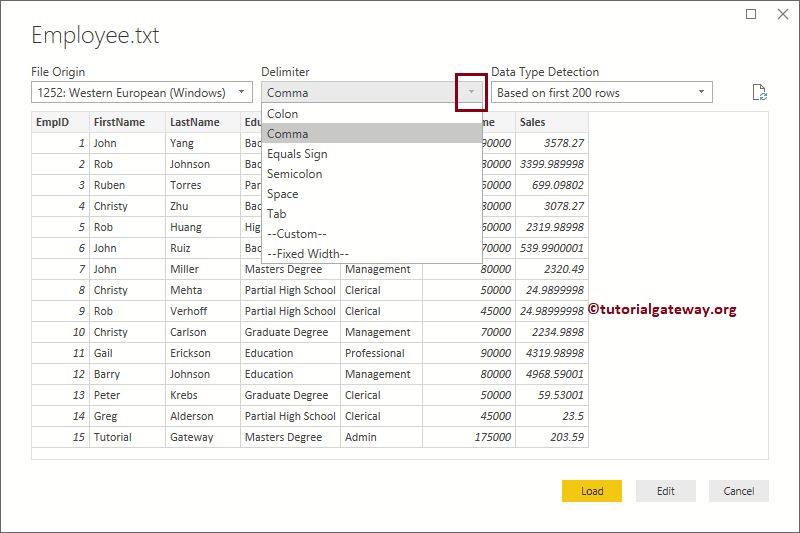
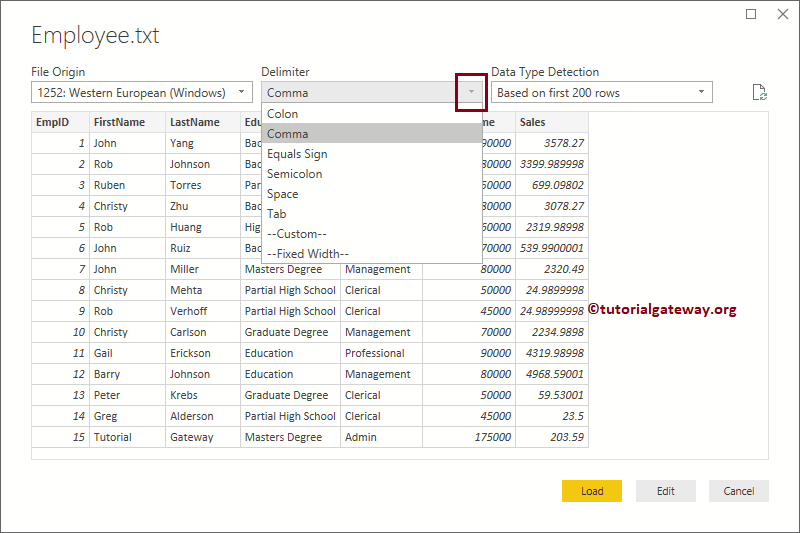
Most of the time, Power BI automatically picks the delimiter and separate the columns. If this is not the case, then use the Delimiter option to change as per your requirement.
If you are satisfied with the Data and the data types, then click the Load button; otherwise, click the Edit button to make changes.
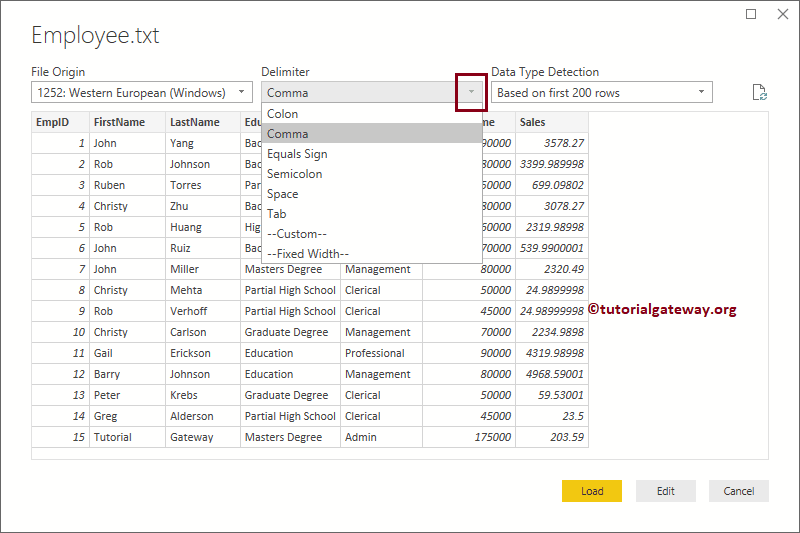
When you click the Edit button, the following window opened. Use this window to change the data as per your requirement.
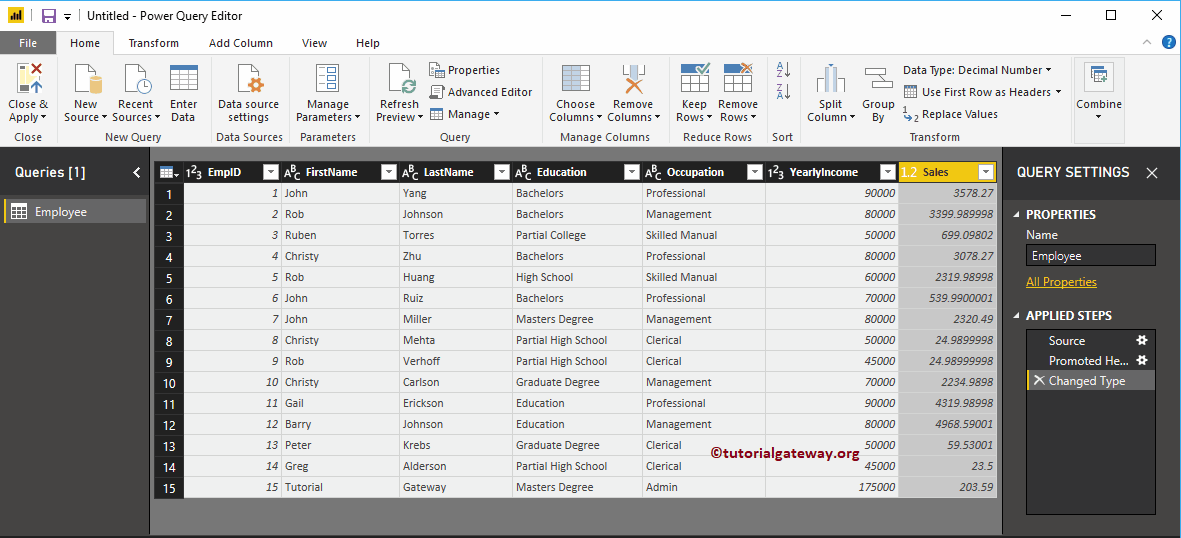
Currently, we don’t want to make any changes to the data. So, let me click on the Load button
Now you can see all the Columns imported from the text file under the Fields section.
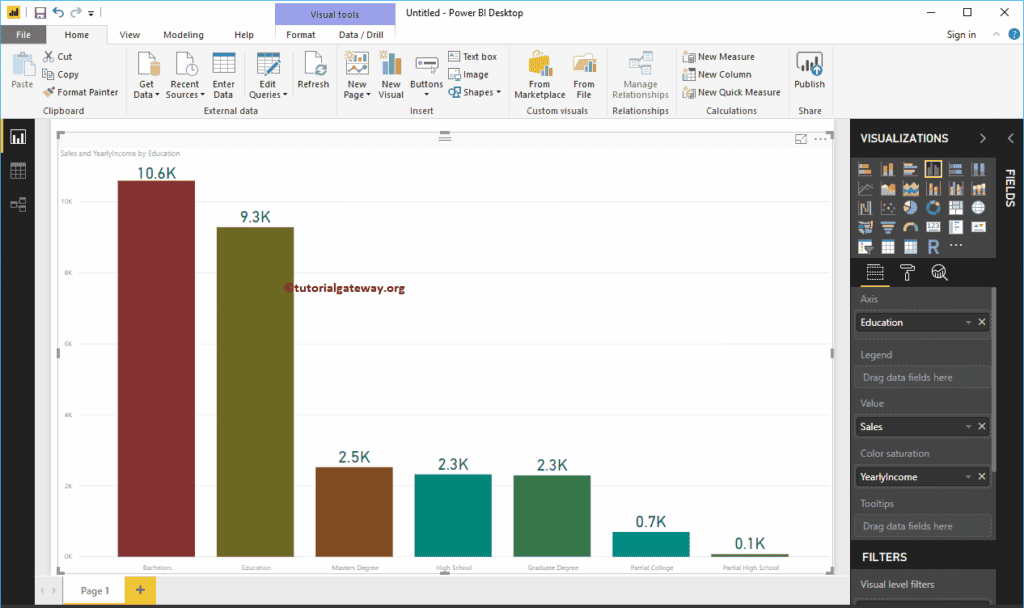
Let me create a Column chart using this data. I suggest you refer, Column Chart in Power BI article to understand the steps involved in creating it.
Load Data from Multiple Data Sources in Power BI
Load Data from Multiple Data Sources in Power BI : In real-time, you might face a situation where data is present in different databases. However, you do not have to worry in these situations because Power BI support multiple data source in one chart. Let me show you the step by step approach to get or load data from multiple data sources in Power BI.
How to load data from Multiple Data Sources in Power BI
From the screenshot below, you can see that there are already a few tables inside the Power Bi desktop. We imported these tables in Connect to SQL article.

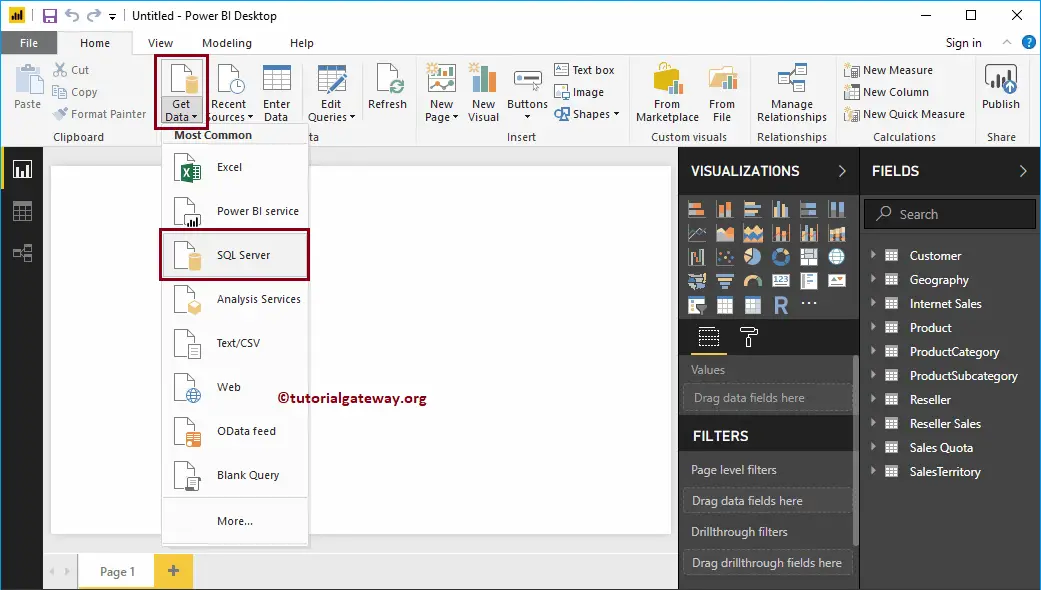
If you are in the Power BI visualization page, under the Home tab, click the Get Data option and select the SQL Server, as we showed below. Or, select More and select the SQL Server option.
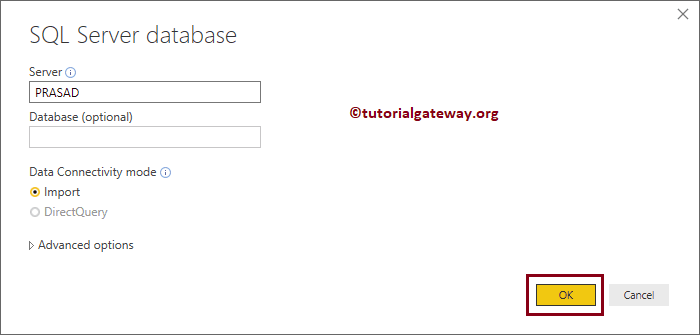
Here you have to provide the SQL Server Instance name. If you installed SQL with default instance, then the instance name is the computer name or localhost or .
Let me use the local instance, and click OK
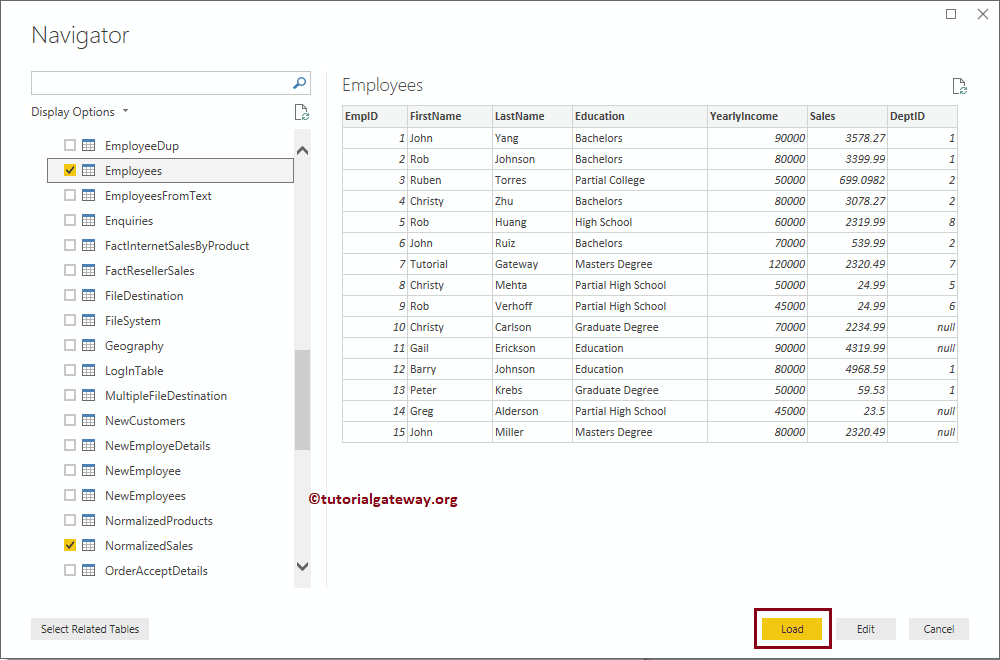
Under the Display options, it lists out the Databases that are available for that Instance. In this example, we are selecting three tables present in the Employees database.
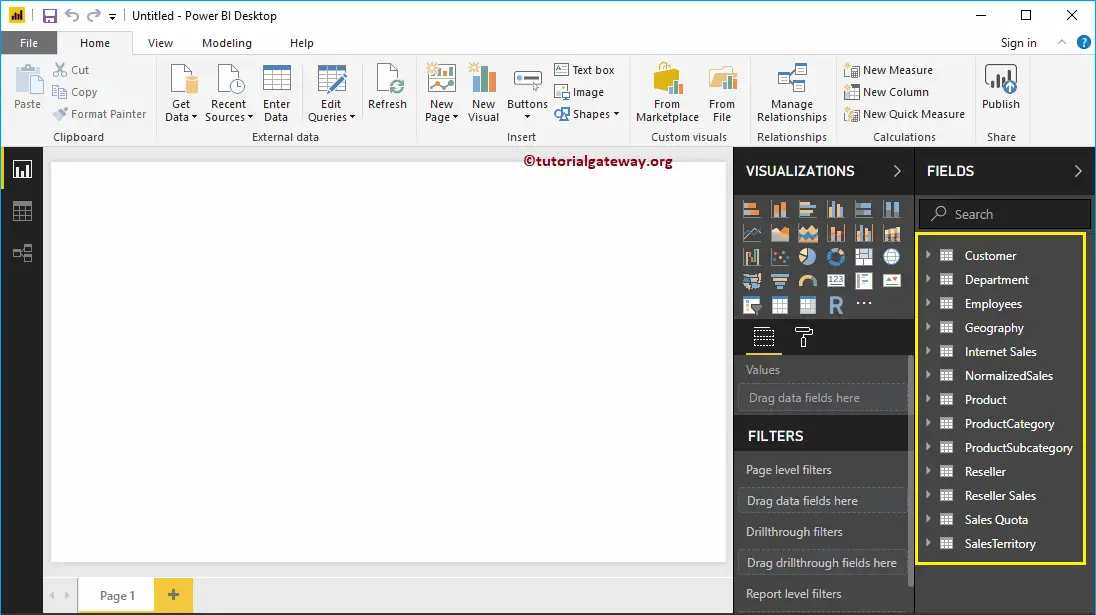
Now you can see the Tables that we selected.
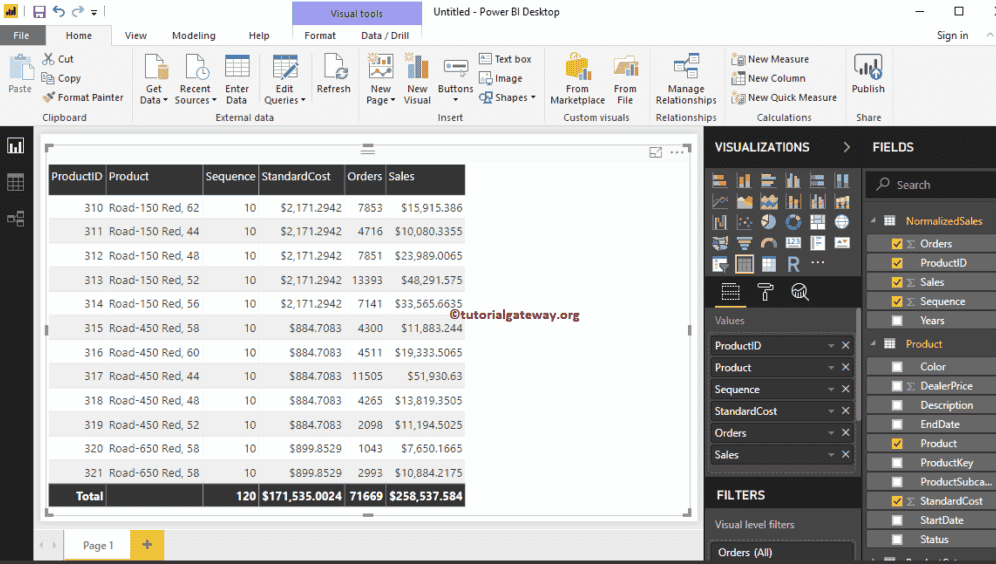
Let me create a table with Employee Database fields, and Adventure Works DW database fields.
As you can see from the below screenshot, we also formatted the Table as well.
NOTE: I suggest you refer to Create a Table, and Format a Table articles to understand the table creation and formatting options.
Remove Columns from Tables in Power BI
What are the steps required to Remove Columns from Tables in Power BI with an example? In general, the data that we load from the source might have some columns that may not require for the analysis purpose.
How to Remove Columns from Tables in Power BI
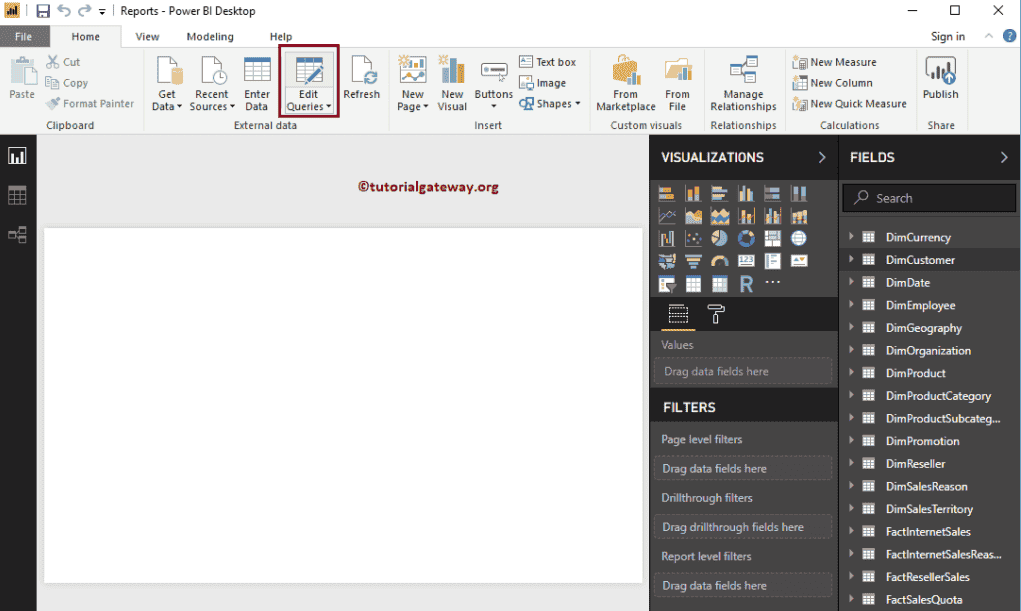
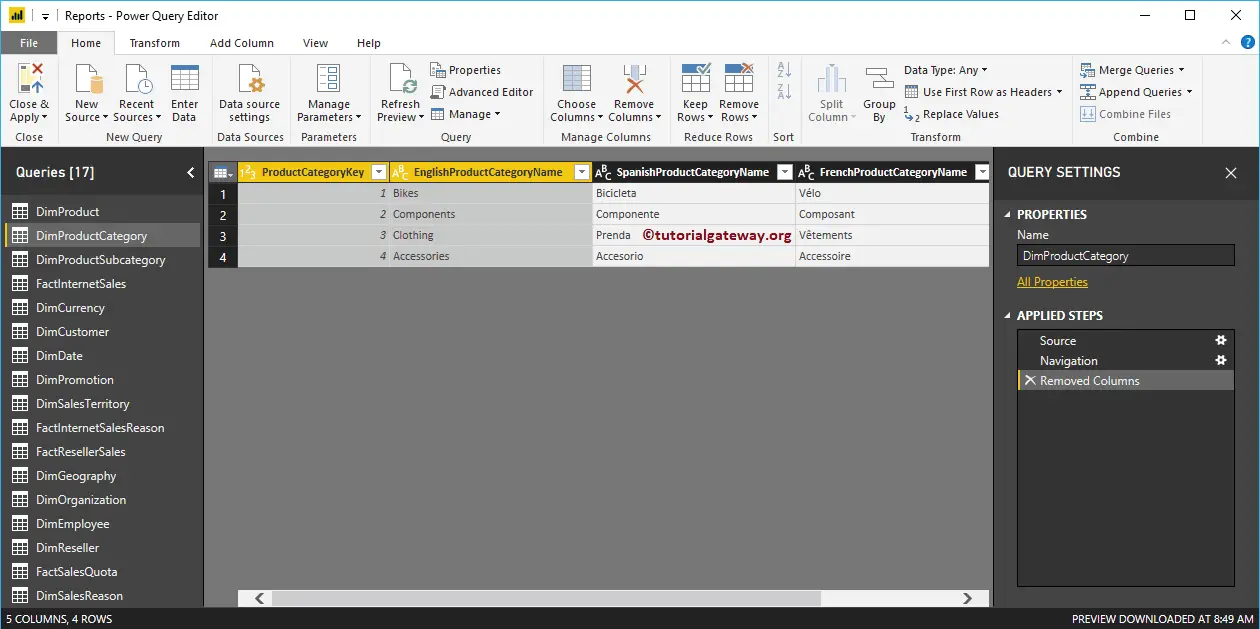
To remove unwanted columns from the existing tables, please click the Edit Queries option under the Home tab.
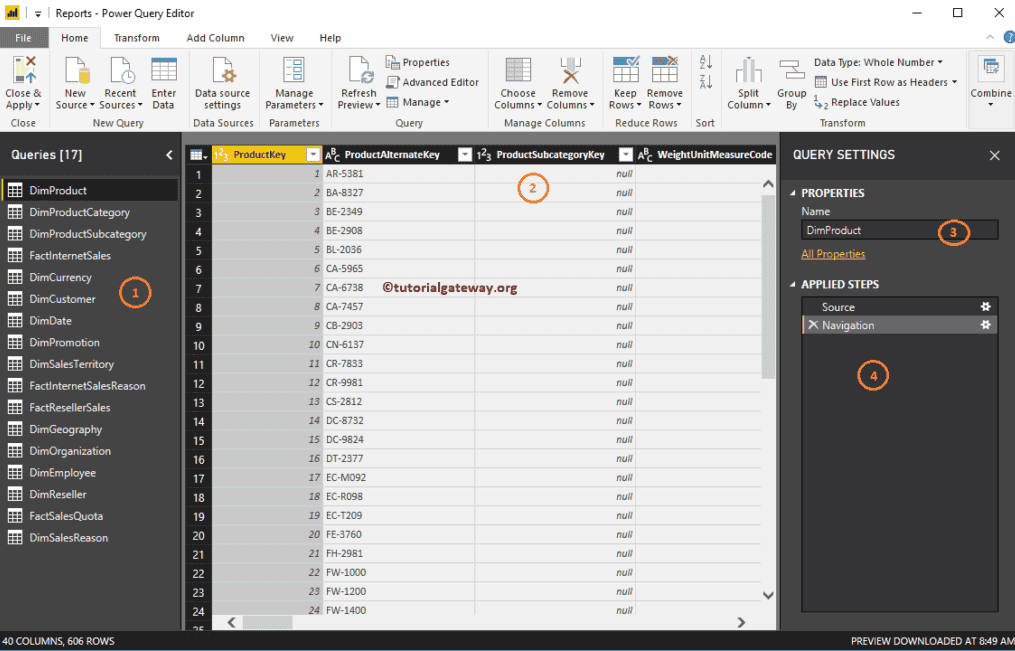
Clicking Edit Queries option opens a new window called Power Query Editor.
- Queries: List of available tables.
- Display the Data (rows and columns) present in the selected table.
- Properties: Selected table Name. You can use this section to rename the Table to more meaningful.
- Applied Steps: It lists out the steps that we undertake on this Power BI table.
TIP: You can select the required column (or Ctrl + Select Columns for multiple columns) and hit the Delete button from your keyboard.
For the Remove Columns from Tables in Power BI demonstration purpose, we remove a few columns from the DimProductCategory table.

Remove Columns from Tables in Power BI – Approach 1
Please select the column that you want to remove. Next, right-click on it and select the Remove option from the context menu.
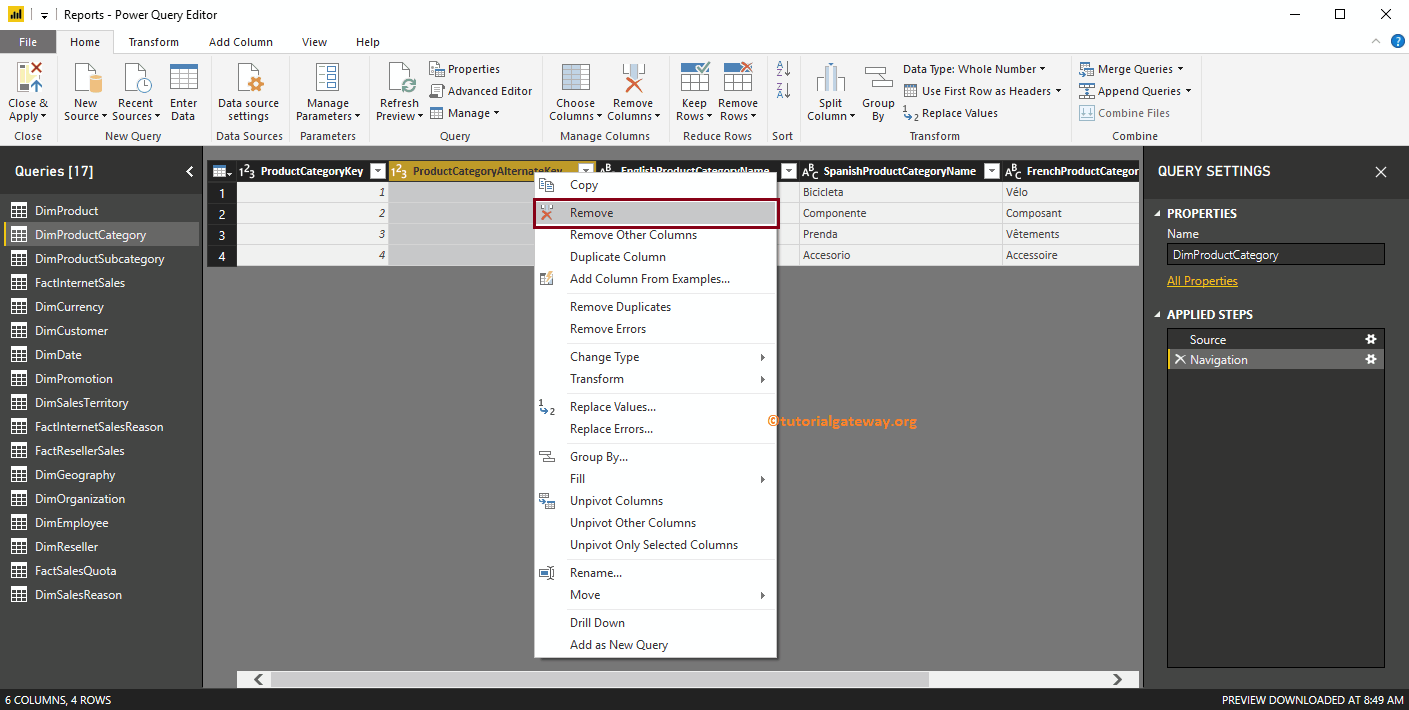
Now, you can see that the Product Category Alternative Key column removed from the table. And you can see the same under the Applied Steps section.
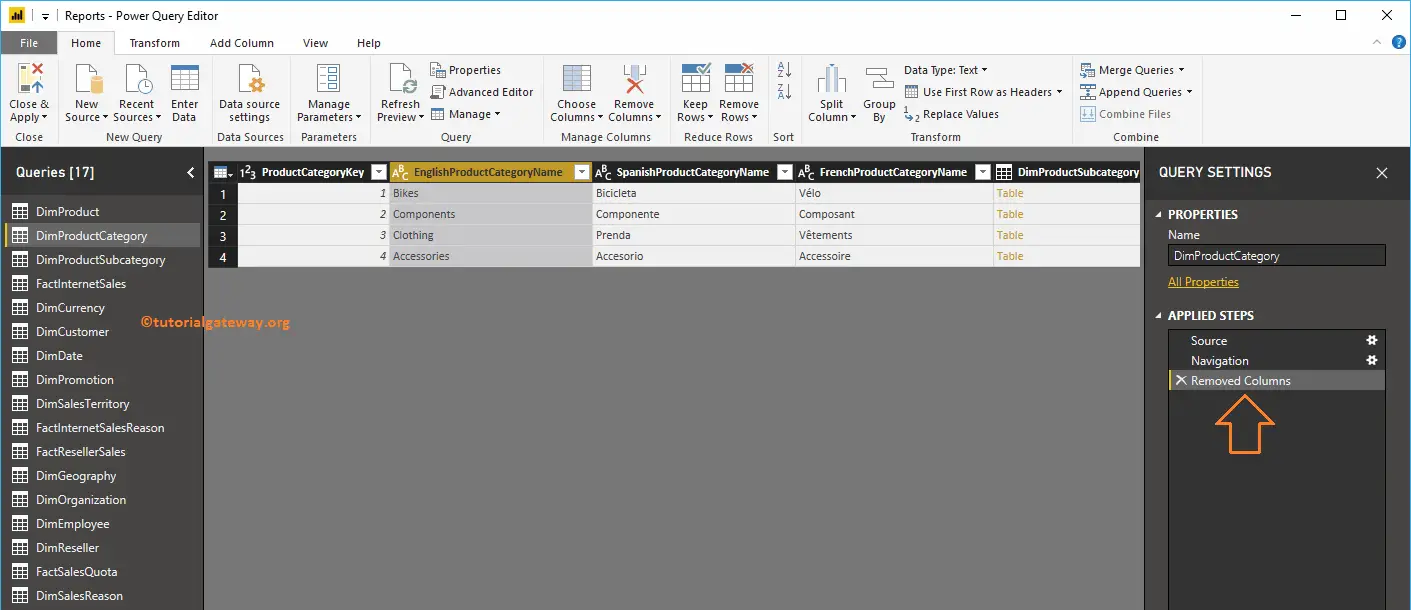
Remove Other Columns: Use this option to remove all the columns from the table except the selected columns.
For the demonstration purpose, I am selecting the Product Category Key and Product category name. Next, right-click and select the Remove Other Columns option from the context menu.
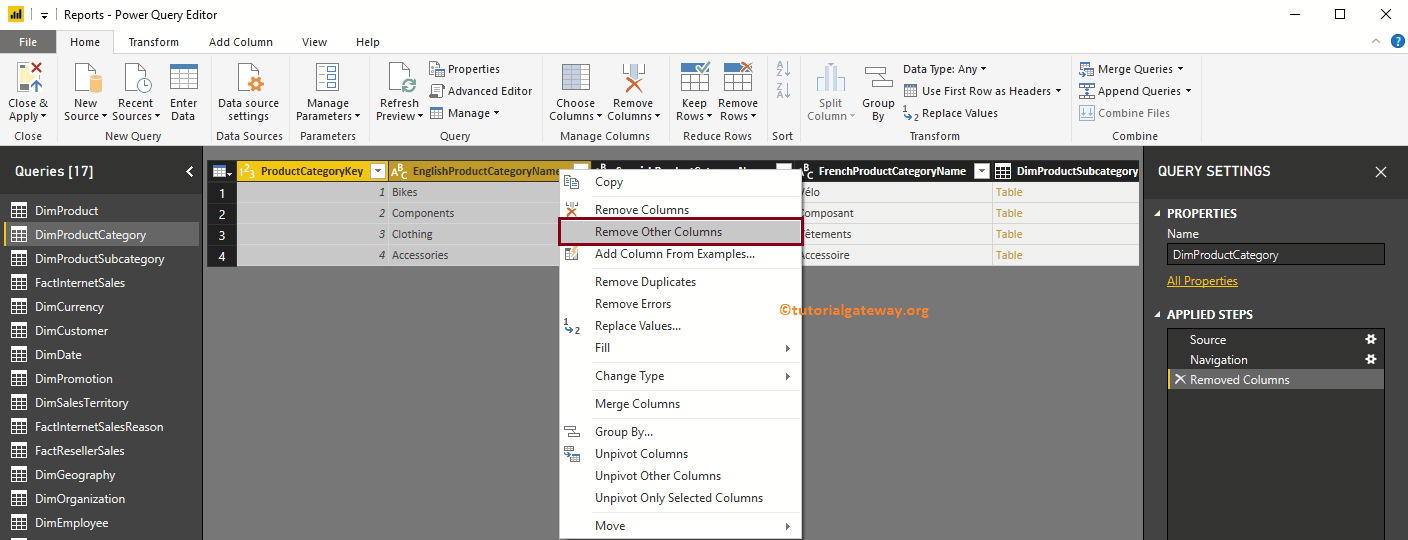
As you can see, all the other columns removed from the category table.
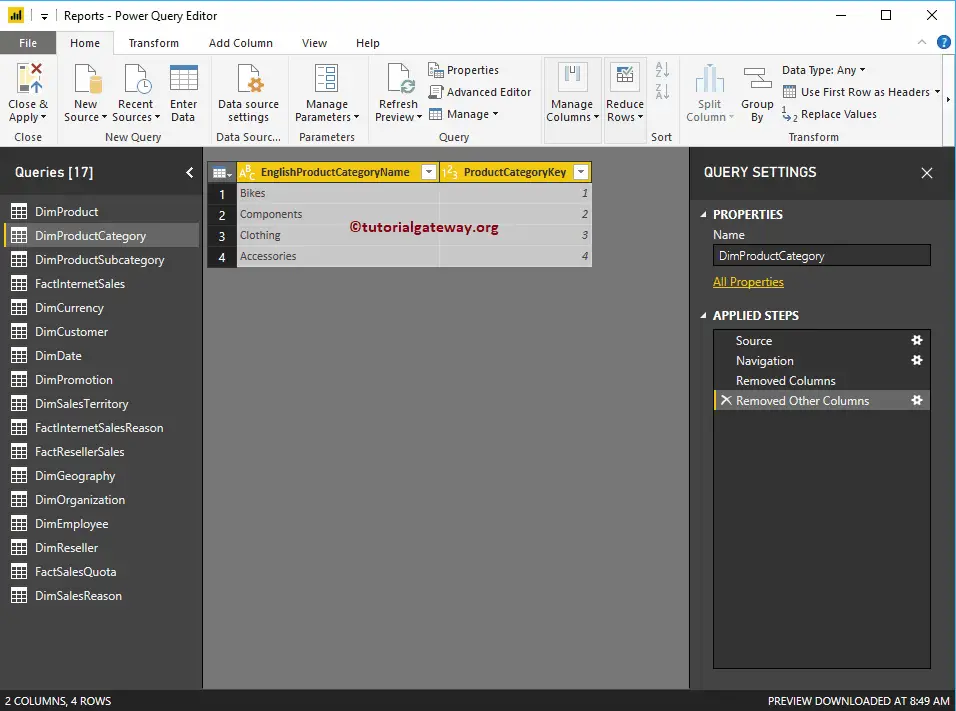
If you want to undo the changed (or revert the changes), then go to the Applied Steps section, and remove the step as we have shown below.
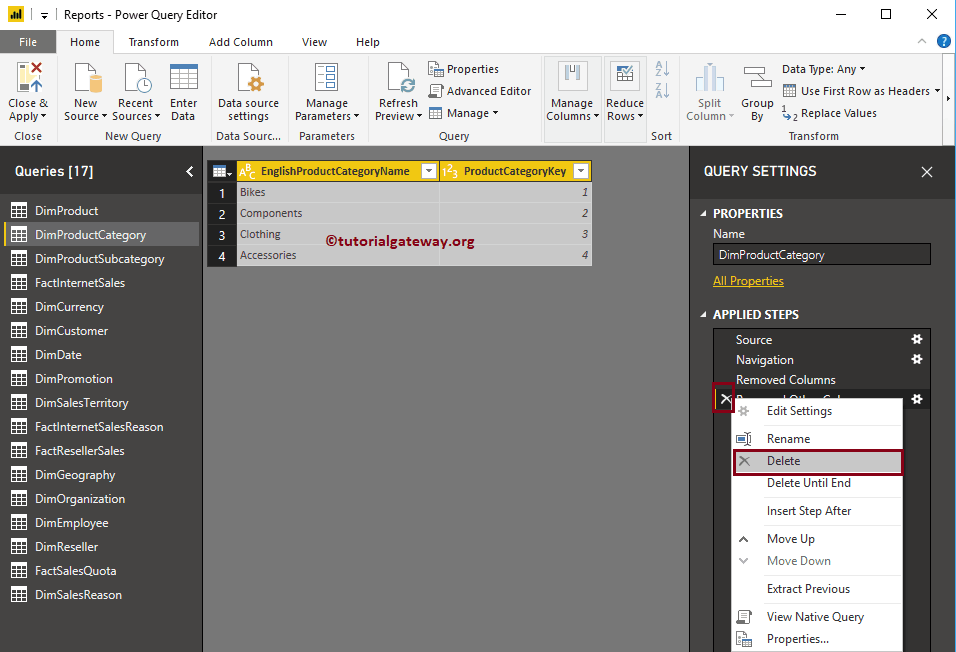
It undoes the steps
Remove Columns from Tables in Power BI – Approach 2
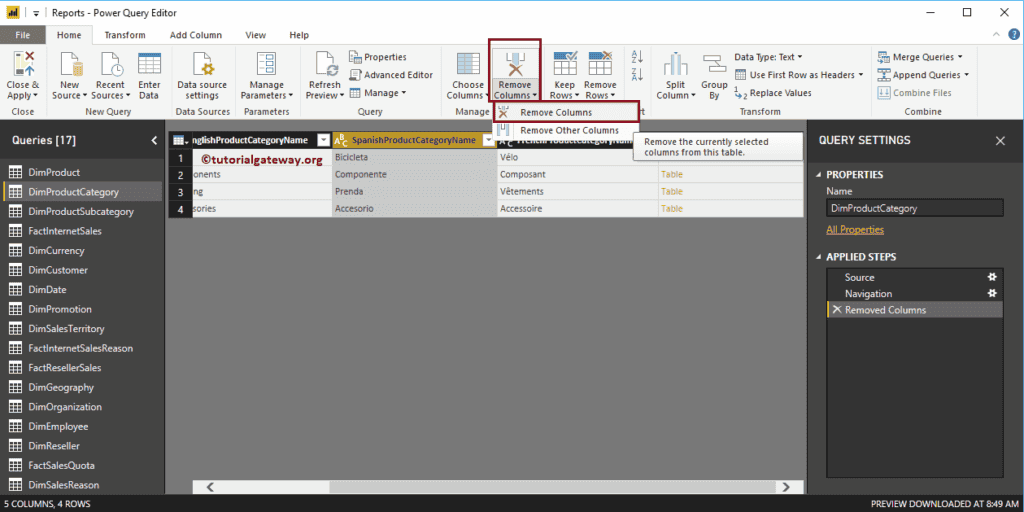
First, select the Column that you want to delete, and then click Remove Columns option under the Home tab.
Reordering Columns of Power BI Tables
Drag the column and place it as per your requirement. For the demonstration purpose, we are dragging the English product category Name from the last position to the first position.
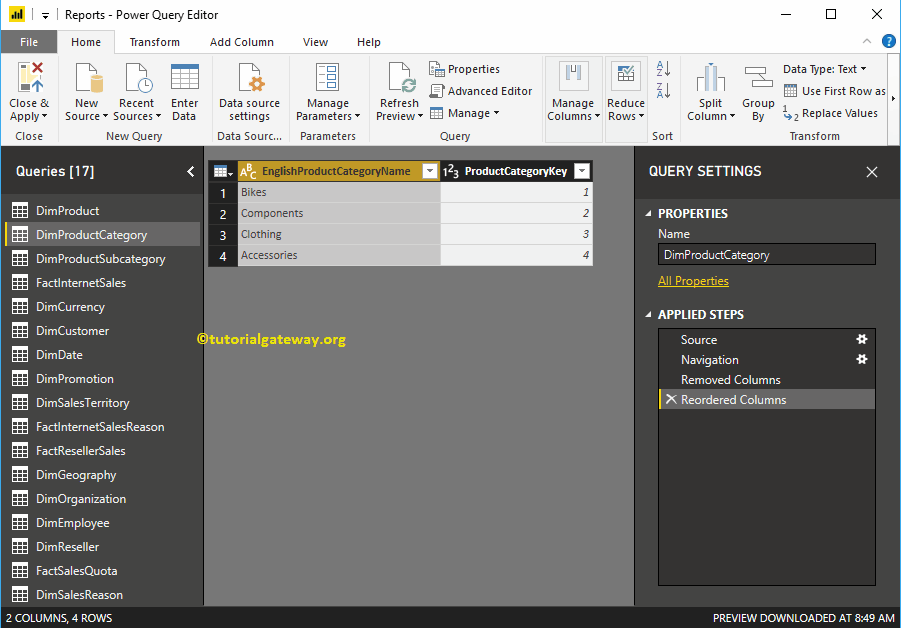
You can see the Category name in the First Position
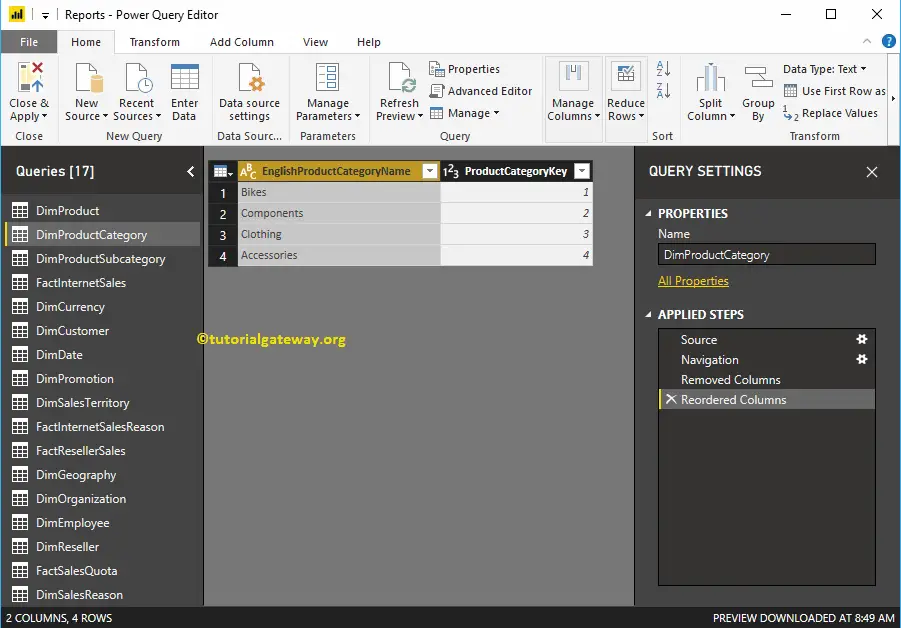
Whatever the changes you made will not effect until you hit Apply. Let me hit the Close & Apply option under the Home tab.
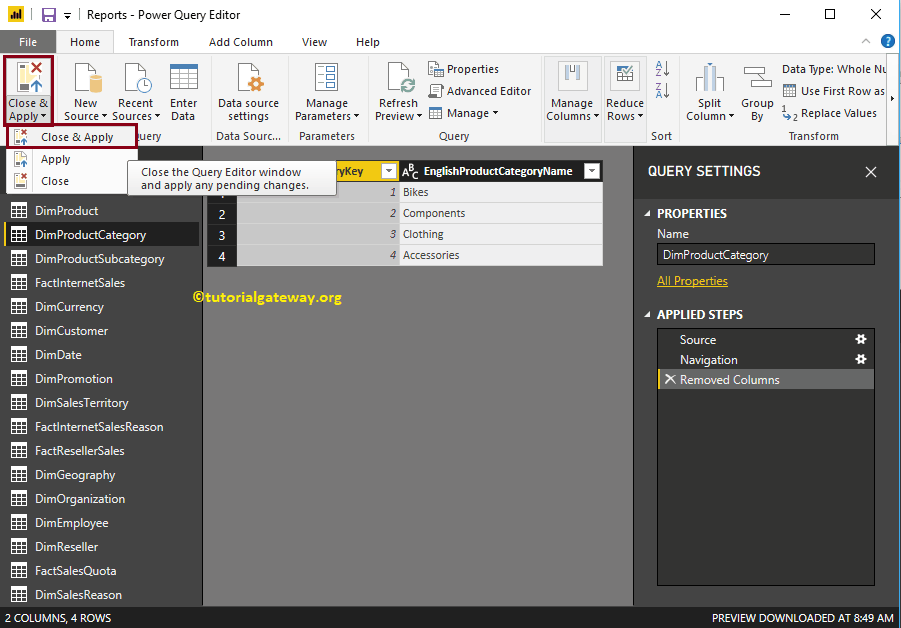
Please wait until the changes made.
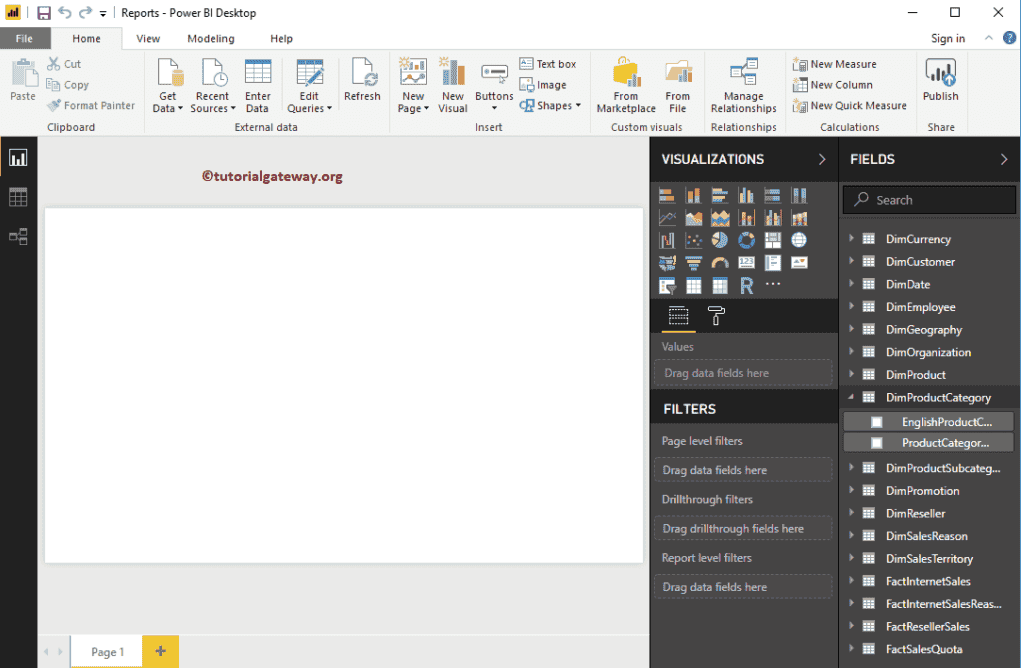
And you can see that the product Category table has only two columns.
