Power BI Tutorial - Power BI Transformations
Posted by Superadmin on August 19 2020 17:33:55
Power BI Transformations
In real-time, we don’t get the data that we can directly use in the reports. I mean, we have to clean that data to meet our business standards. Within the Power BI desktop, we have a power query editor to perform all the operations that we needed. This section of the Power BI tutorial explains most of the data transformations that you need.
- Bins
- Change the Data type of a Column
- Combine Multiple Tables
- Clusters
- Enter data or Copy & Paste data from Clipboard
- Format Dates
- Groups
- Hierarchies
- Joins
- Pivot Table
- Query Groups
- Reorder or Remove Columns
- Rename Column Names
- Rename Table Names
- Split Columns
- UnPivot Table
Create Bins in Power BI
Power BI Bins or buckets are useful to create a Range of data, similar to SQL Buckets. Let me show you how to create bins in Power BI with an example
For this Power BI bins demonstration, we are going to use the SQL Data Source that we created in our previous article. So, Please refer Connect to the SQL Server article to understand the Data Source.
Create Bins in Power BI
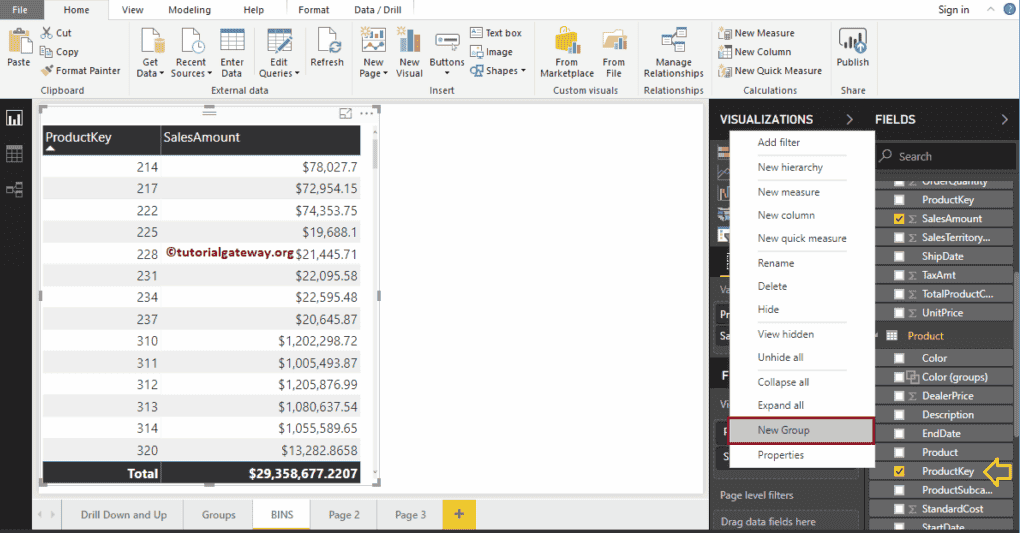
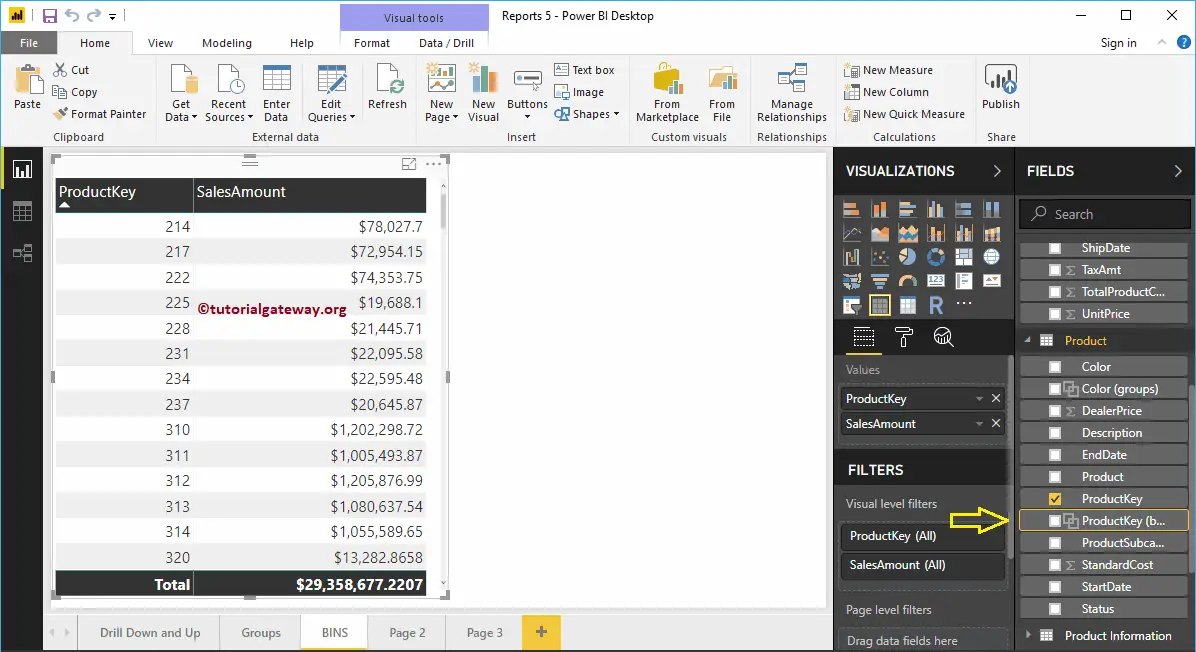
To visually demonstrate this Power BI bins, we will create a Table. As you can see from the screenshot below, we created a simple Table by dragging the Product Key and Sales Amount column.
NOTE: I suggest you refer to Create a Table and Format Table article to understand the steps involved in creating and formatting a Power BI Table.
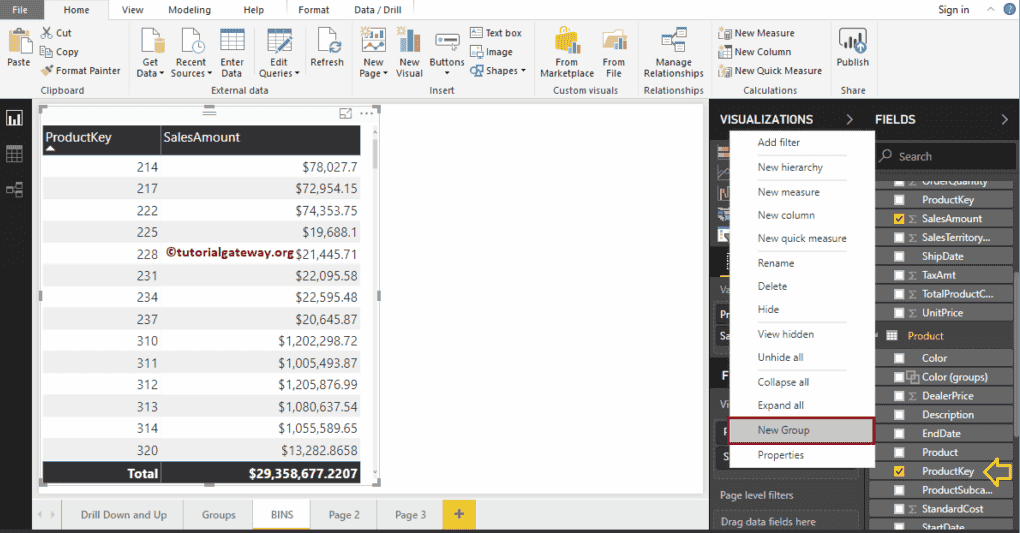
Please select the filed that you want to use as a bin, and right-click on it opens the context menu. Select the New Group option from the menu.
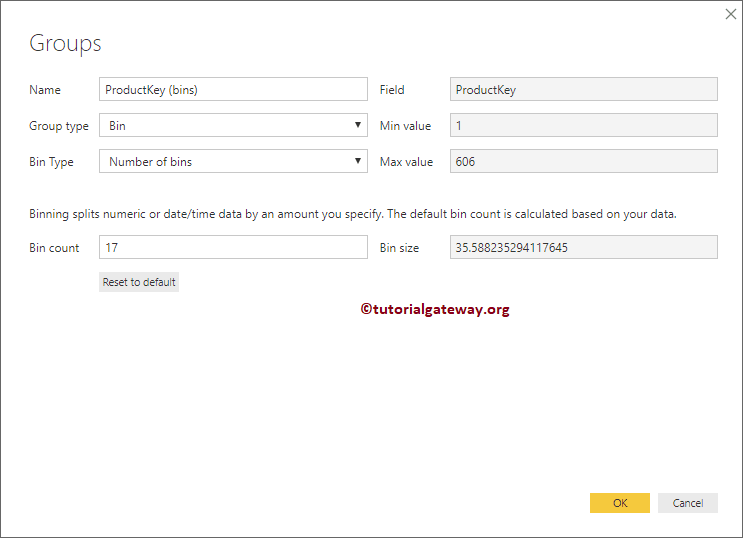
Clicking the New Group option opens the following window.
- Name: Specify the Power BI Bin name
- Field: Field or Column that you used for binning
- Group Type: List (group) or bin.
- Bin Type: There are two option such as Size of Bins or Number of Bins
- Min and Max Value: Minimum and maximum value present in the selected Fields. Here, it is the Product Key.
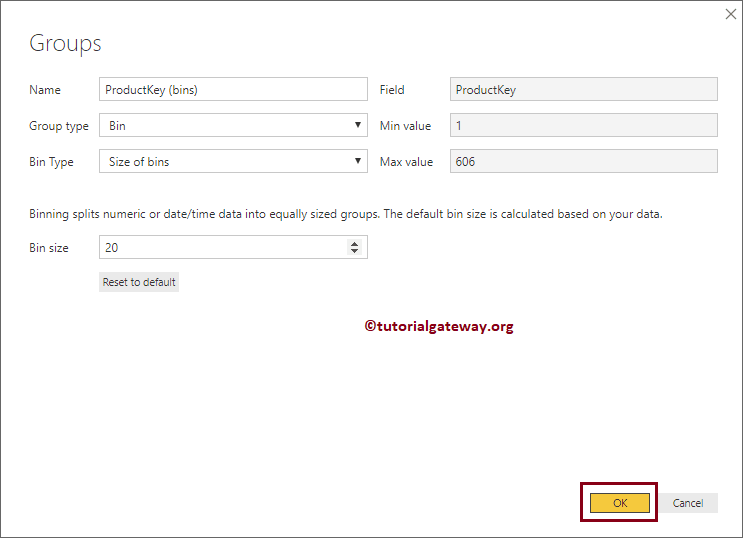
If you selected the Bin Type as Size of Bins, then you have to specify the Bin size (static Number)
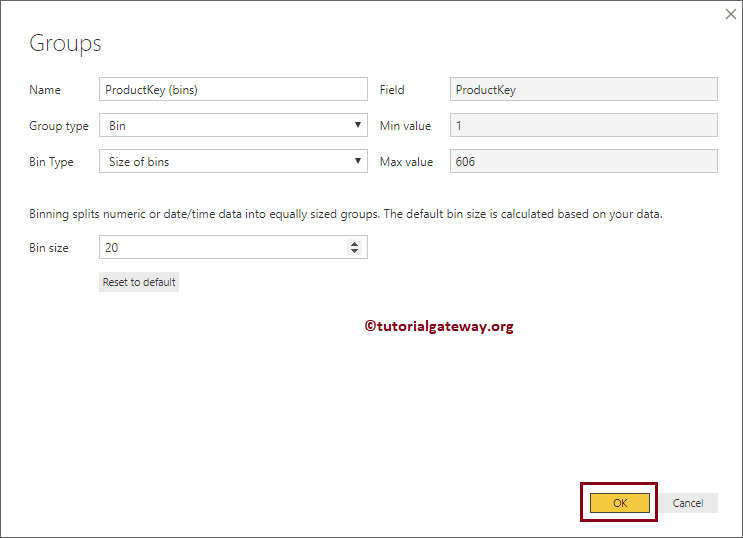
Alternatively, if you selected the Bin Type as Number of Bins, then you have to specify the Bin count. Here, Bin size depends upon the Bin count.
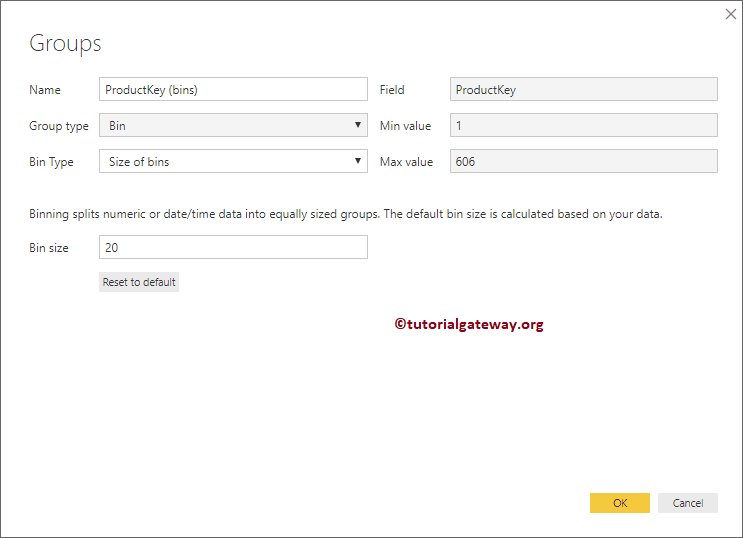
Let me select the Bin size as 20 and click OK. It means each bucket size is 20
Now you can see the newly created bin under the Product table.
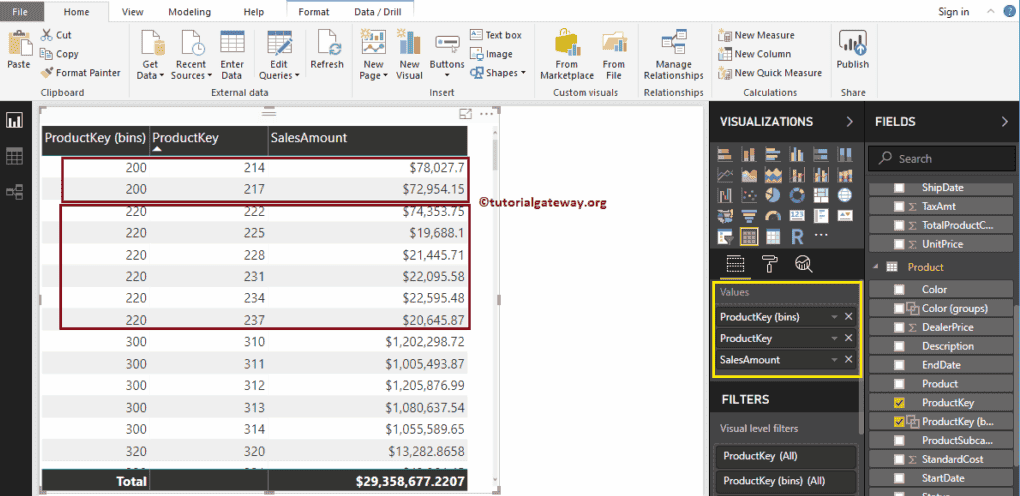
Let me add that bin to this table. From the below screenshot, you can see that the product Key value is 220 for the keys between 220 to 240
Edit Power BI Bins
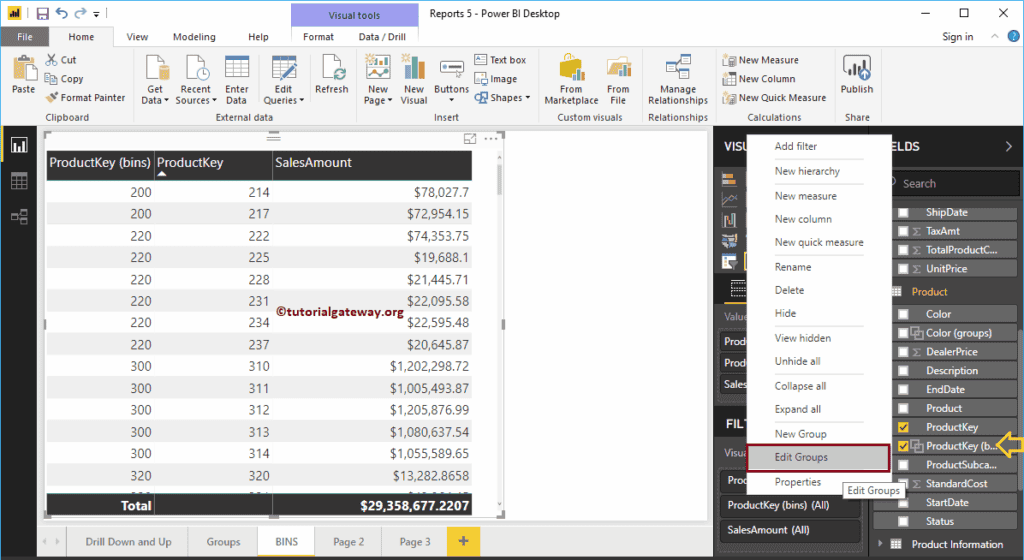
Please select the bin that you want to edit, and right-click on it opens the context menu. Select the Edit Groups option from it
Clicking the Edit Groups option opens the following window. Use this window to change as per your requirement.
Delete Bins in Power BI
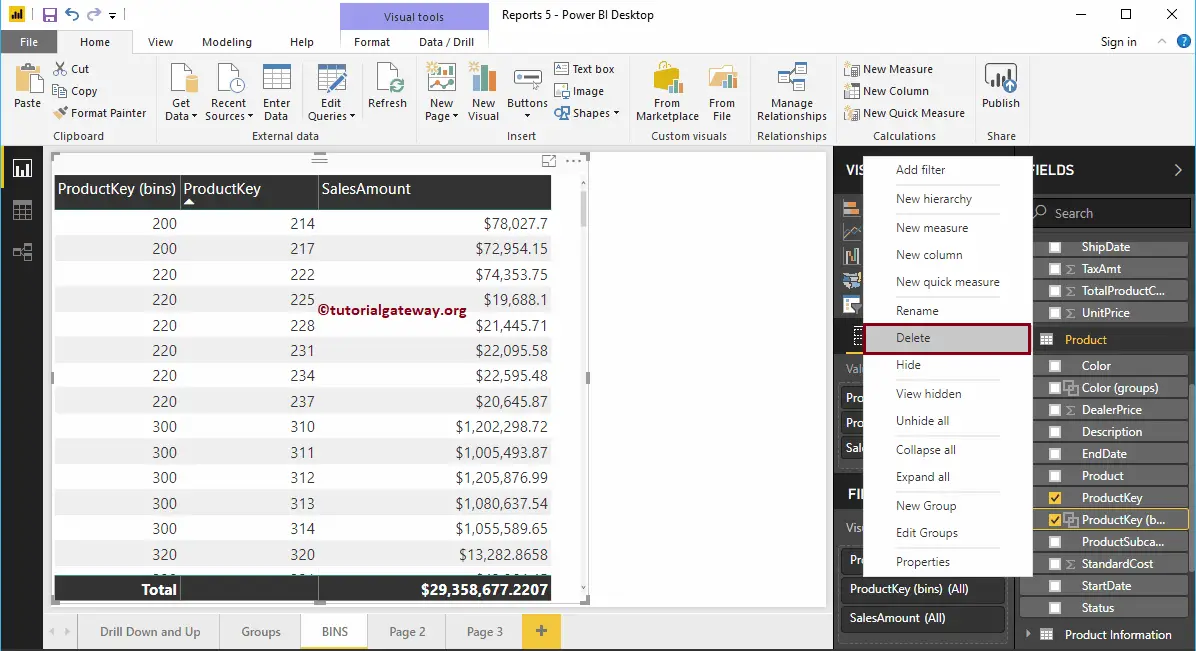
Please select the bin that you want to delete, and right-click on it opens the context menu. Select the Delete option form it
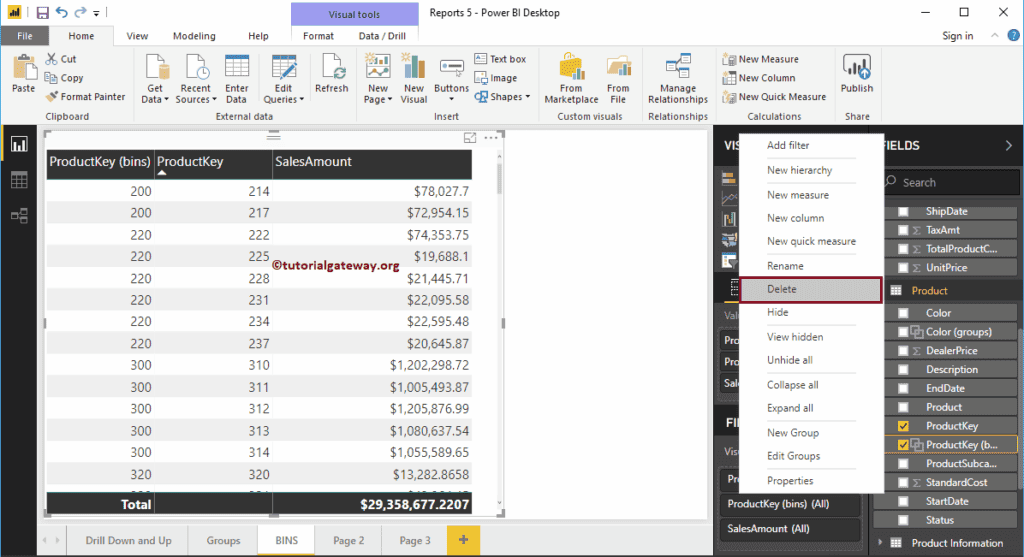
Click the Delete button to confirm the delete operation.
Create Bins in Power BI Example 2
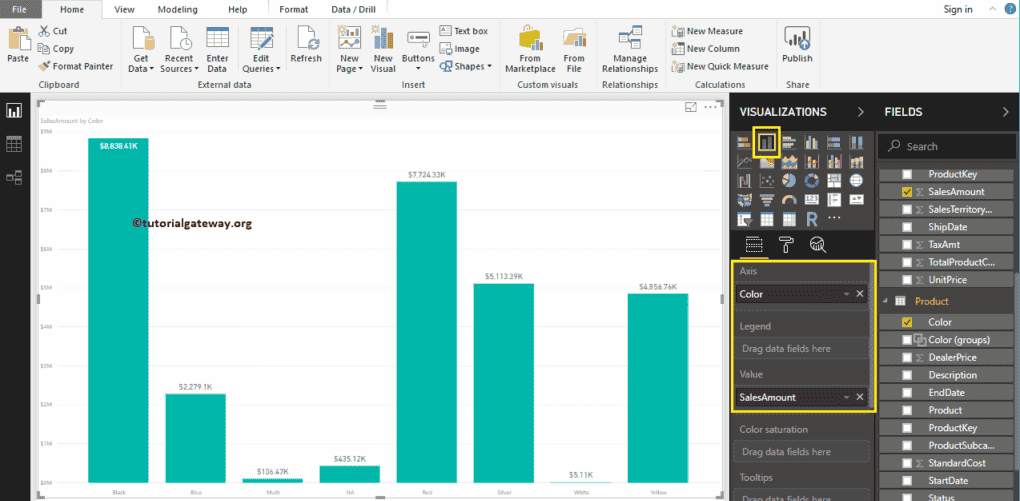
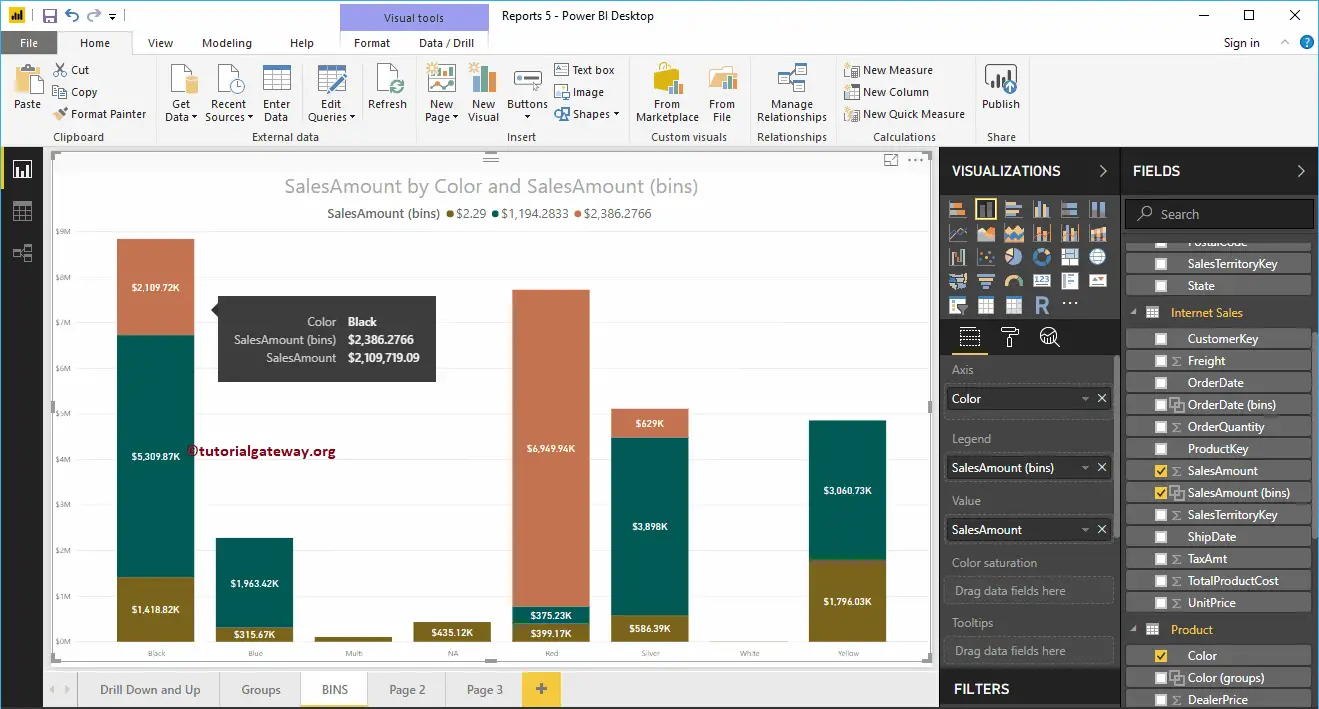
To demonstrate the Bins, we created a Column chart that shows Color wise sales. This time we create a bin on Sales Amount
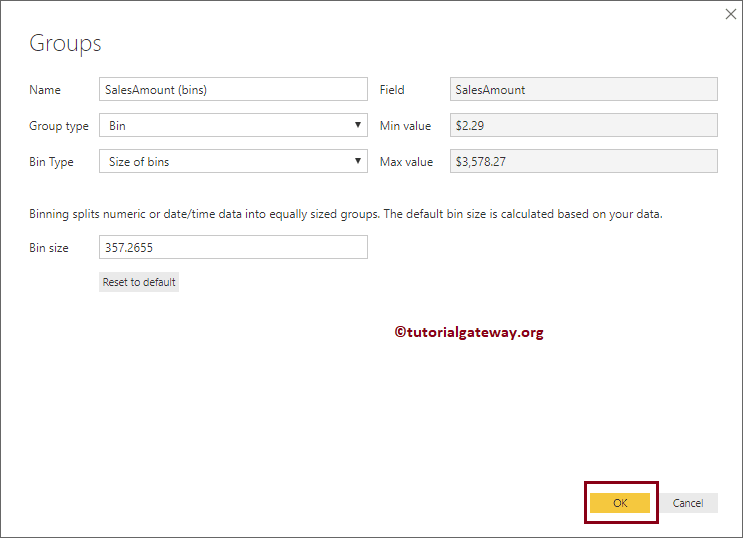
Right-click on the Sales Amount, and select the New Group option from the context menu. As you can see from the below screenshot, we defined the Power BI Bin size as the 357.2655
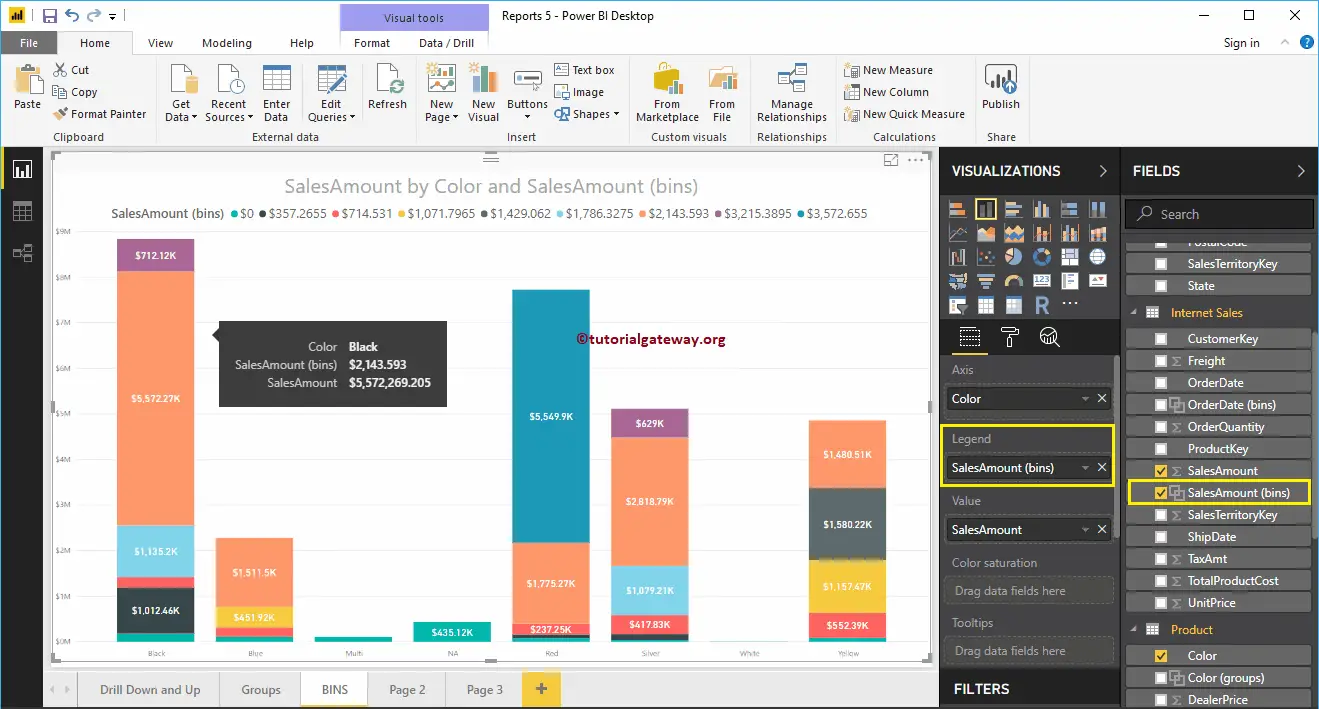
Let me add this new Sales Amount bin to the Column chart legend section.
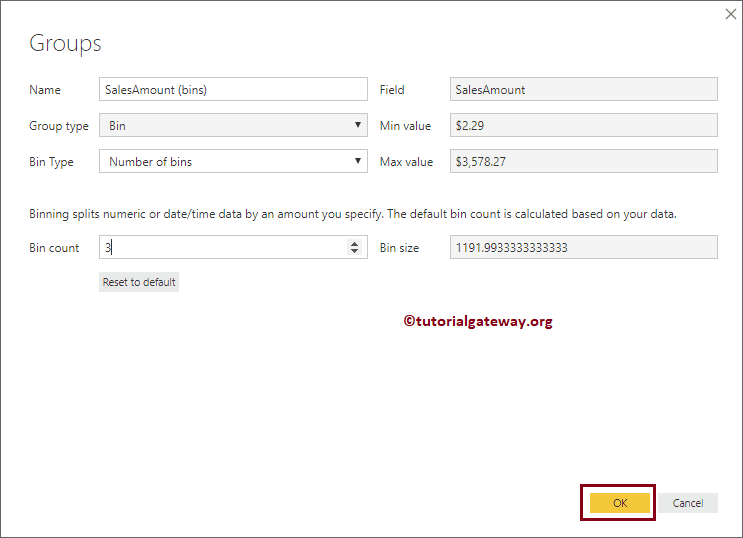
Let me Edit the Power BI Bin, and change the Bin type to Number of Bins, and Bin count to 3
Now you can see, each bar in the column chart divided by a bin of count 3.
Change Data Types of a Column in Power BI
Generally, when you load a table from any data source, Power BI automatically detects the data type of a column. However, there may be some situations where Power BI might get them wrong.
For example, it may consider amounts, values, or even dates as the text. In these situations, you can use Power BI change data types of a column option. Let me show you how to Change Data Types of a Column in Power BI with an example.
How to Change Data Types of a Column in Power BI
To demonstrate this Change Data Types of a Column, we are going to use the excel table that we imported in Enter Data article.
To change data types of any column, please click the Edit Queries option under the Home tab.
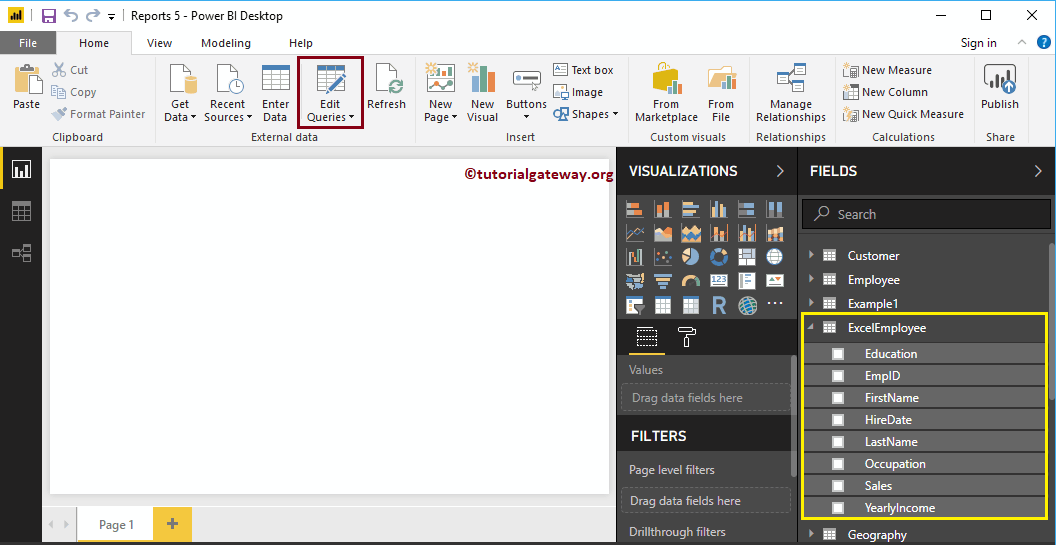
Clicking Edit Queries option opens a new window called Power BI Power Query Editor.
From the screenshot below, you can see Yearly Income, Sales, and HireDate columns loaded as the text.

There are a couple of ways to change data types of columns
First Approach to Change Data Types of a Column
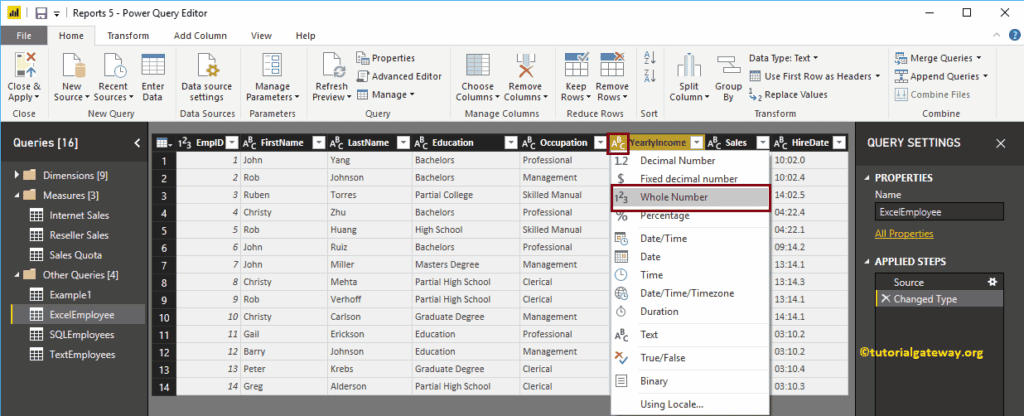
Please select the Column for which you want to change the data type. Next, click on the left corner of the column header (currently it represent ABC text)

Clicking in that position opens a drop-down list of supported data types. Please select the data type that suits your data. Here, we are selecting the Whole number.
Changing the data type of a column opens the following pop up window. Click on the Replace Current button.
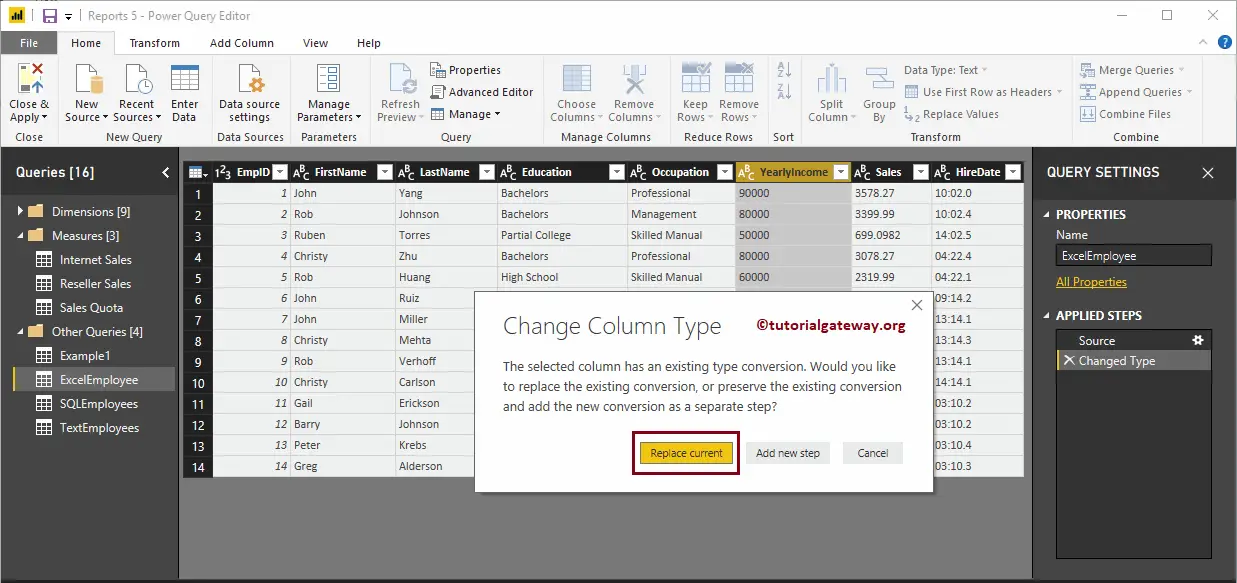
Now you can see the Yearly Income header is displaying 123 (whole number) not ABC (text)
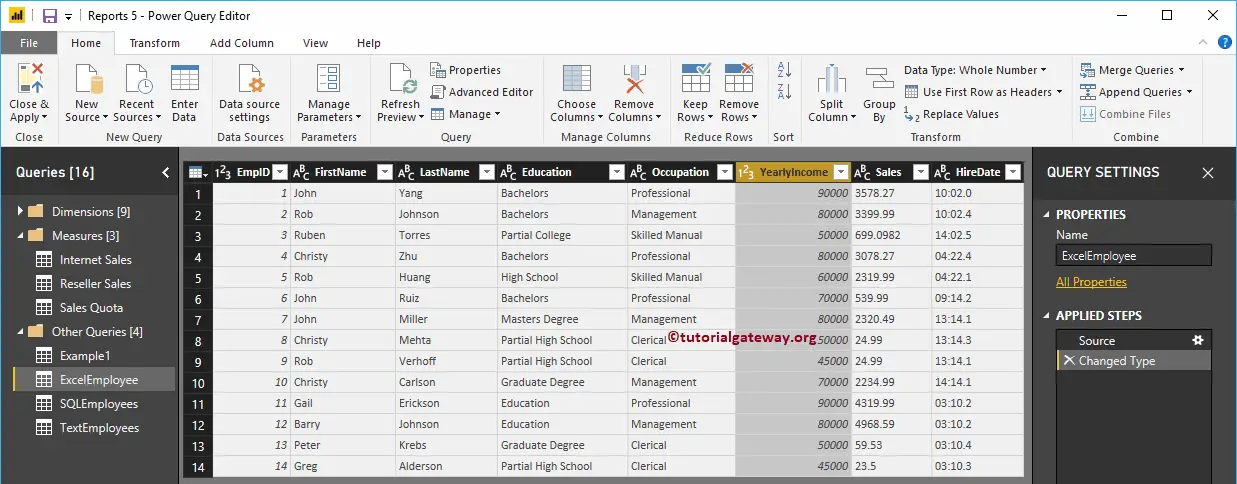
Second Approach to Change Data Types of a Column in Power BI
Please select the Column name that you want to alter the data type, and click on the Data Type button under the Home tab

It shows you the drop-down list of available data types. For the demo purpose, we are selecting a Fixed Decimal Number.
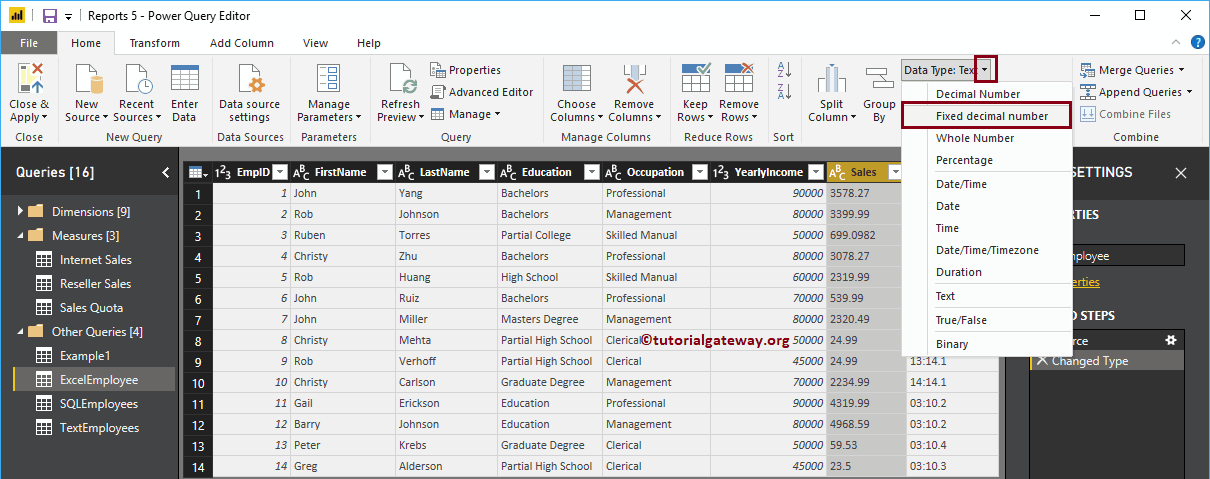
This time we will select the Add New Step. It means this change column type add as a new step under the Applied Steps.
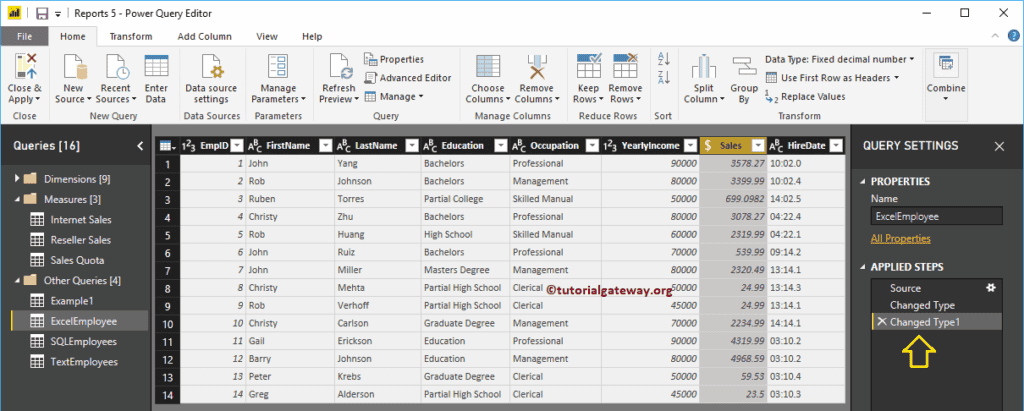
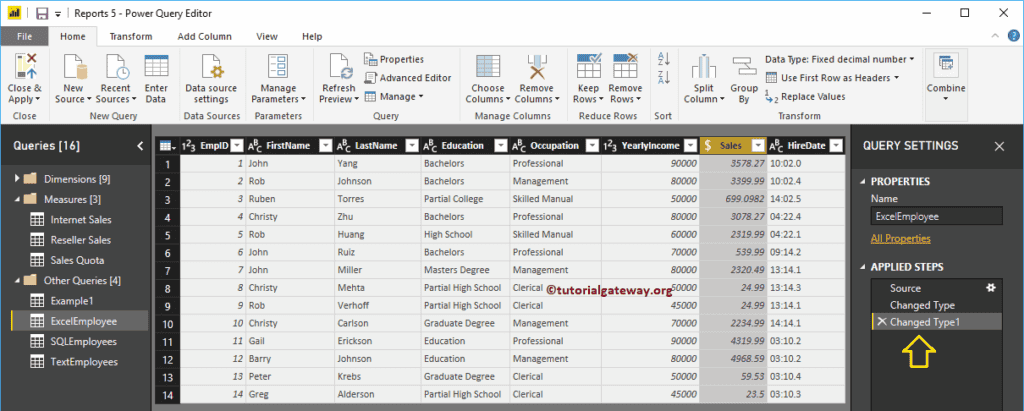
As you can see from the screenshot below, it changed the data type of the Sales column and added a new step under the Applied Steps.
Third Approach to Change Data Types of a Column in Power BI
Please select the column that you want to change the data type, and right-click on it will open the context menu. Select the Change Type and then the data type from the list. For now, we are selecting the Whole Number.
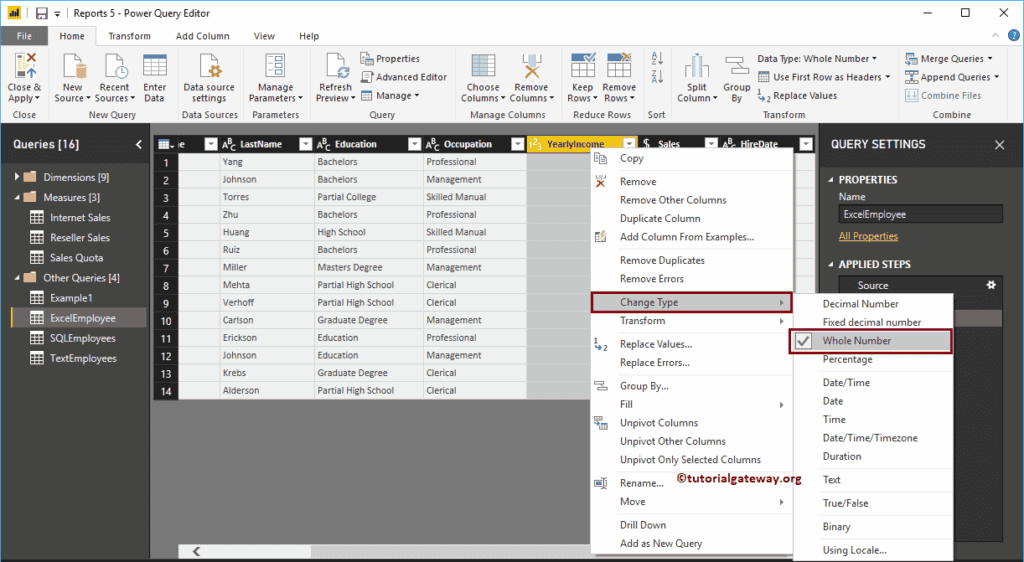
Don’t forget to hit the Close & Apply option under the Home tab to apply these changes.
Combine Multiple Tables in Power BI
Combine Multiple Tables in Power BI: In real-time, your data is in a normalized format, but in some situations, you might need the de-normalized data. In this situation, you can combine those tables using a query editor. Let me show you how to combine multiple tables in Power BI with an example.
How to Combine Multiple Tables in Power BI
From the screenshot below, you can see that there are three tables Product category, Product Subcategory, and Products table. We imported these tables in Connect to SQL article.
For the Combine Multiple Tables in Power BI demonstration purpose, we are going to combine these three tables. To do so, please click the Edit Queries option under the Power BI Home tab.
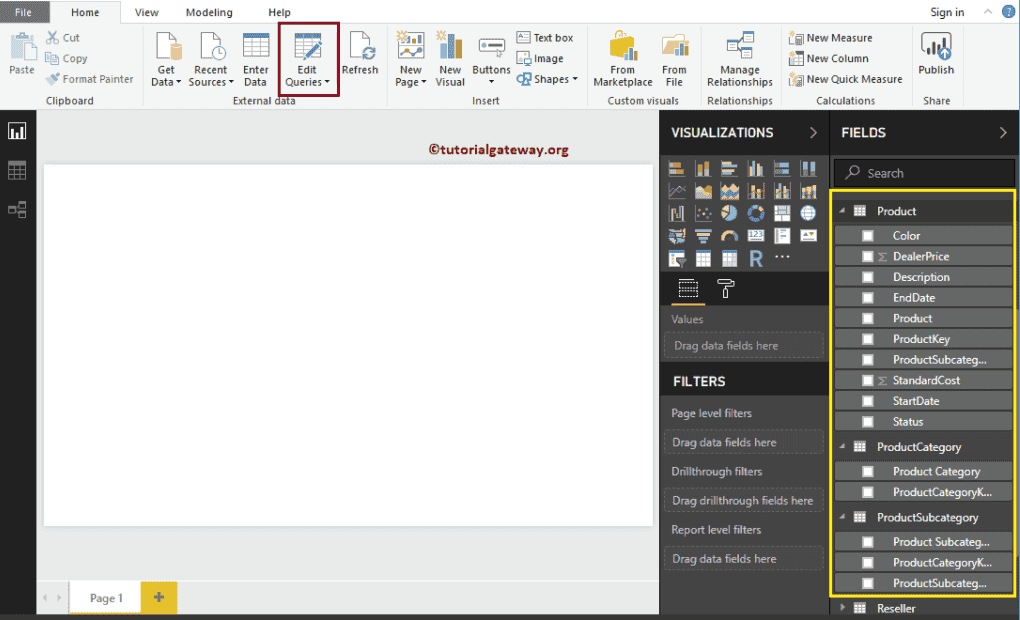
Clicking Edit Queries option opens a new window called Power Query Editor.
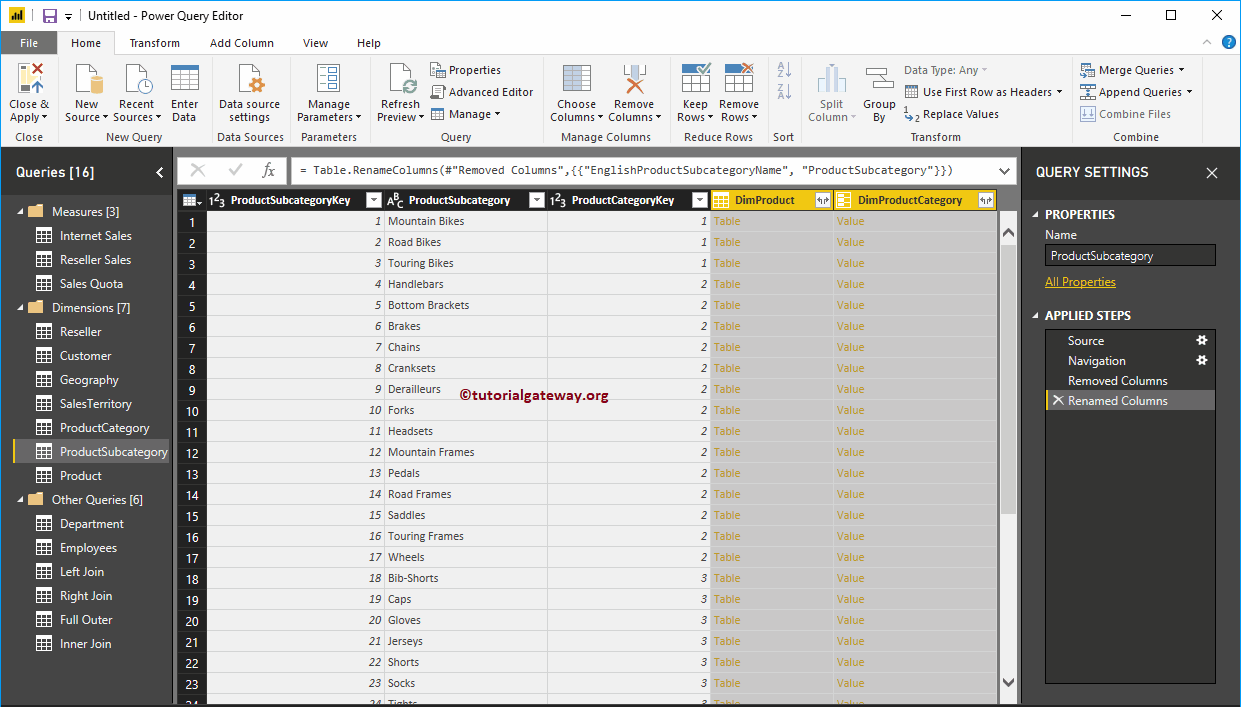
From the screenshot below, you can see that the Product Subcategory table has a connection with both the Product and Product Category table.
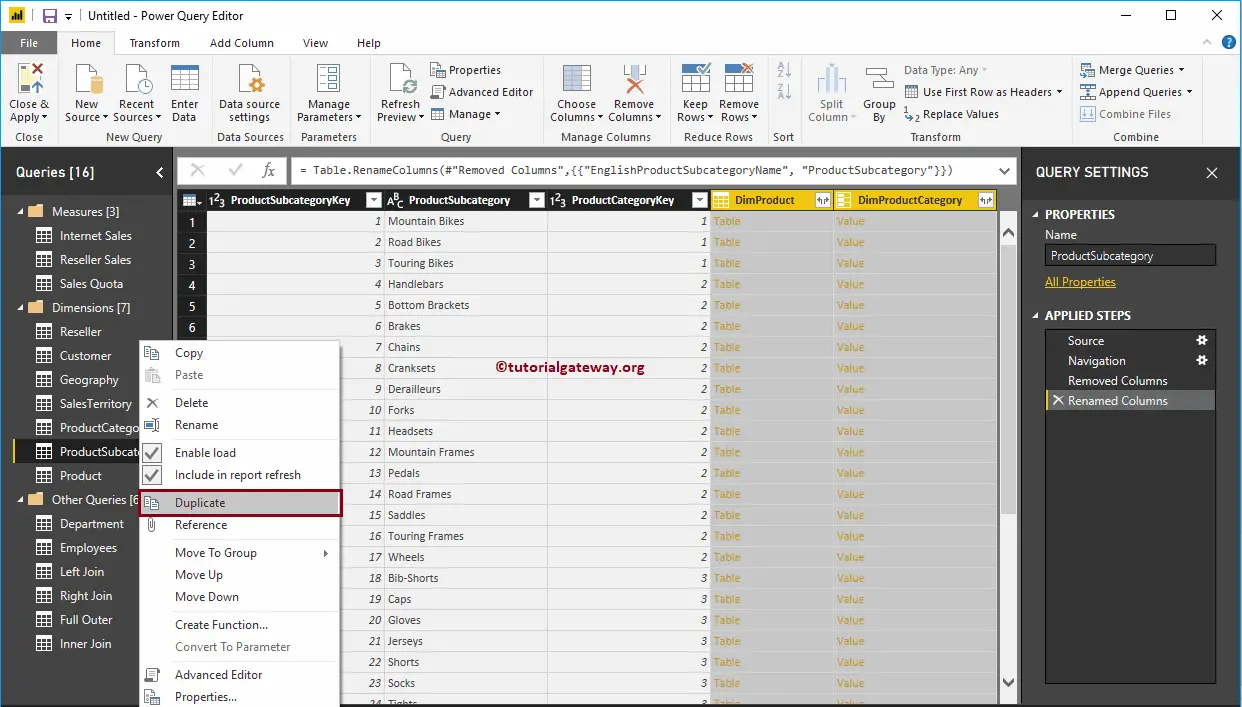
Before we start combining multiple tables in Power BI, let me duplicate this table by right-clicking the table and selecting the Duplicate option from the context menu.
We renamed it Product Information
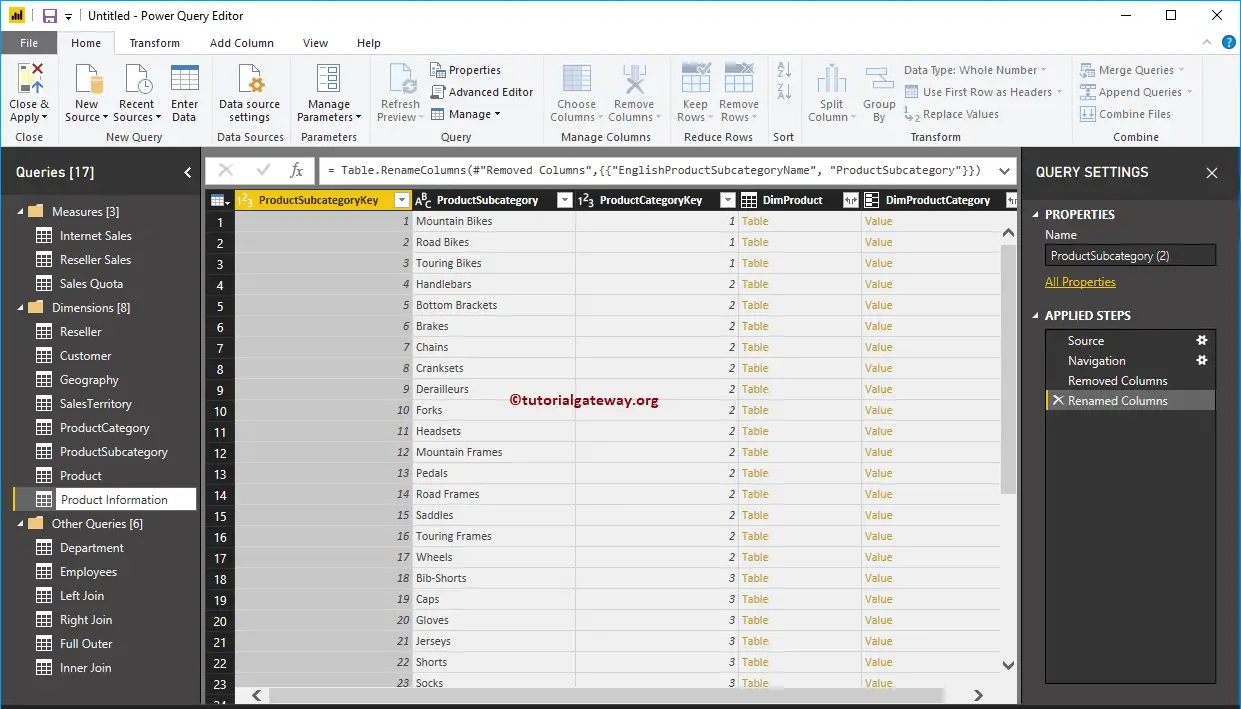
Click on the table on any row show you the respective table information.
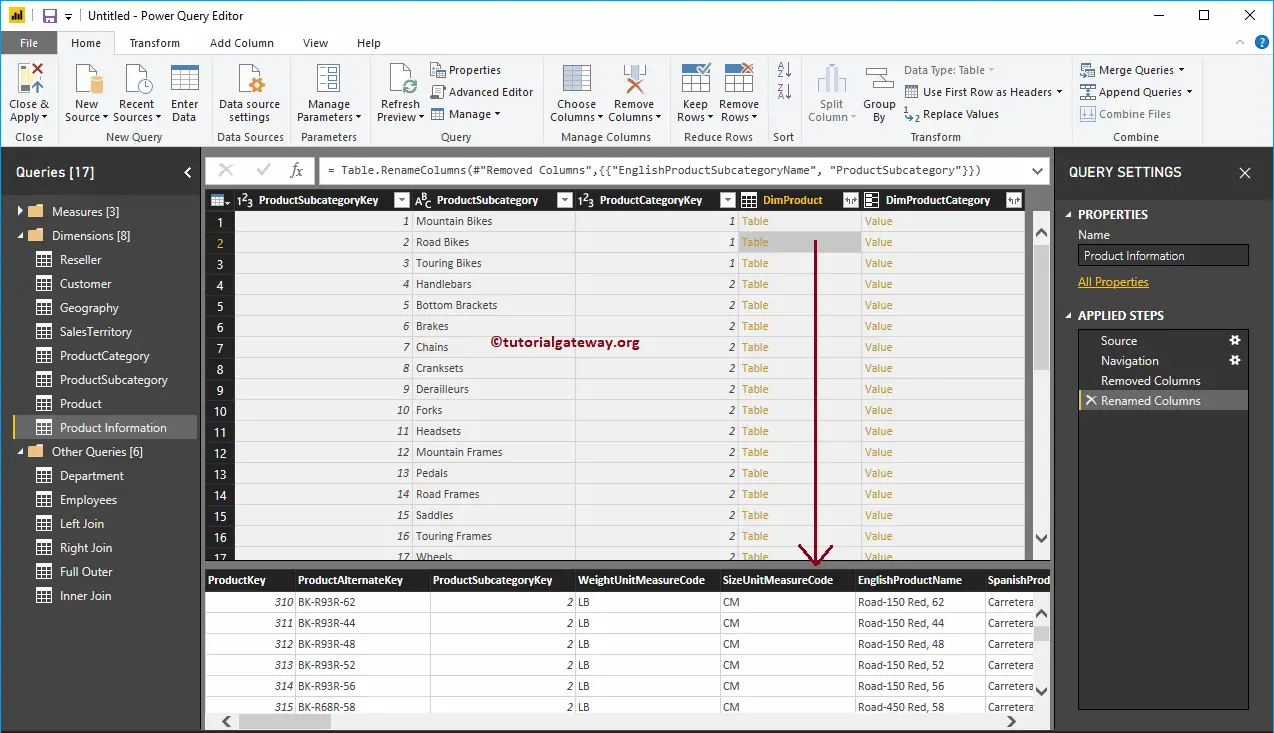
To combine the Dim Product table, Please click on the right corner of the Dim Product column header. It opens the following window. Use this window to select the required fields from the product table.
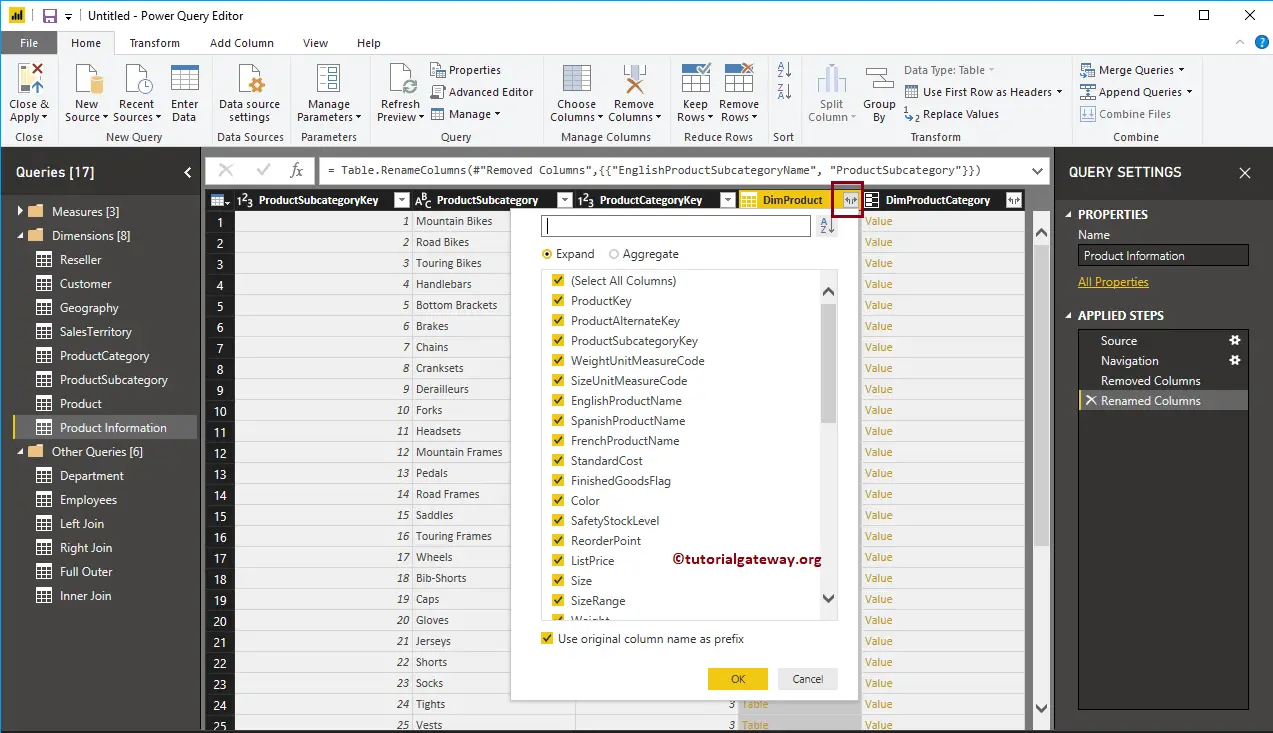
We selected the Product Key, Product Name, Color, and Standard Cost from the product table
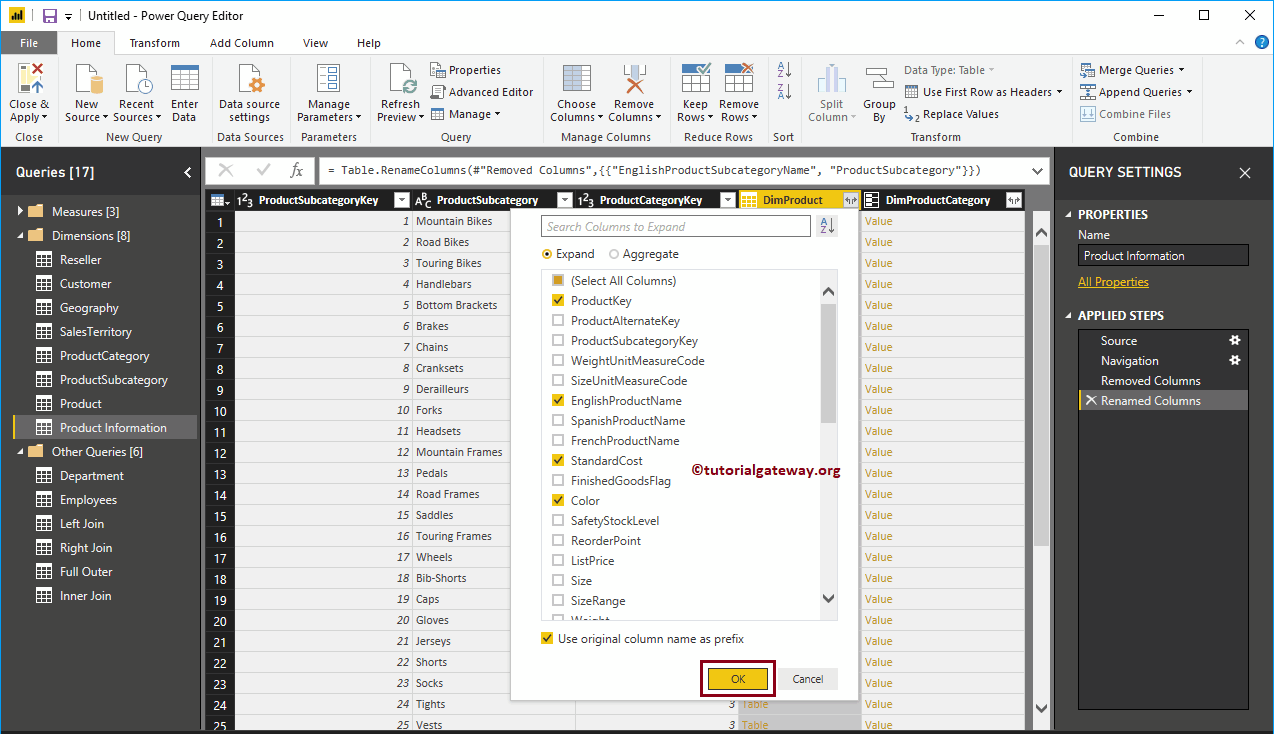
Now you can see those columns inside the product information table.
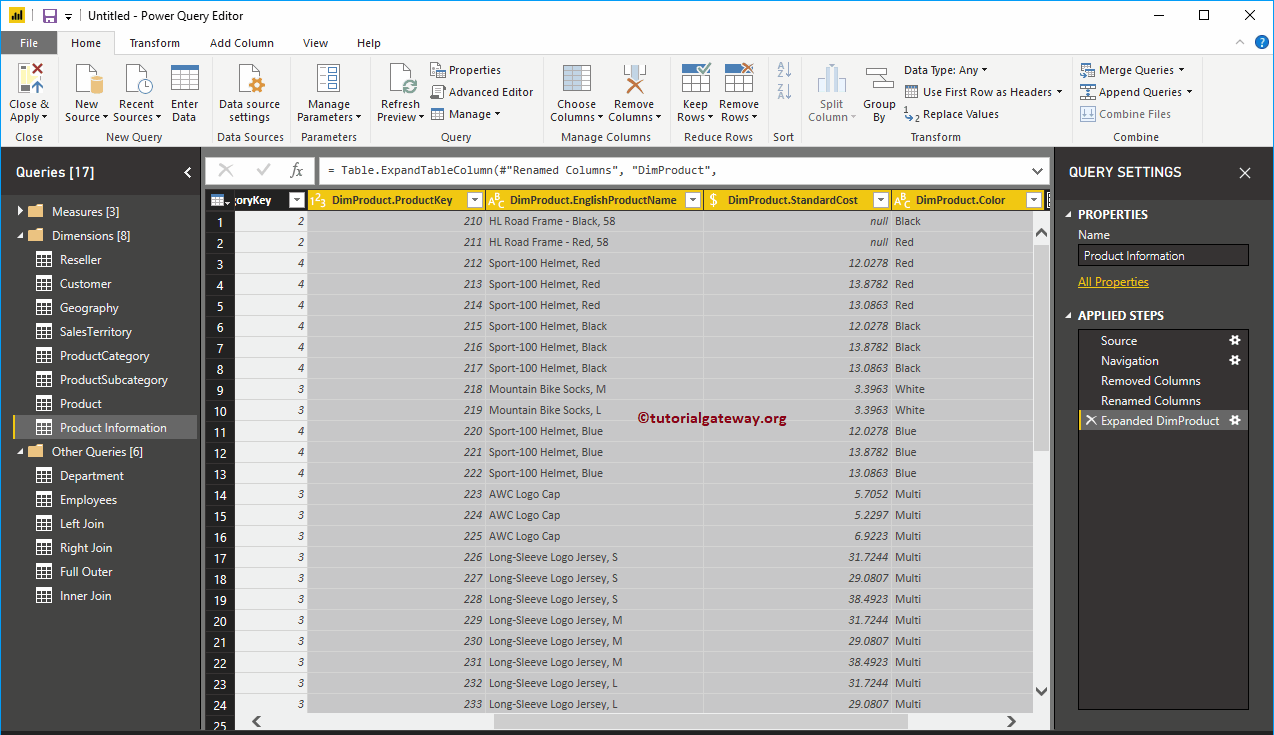
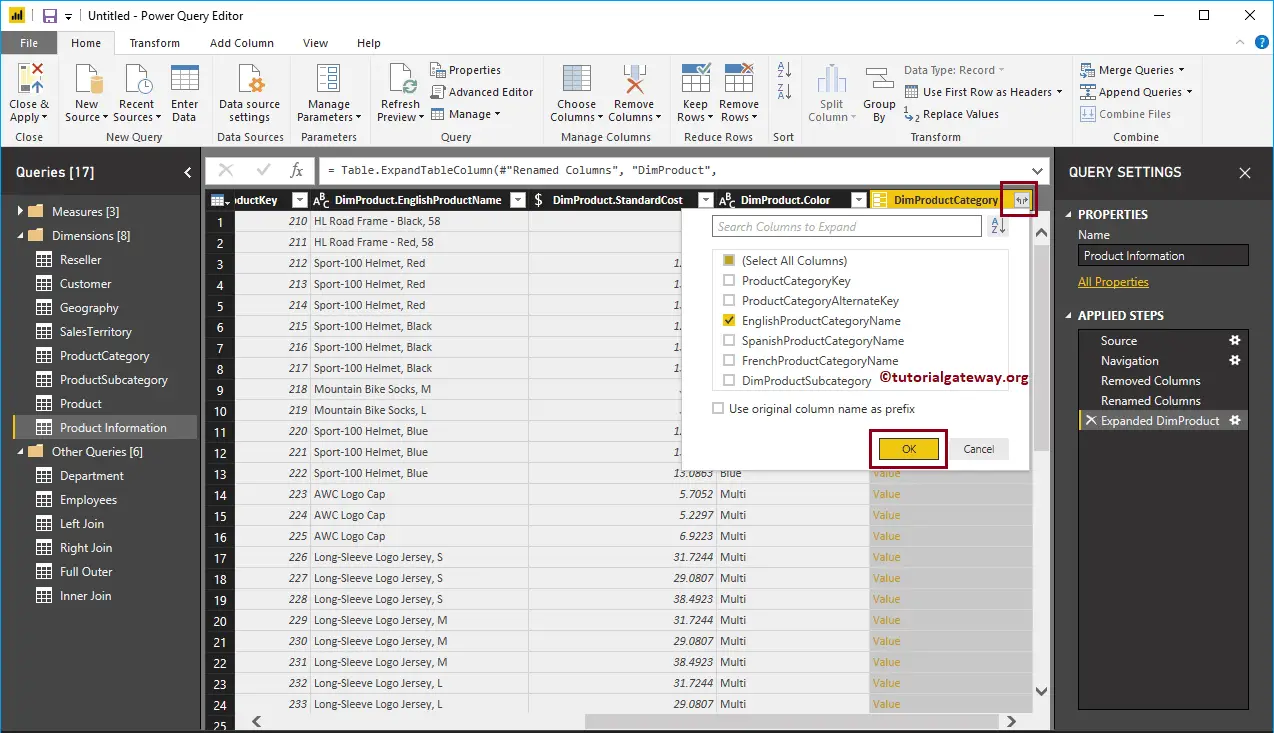
To combine the Dim Product Category table, right corner of the Dim Product Category column header. Please select the required fields from the product category table.
We just need the English product Category Name from this table
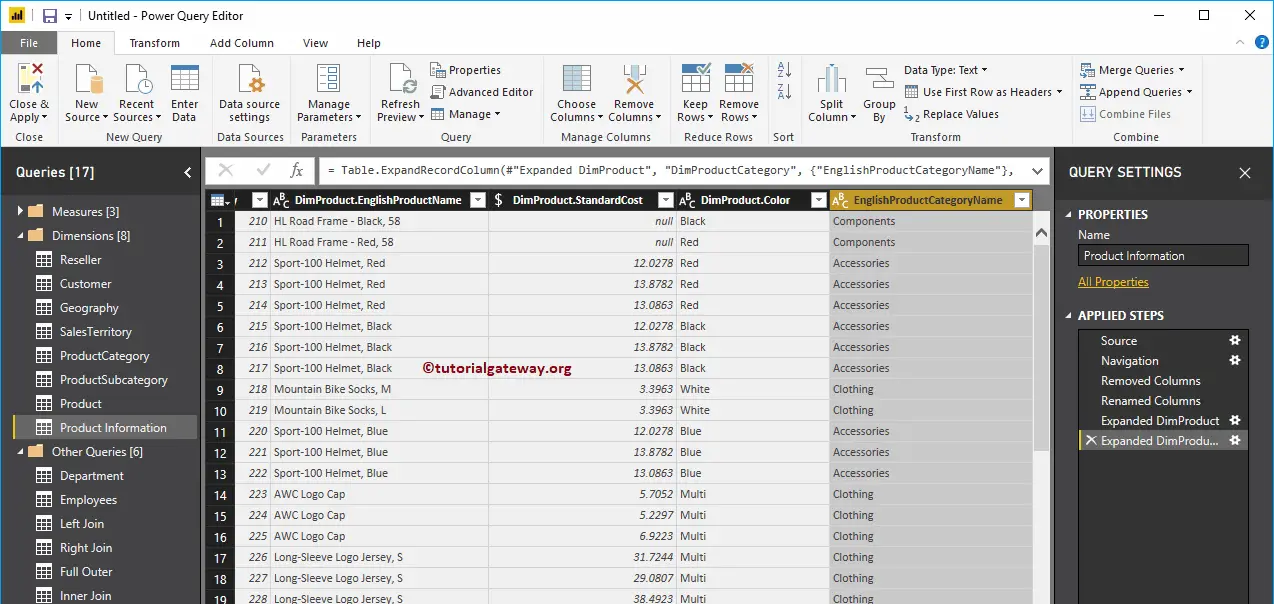
Now you can see the English product category name inside the Product information table.
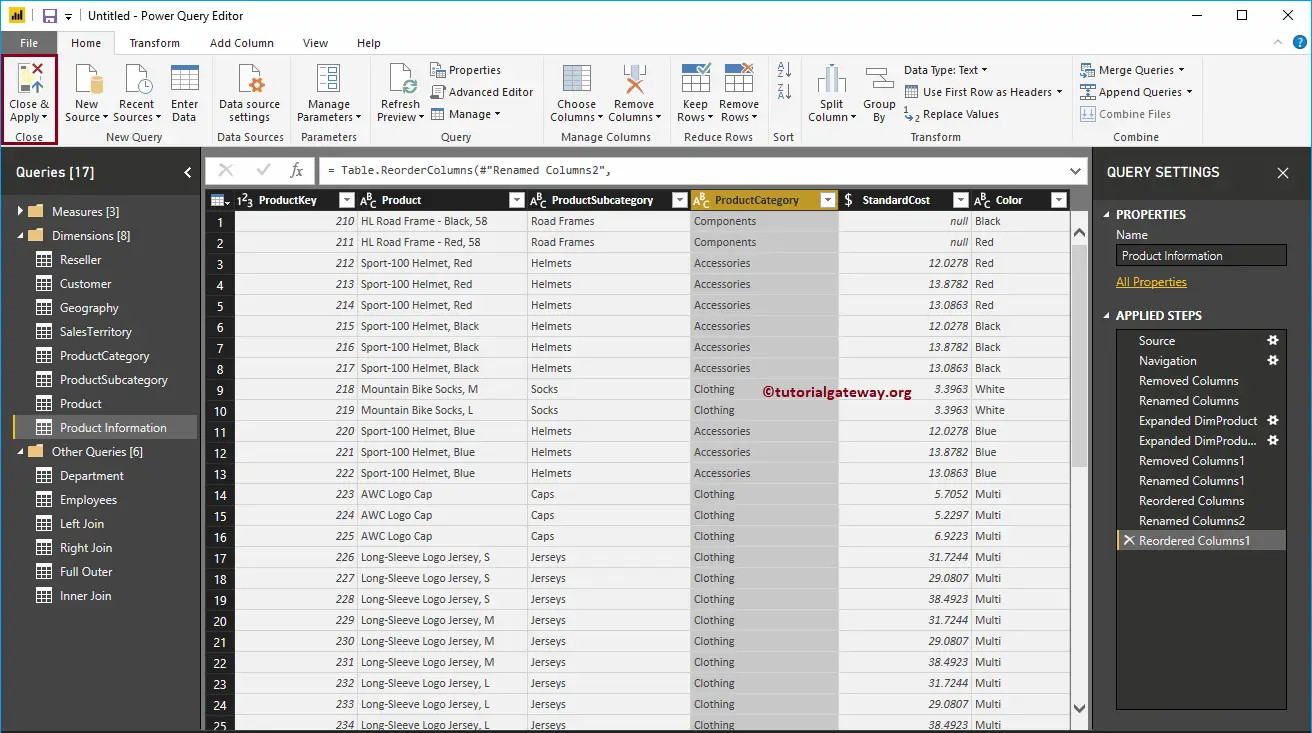
Let me rename and rearrange columns, and hit Close & Apply option under the Home tab.
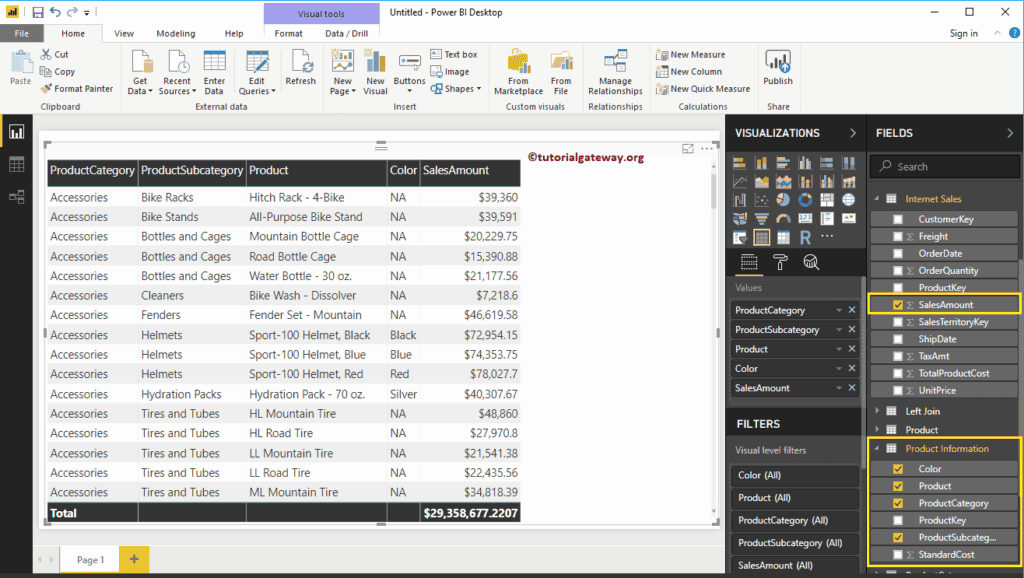
Let me create a table with this newly created table. As you can see from the screenshot below, we also formatted the Table as well.
NOTE: I suggest you refer to Create a Table, and Format a Table articles to understand the table creation and formatting options.
Power BI Clusters
In this section, we show you how to create Power BI clusters with an example. To explain this Clusters concept, we are going to use the Scatter Chart that we created earlier.
For this Power BI clusters demonstration, we are going to use the SQL Data Source that we created in Connect to SQL Server article and Scatter Chart.
Create Power BI Clusters
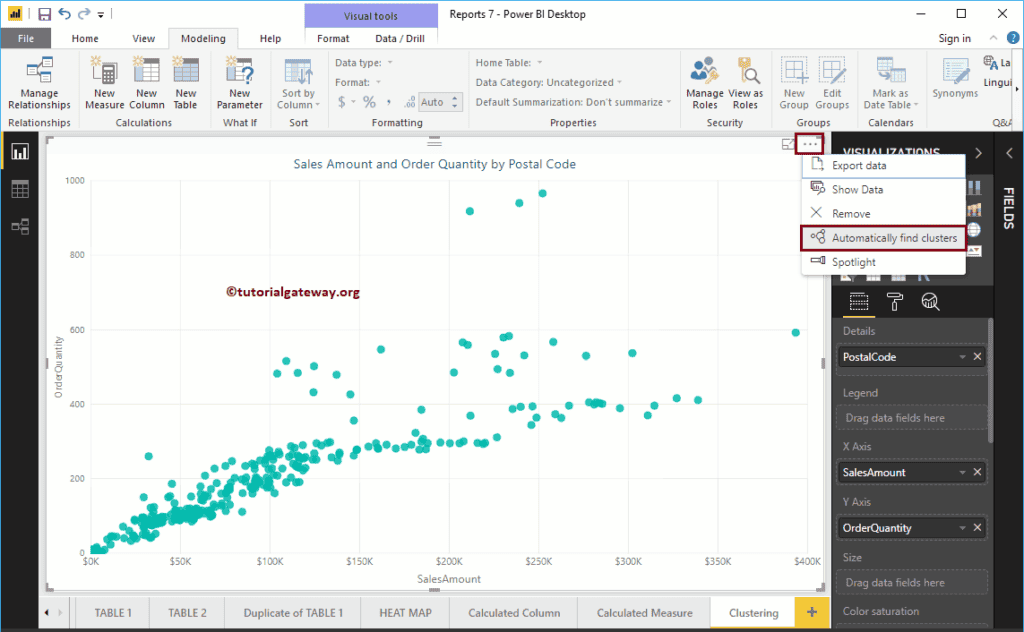
Please click on the … (3 dots) on the top right corner of the chart to see the Clusters option. As you can see from the Power BI screenshot below, we selected the Automatically find Clusters option from the menu.
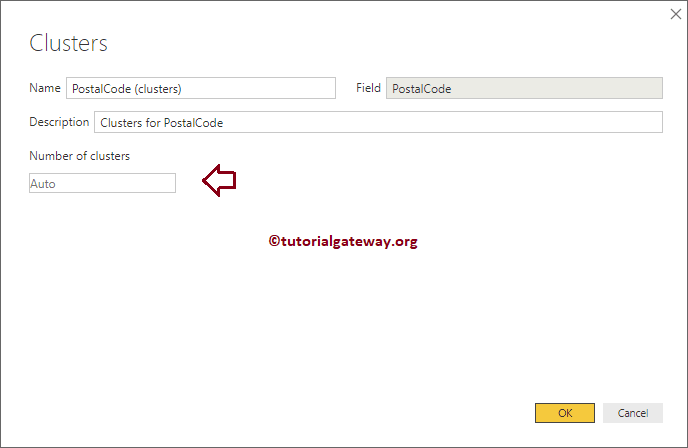
Clicking the Automatically find Clusters option opens the following Clusters window
- Name: Use this text box to rename the default generated clustered name
- Field: Field or Column that you used for Clustering
- Description: Write a meaningful description that describes this cluster.
- Number of Clusters: By default, Auto is selected. However, you can specify any integer value
For this Power BI cluster demo, we are leaving all the default values. So, let me click the OK button
An auto option has generated three clusters
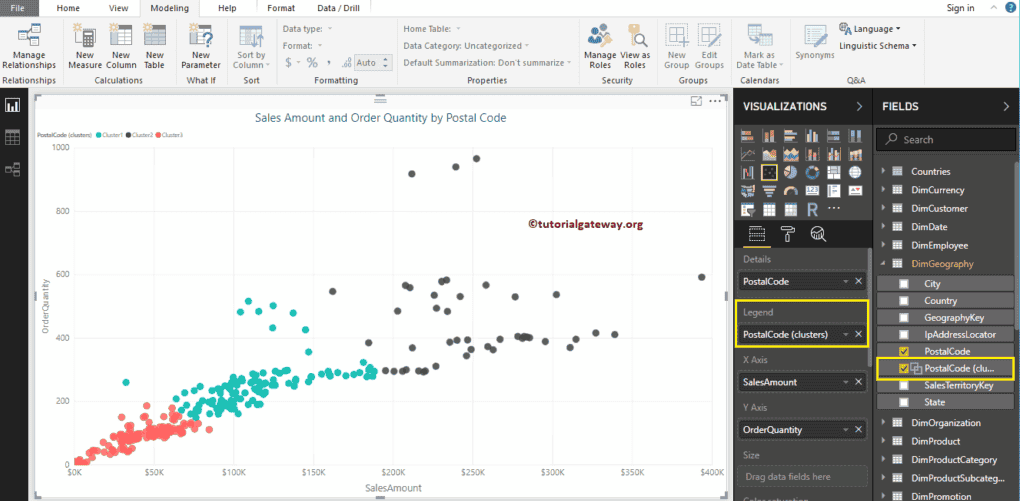
Edit Power BI Clusters
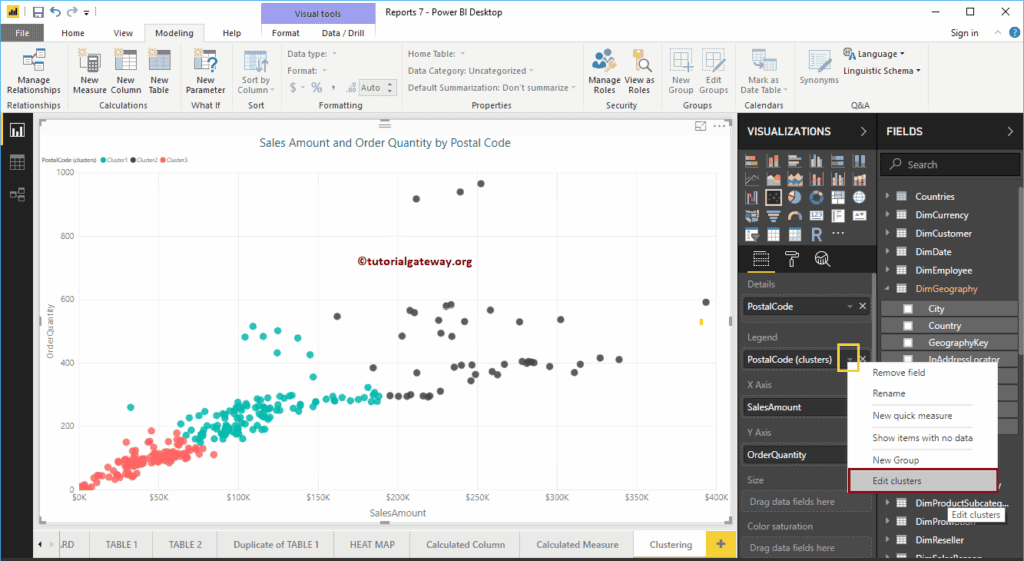
You can edit the cluster in two ways. Under the Visualization tab, click the down arrow beside the Cluster, and select the Edit Cluster option from the menu.
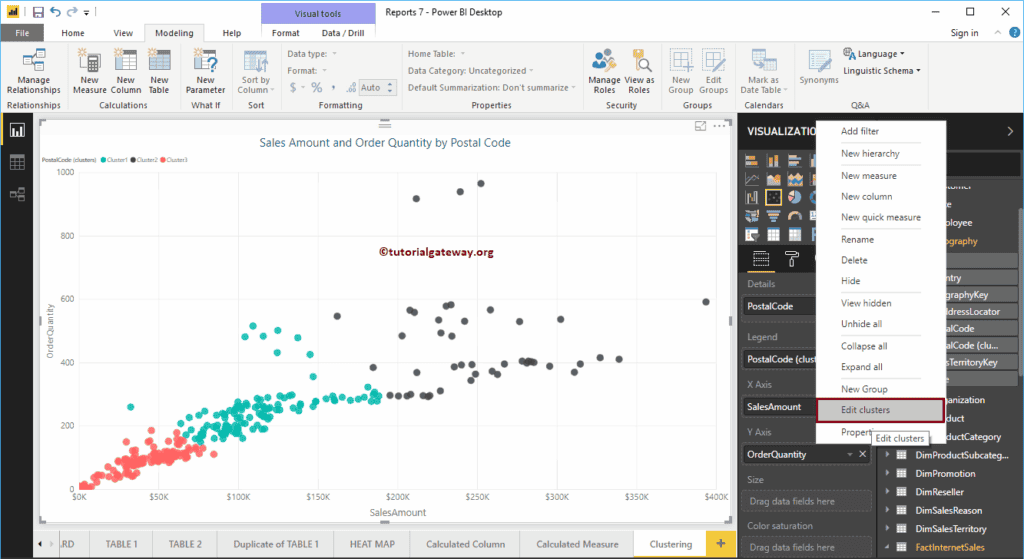
Or, please select the Cluster that you want to edit, and right-click on it opens the context menu. Please select the Edit clusters option from it
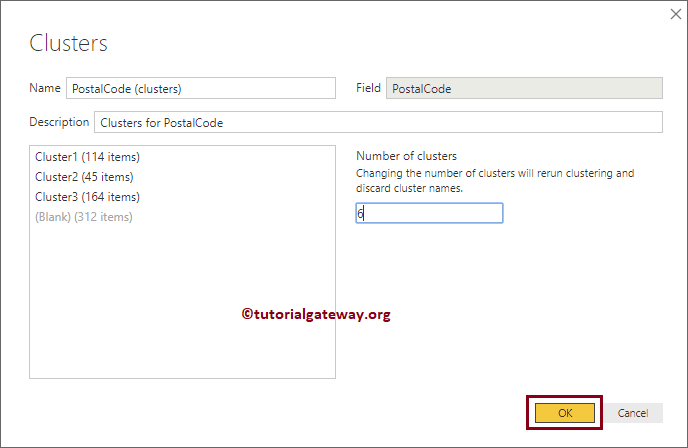
Clicking the Edit clusters option opens the following window. Use this window to change as per your requirement.
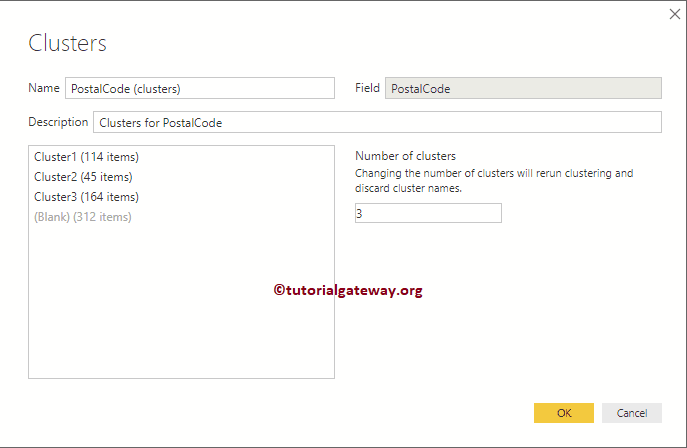
Let me change the default three to six
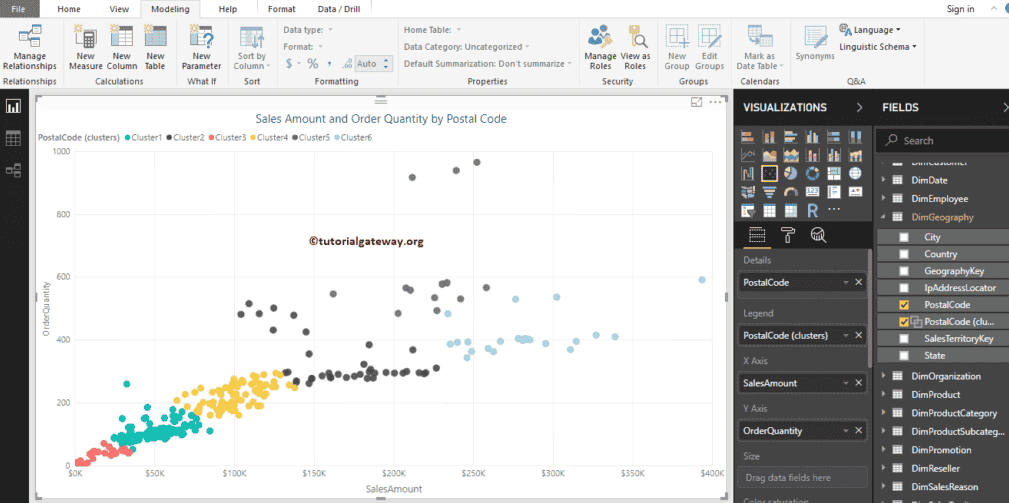
Now you can see, it has generated six different clusters
Delete Power BI Clusters
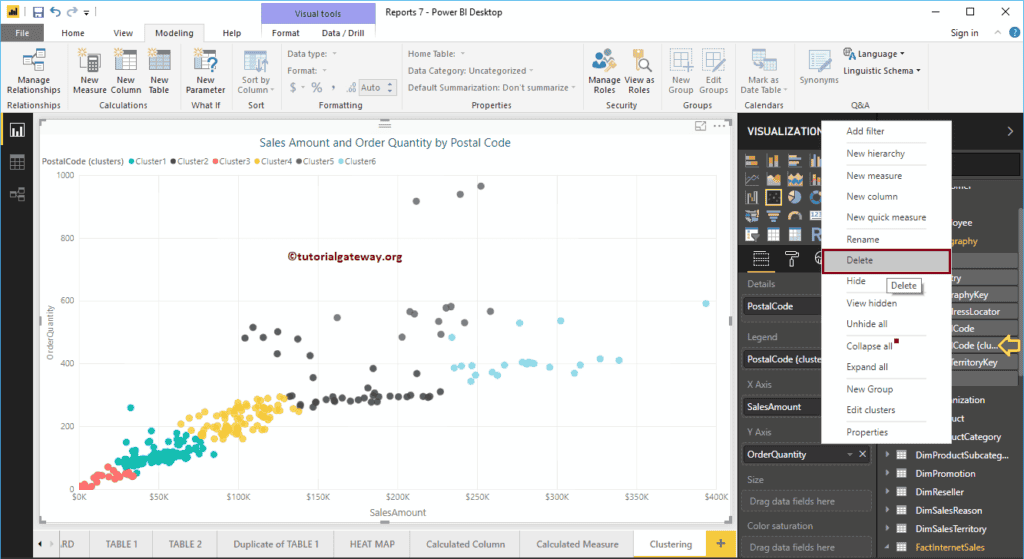
Please select the Cluster that you want to delete. Next, right-click on it and select Delete option from the context menu.
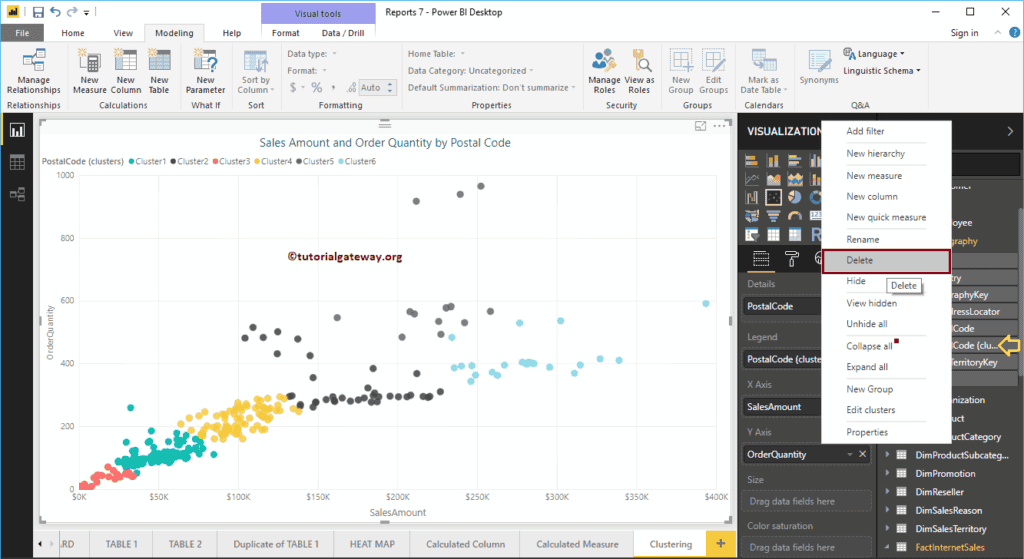
Confirm Delete
Create Manual Power BI Clusters
It is the same as the first example, but this time we are changing the Number of Clusters value from Auto to 5.
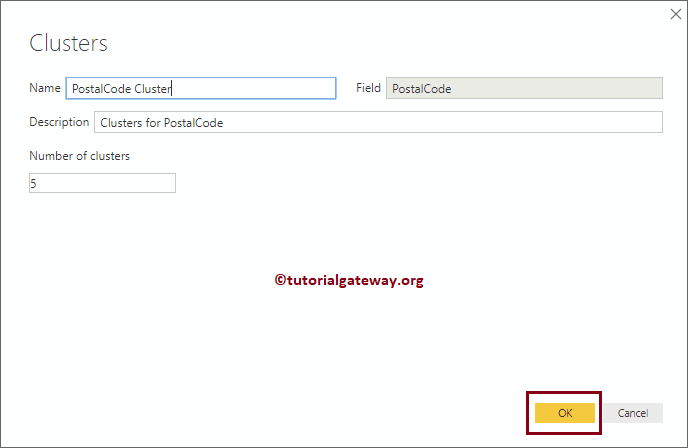
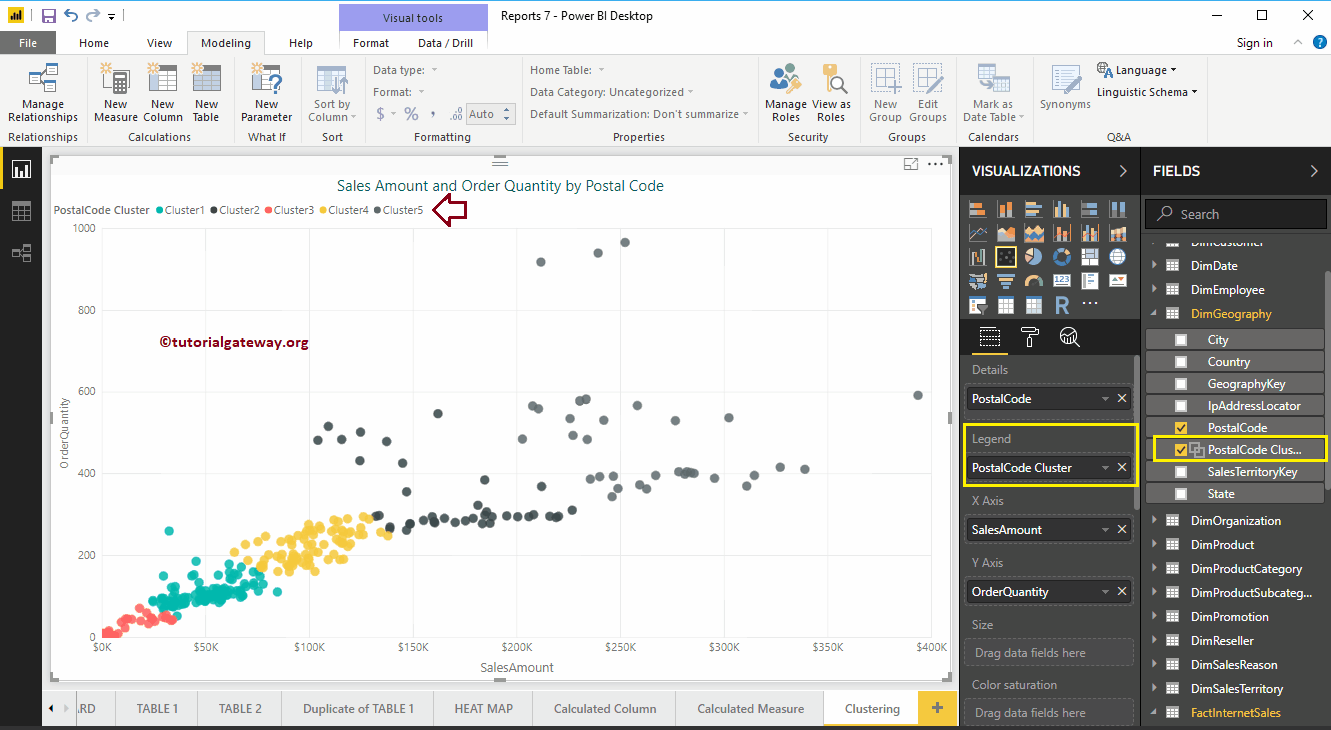
and you can see the 5 clusters
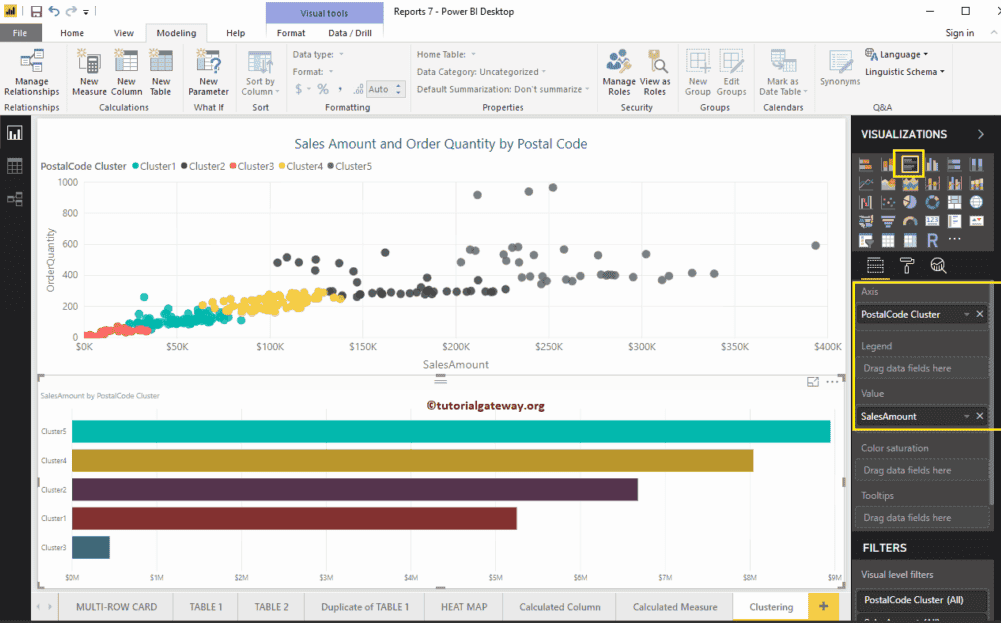
Let me use this cluster on another (different) report. For this, we created a Bar Chart using Postal Code Cluster (newly created) and Sales Amount
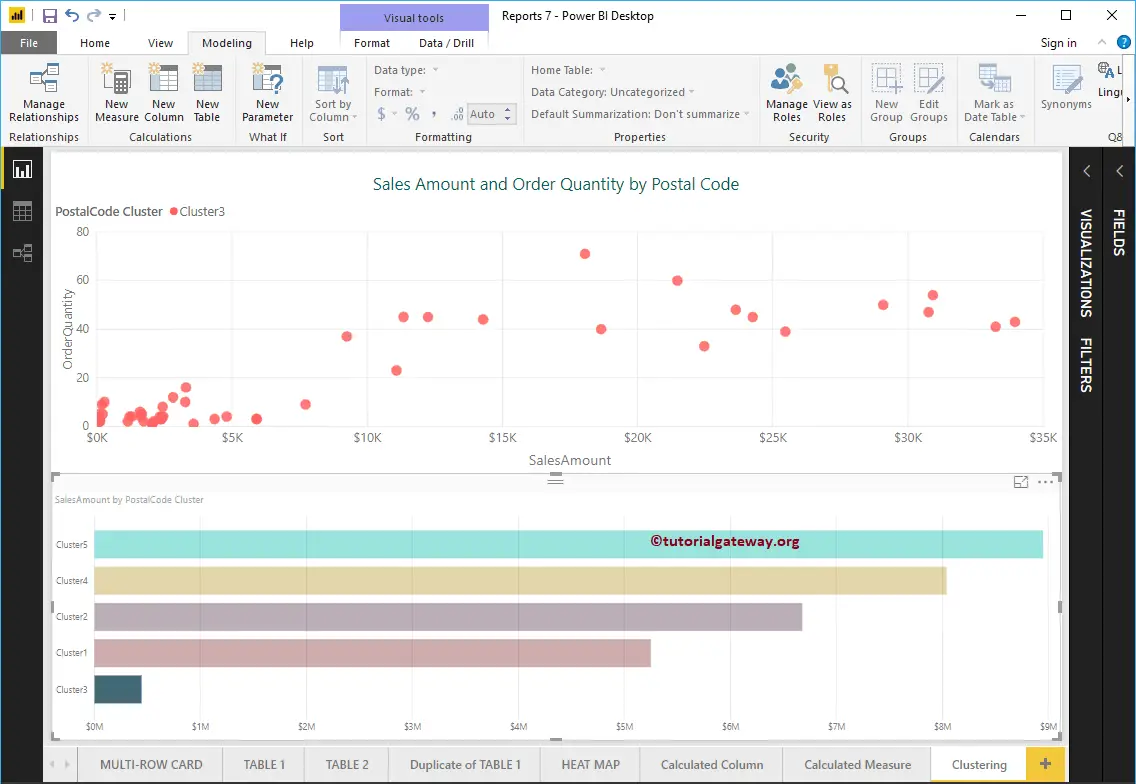
Like normal columns, you can also Filter Clusters
How to Enter Data into Power BI
Let me show you how to Enter Data into Power BI Desktop with an example. In real-time, you might face a situation like manually entering table data, or copying data from the text file to your power bi work environment. In these situations, you can use Power BI enter data option.
How to Enter Data into Power BI
To enter new data into the Power BI Desktop, please click Enter Data option under the Home tab.
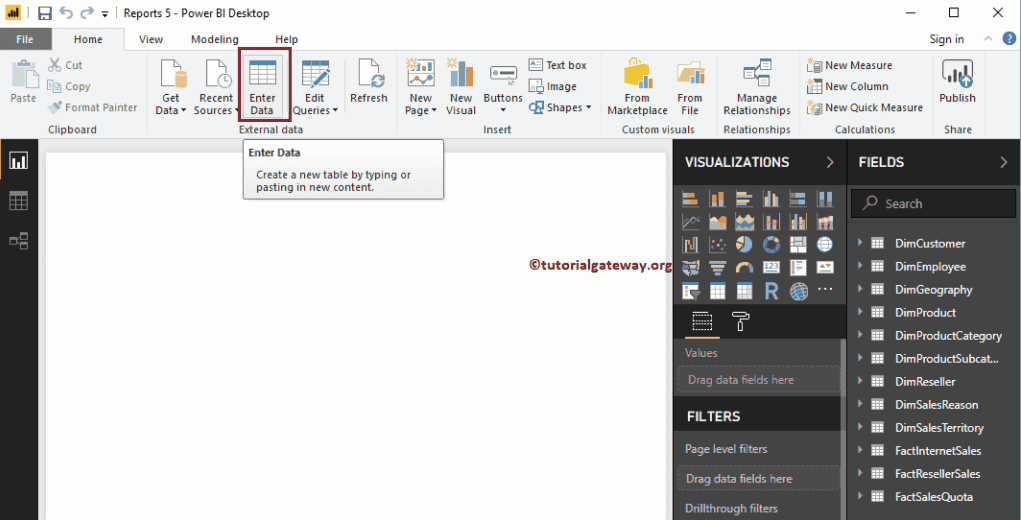
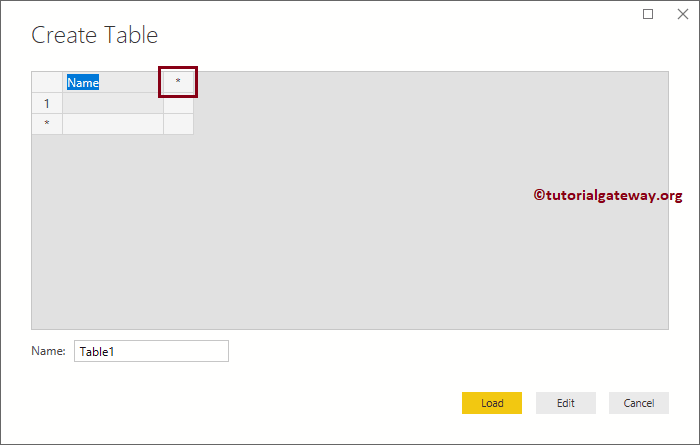
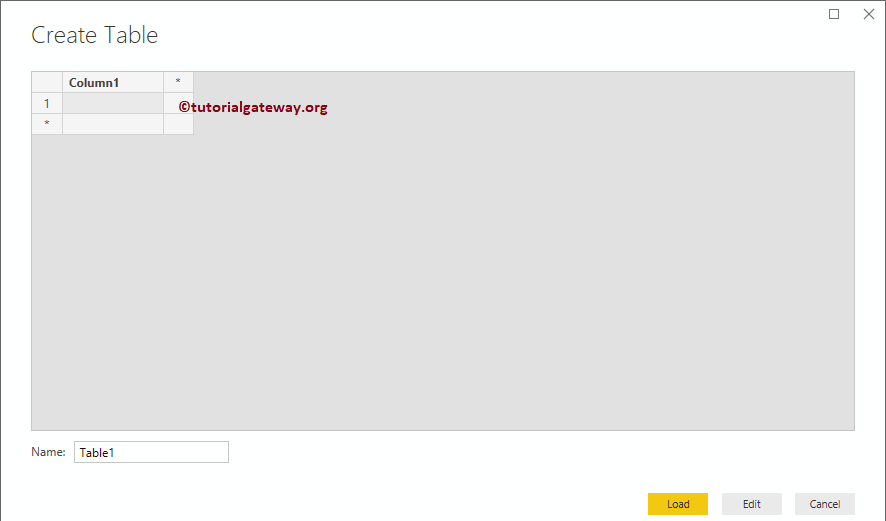
Clicking Enter Data option opens a new window called Create Table. Here, you can create new columns and add new rows.

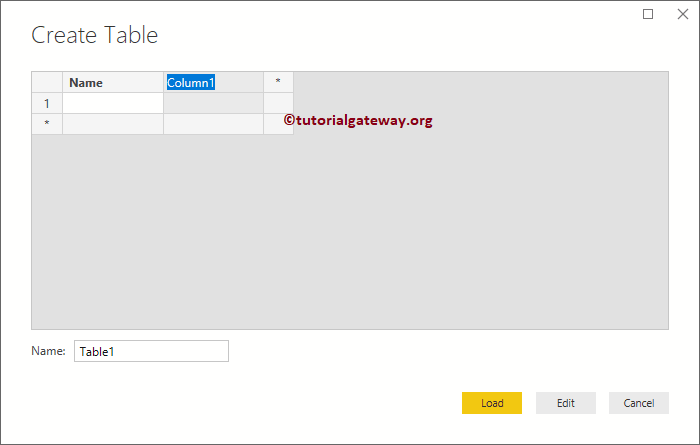
By clicking the Column1 area, allow you to add a new name. Let me change the Column 1 header as the Name. Next, click on the * to add a new column.
Now you can see the New column in Power BI.
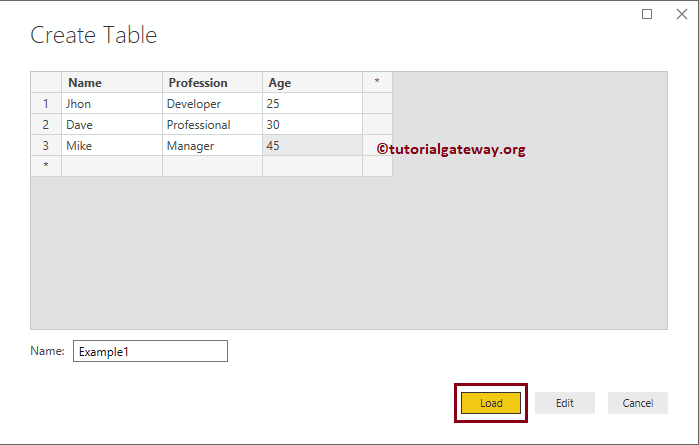
For the demonstration purpose, let me add a few rows
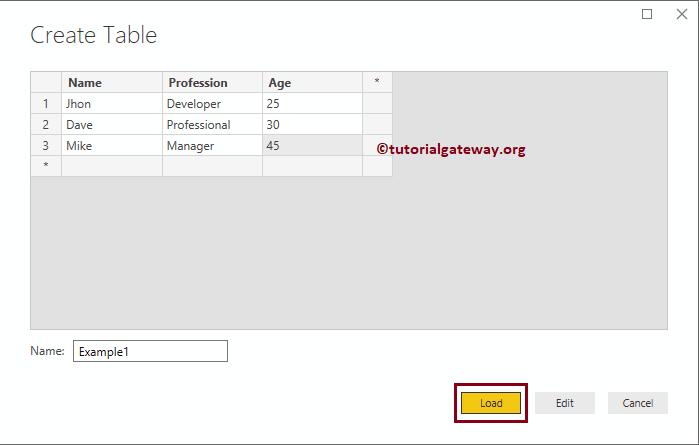
Use the Textbox beside the Name: filed to change the Table name. As you can see from the screenshot below, we changed the table name as Example 1.
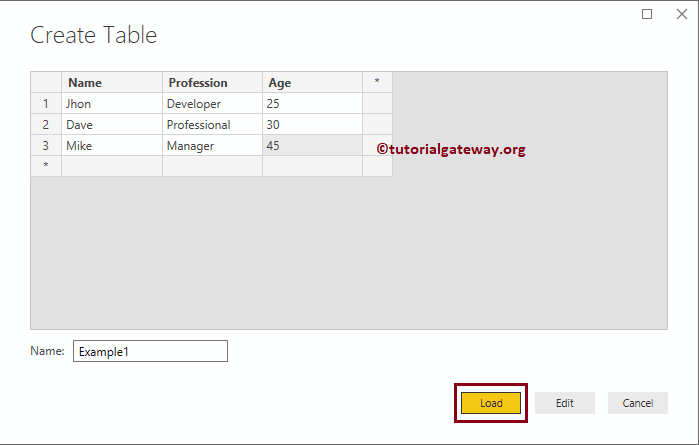
Next, click on the Load button to load this table into Power Bi desktop. You can also click the Edit button to edit these fields.
Please wait until the Load completed.
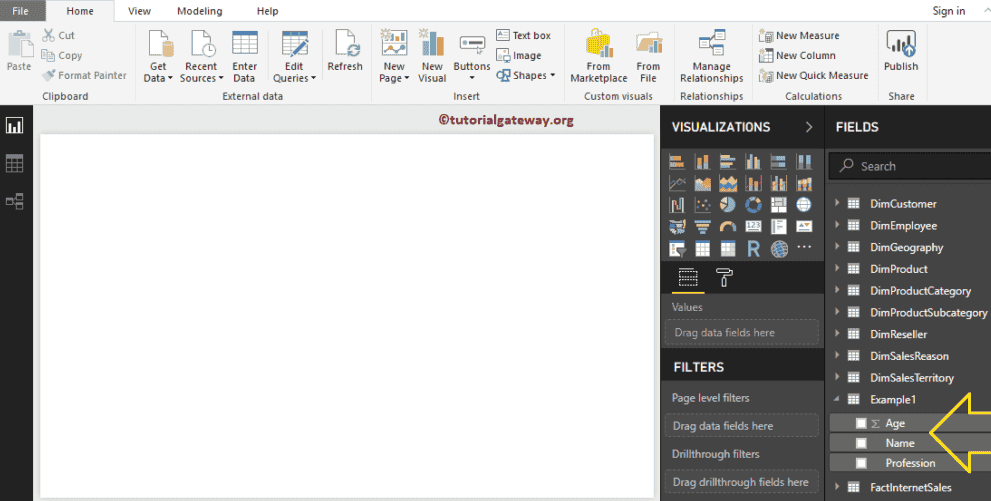
Now you can see the New table
Enter data from Excel file to Power BI Desktop
In this example, we explain the steps to paste the data from Excel file to Power BI desktop. First, let me open the Create Table window by clicking the Enter data button
Let me copy the data present in the Excel file
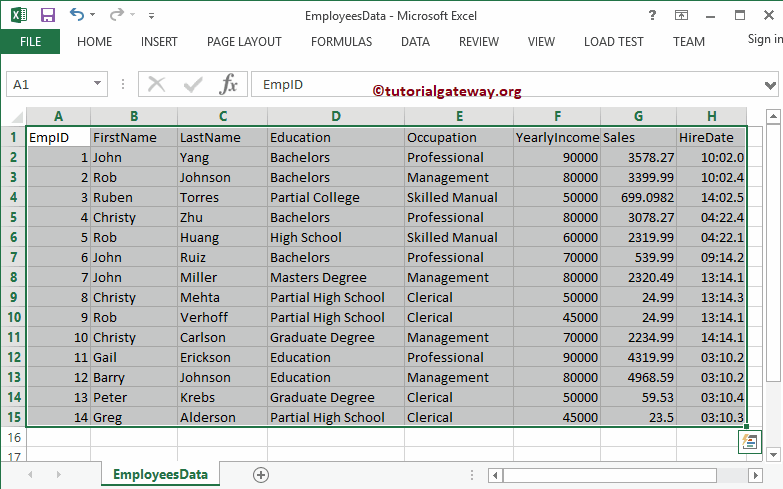
And paste it in the Create table window (Control + C and Control + V). Remember, Power BI automatically detects the column headers.
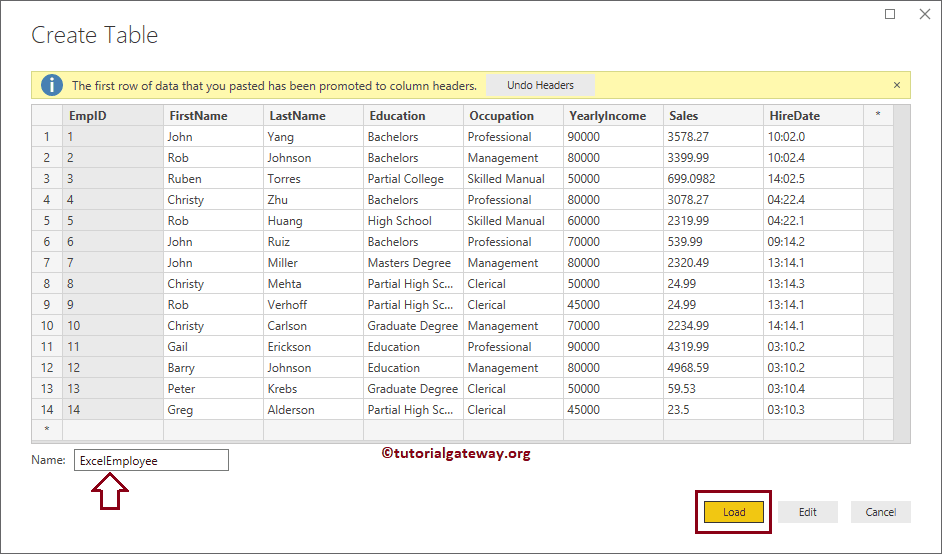
Let me rename the table as ExcelEmployee and click the Load button
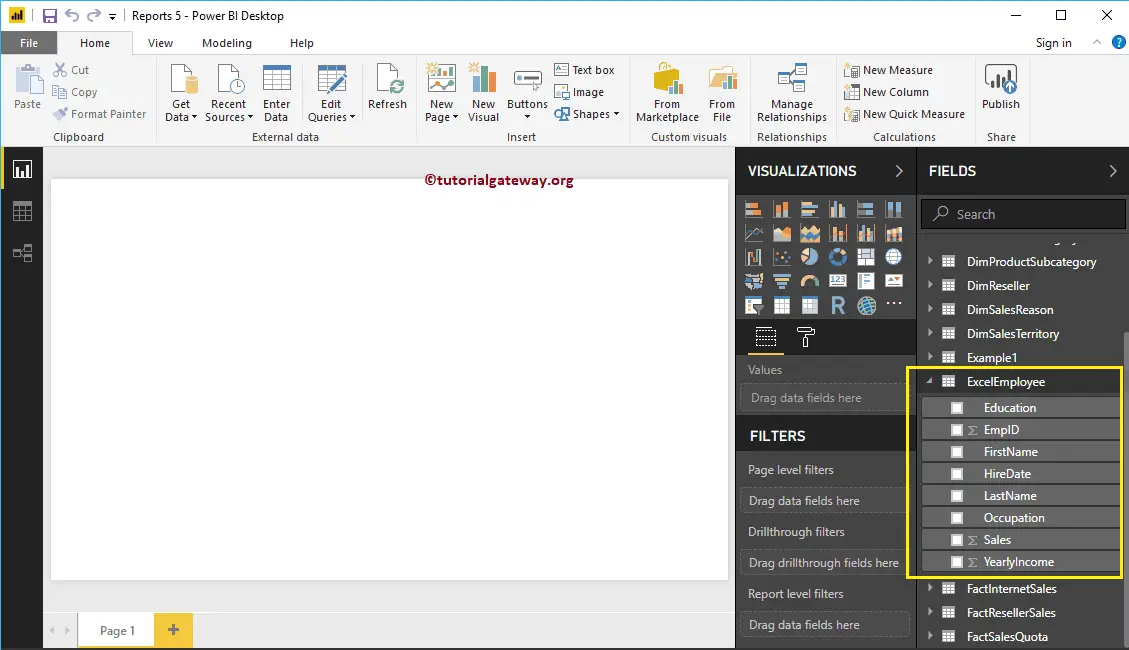
Now you can see the table
Enter data from SQL table to Power BI Desktop
First, let me copy the data present in the SQL table
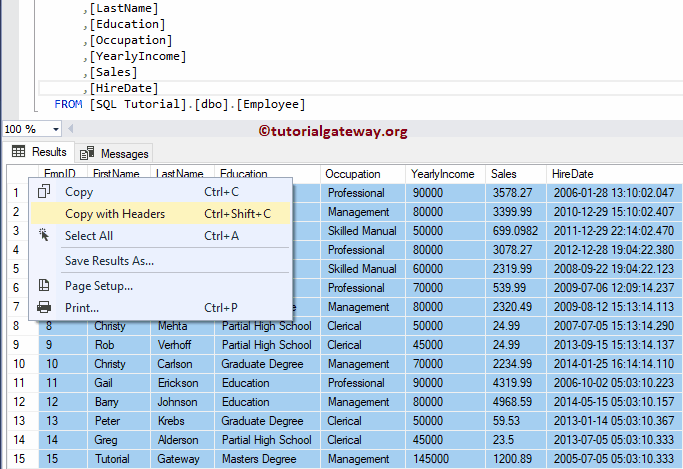
and paste it in the create table window
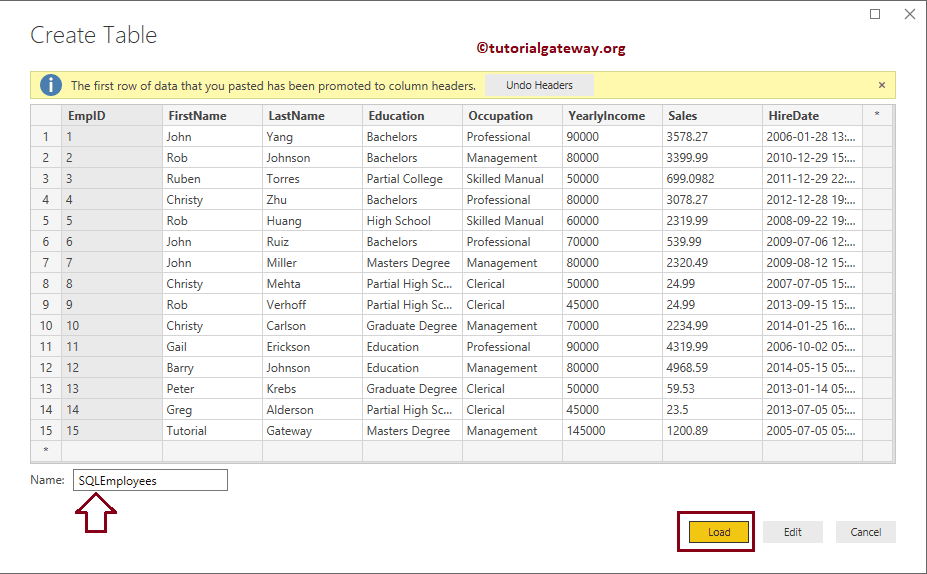
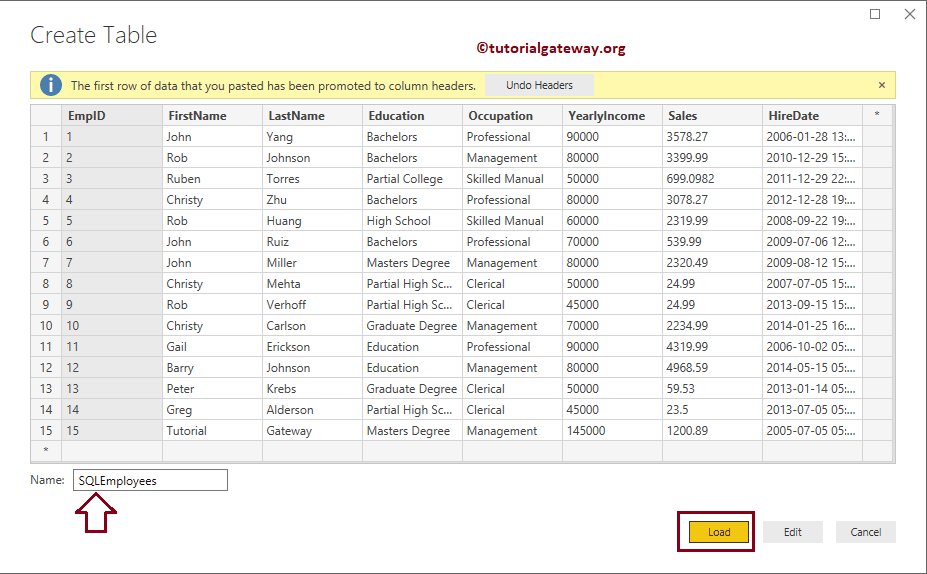
Please rename the table name as per your requirement, and hit the Load button
Now you can see the table
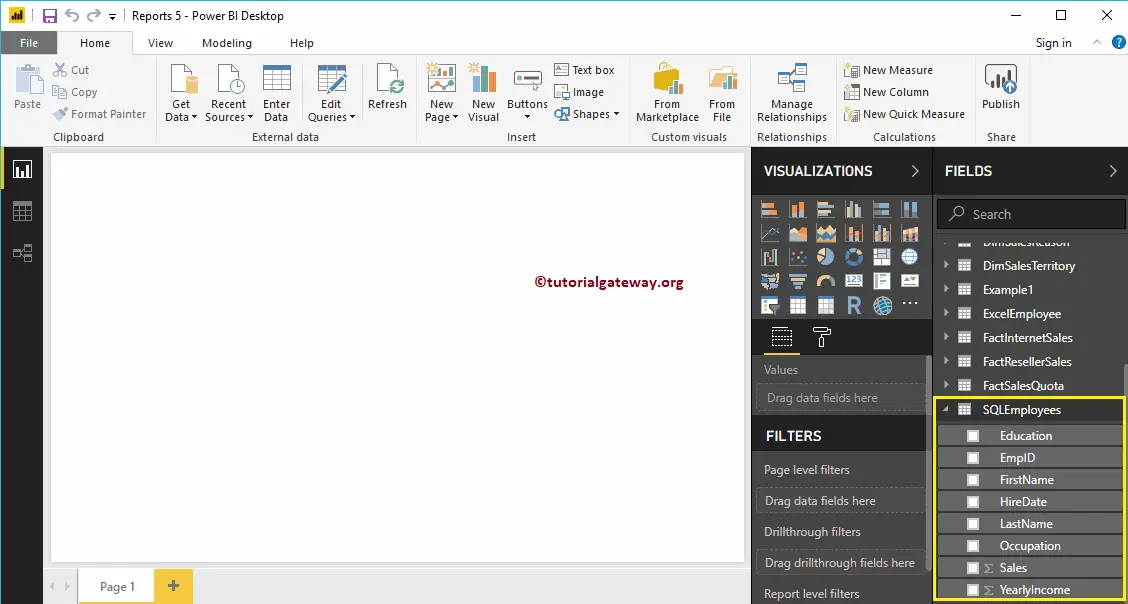
Enter data from Text file to Power BI Desktop
First, let me open the text file. As you can see, the file not formatted properly. Let me copy the content in this text file.
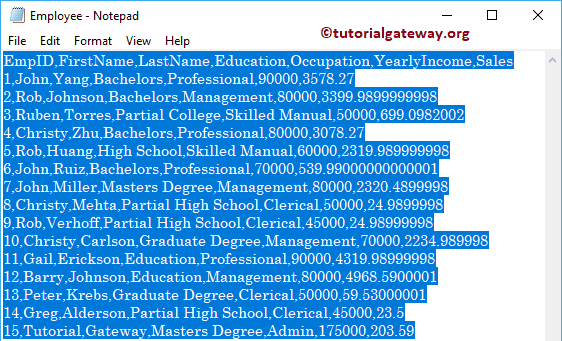
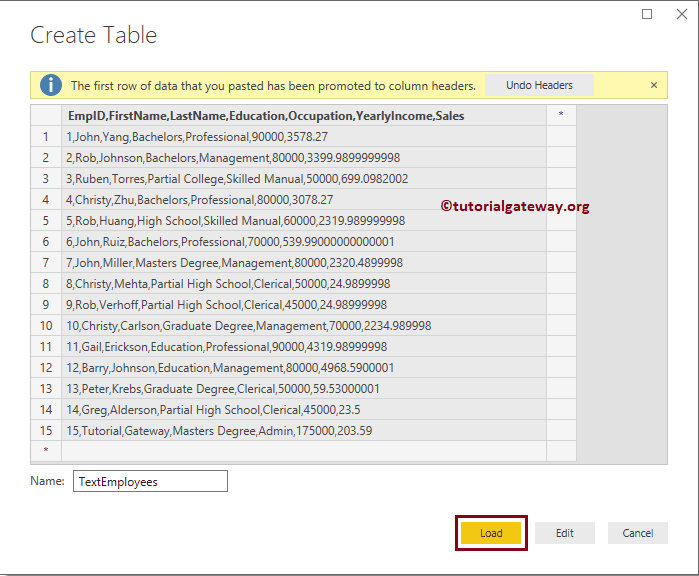
Next, we pasted it in the create table window. You can see from the screenshot below, all the information stored in one column.
We can edit them by hitting the Edit button, but we will write a separate article to explain those techniques. Therefore, for now, we renamed the table name and loaded the table into the desktop.
How to Format Dates in Power BI
How to Format Dates in Power BI with an example?. Using these formatting Date options, you can extract Year, Month, Day, Day Number, Day name, Month Start and End, etc.
How to Format Dates in Power BI
To demonstrate these Power BI date formats, we are going to use the SQL table that we imported in Enter Data article.
To format dates in any table, please click the Edit Queries option under the Home tab.
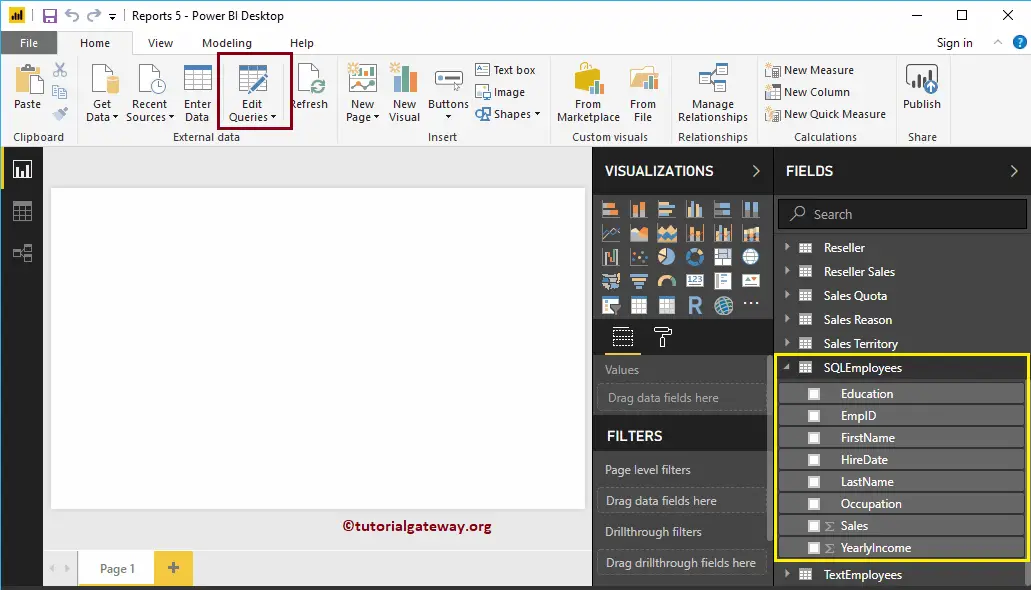
Clicking the Edit Queries option opens a new window called Power Query Editor.
From the screenshot below, you can see the HireDate column. To demonstrate the Power BI date formatting options, we are going to use this column.
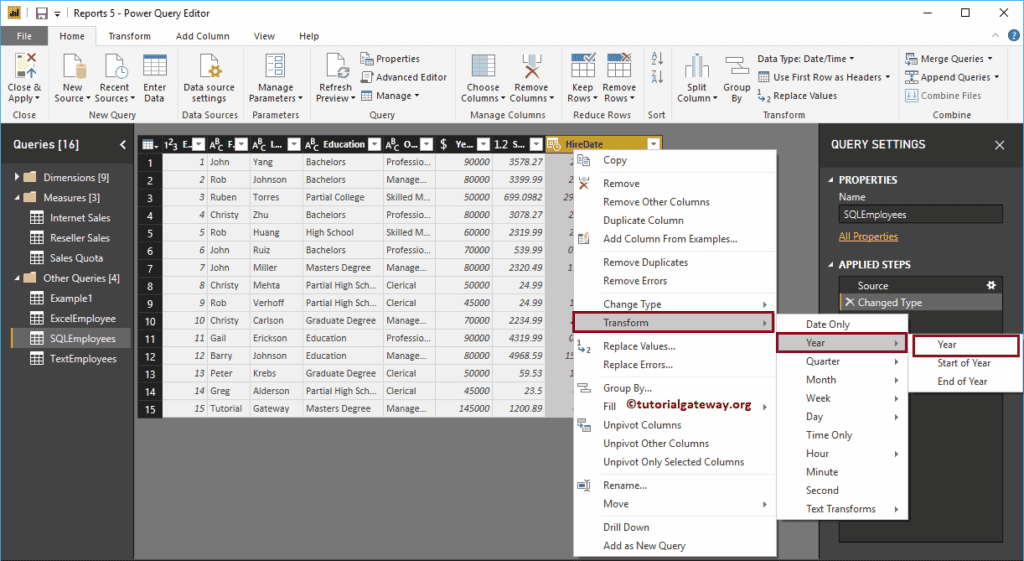
There are a couple of ways to format dates in power bi
The first approach to Format Dates in Power BI
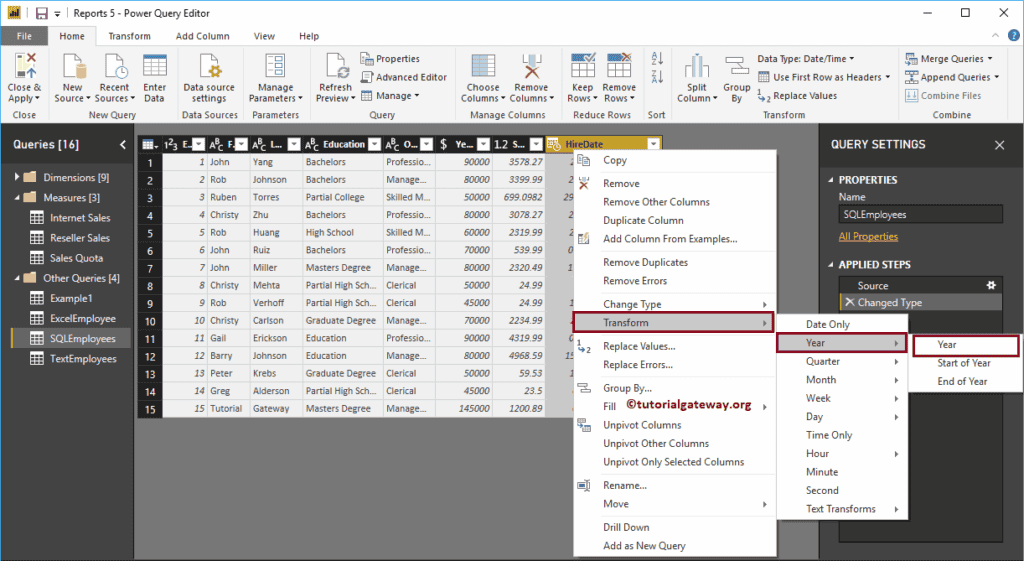
Please select the Date Column, and right-click on it open the context menu. Select the Transform option and select the formatting option. For now, we are selecting the Year. It means this property extract and displays the Years from Hire date.
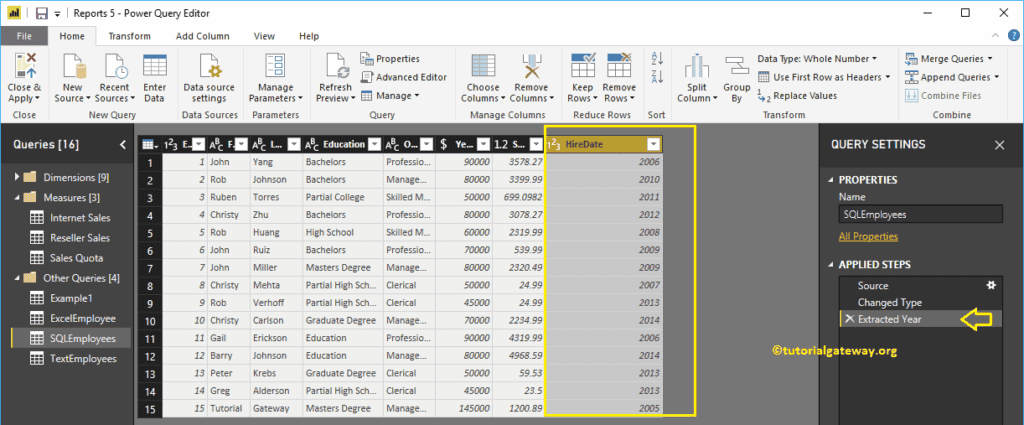
From the screenshot below, you can see the date and Time in the Hire date column replaced by the Extracted Year.
The second approach to Format Dates in Power BI
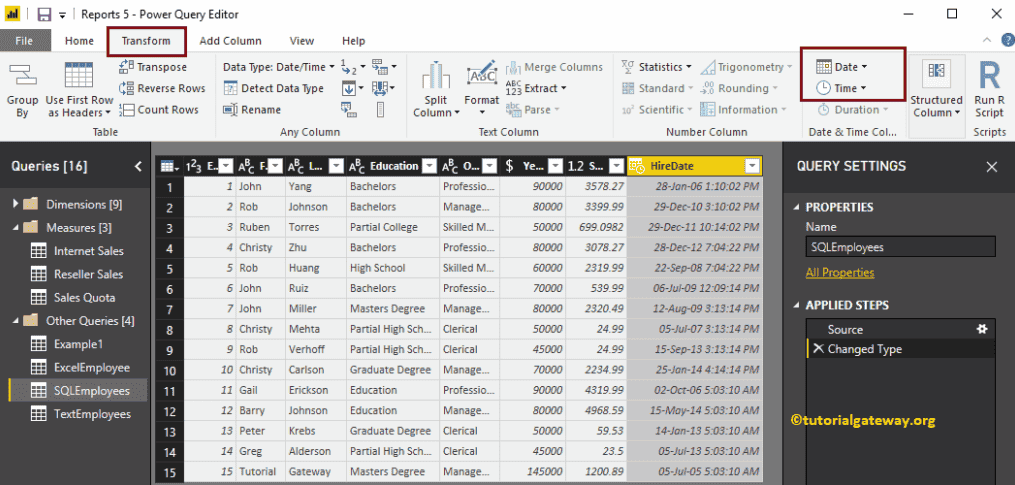
First, go to Transform Tab. Under this tab, you can see the Date and Time options. You can use these drop-down lists to format the dates.
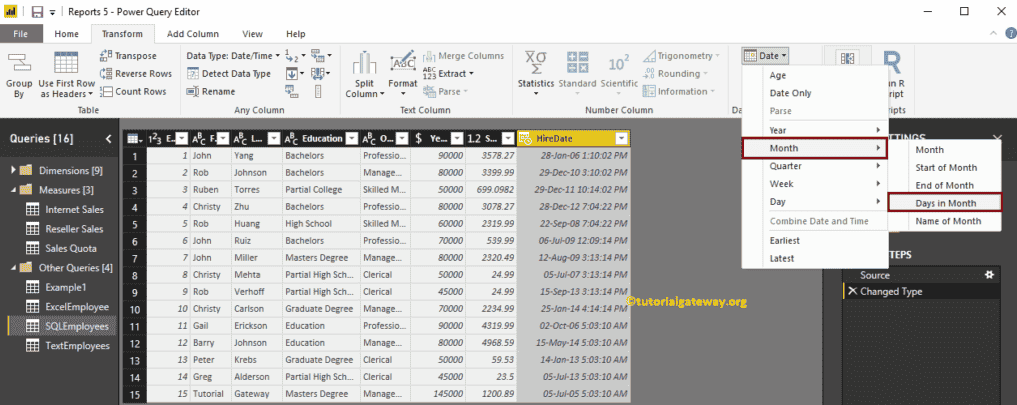
Clicking the down arrow beside the Date show you the drop-down list of available date formats. For the demo purpose, we are selecting Days in Month.
From the below screenshot, you can see the date and Time in the Hire date column replaced by the total number of days in a month.
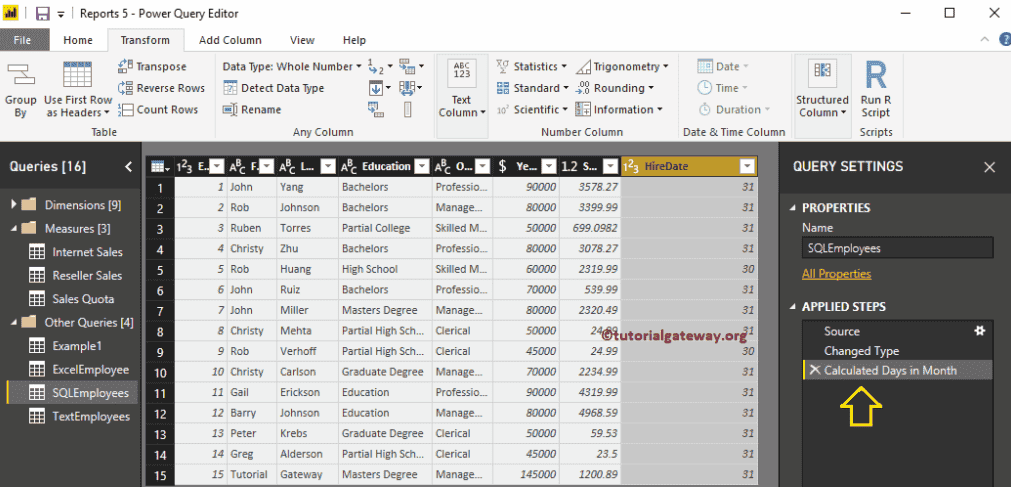
The third approach to Format Dates in Power BI
The above-specified approaches are replacing the existing column with the formatted date. But, this approach adds an extra column for the formatted date.
First, go to Add Column Tab. Under this tab, you can see the Date, Time, and Duration options. You can use these drop-down lists to format the date and Time.
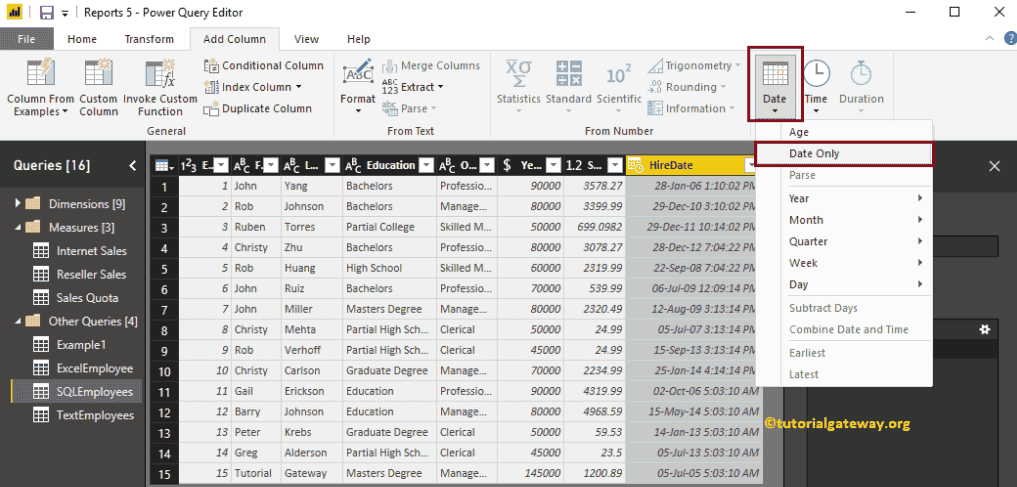
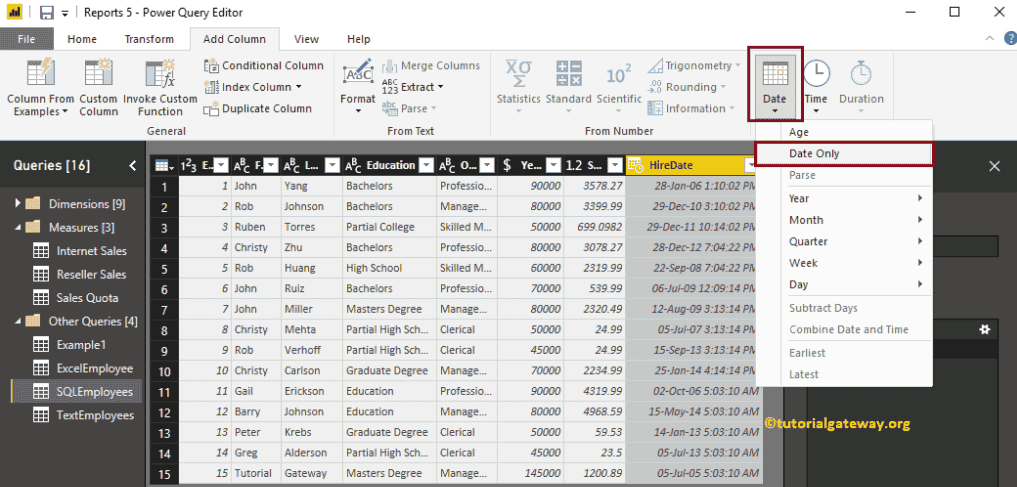
Let me select Date Only option in Power BI.
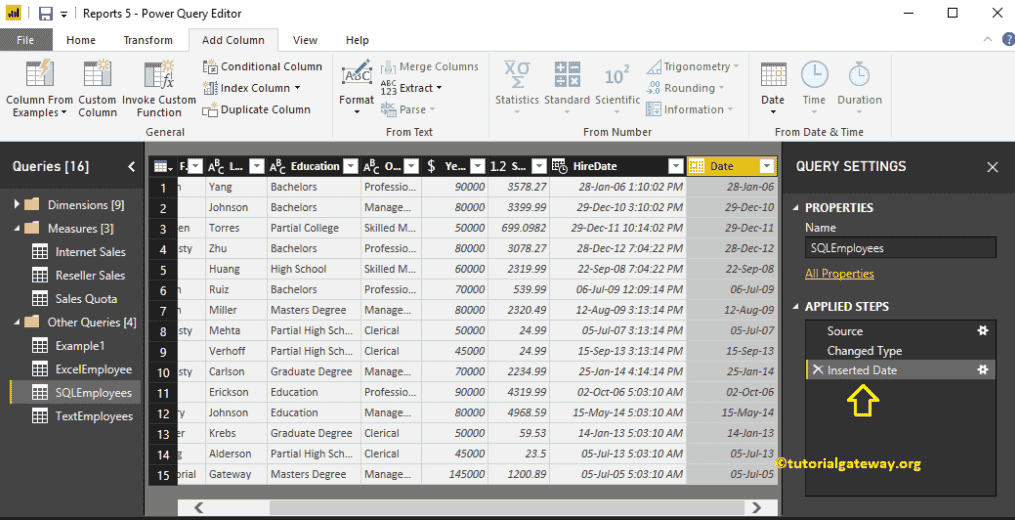
Now you can see the new column (extra column) displaying the date from the Hire date
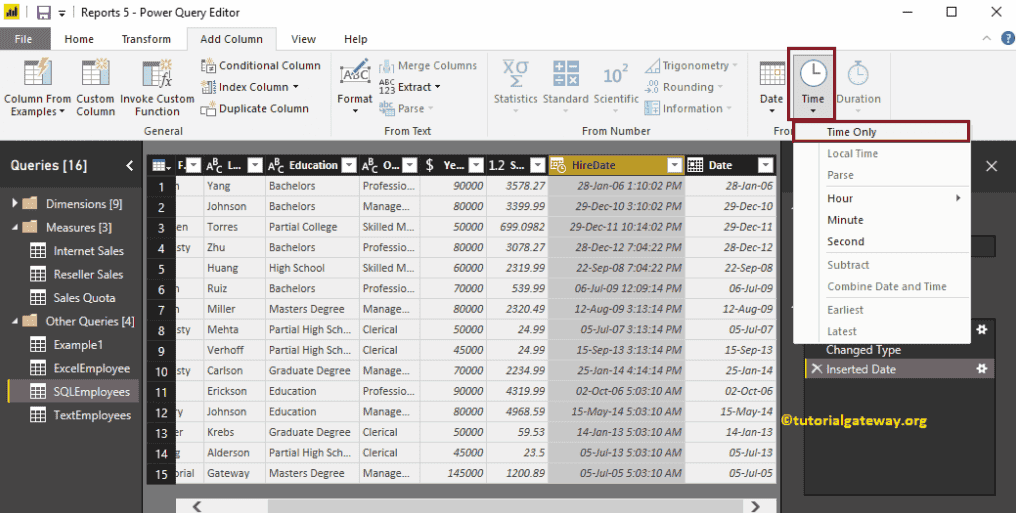
Let me Select Time Only
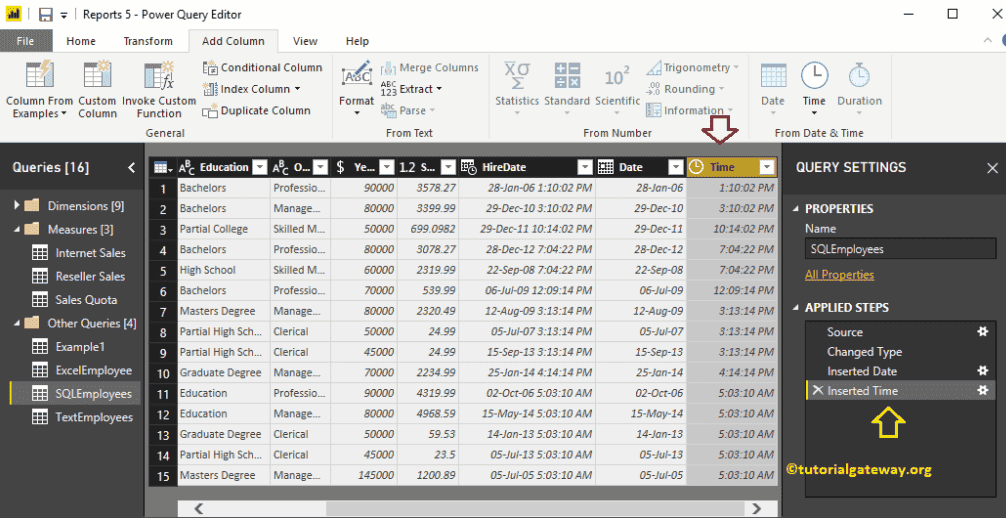
Now you can see the new column displaying the Time from Hire date
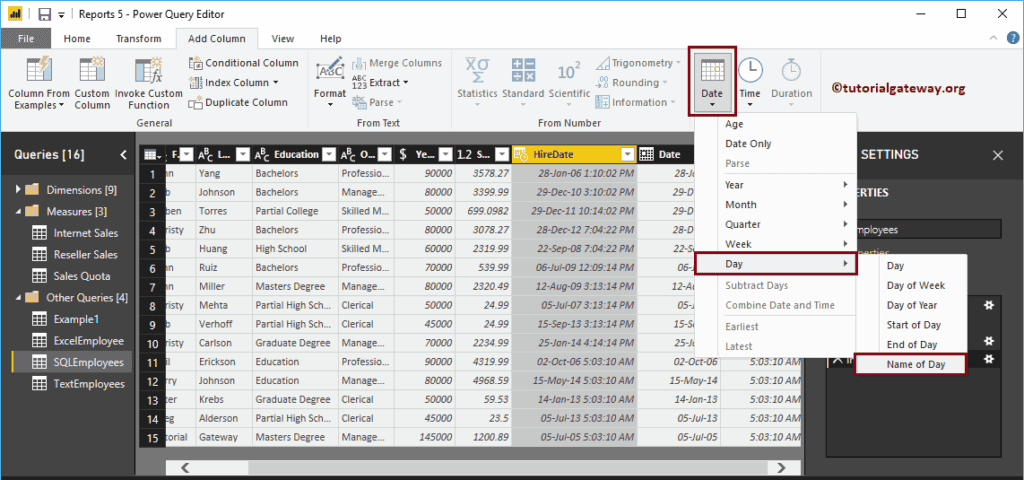
Let me select the name of the day
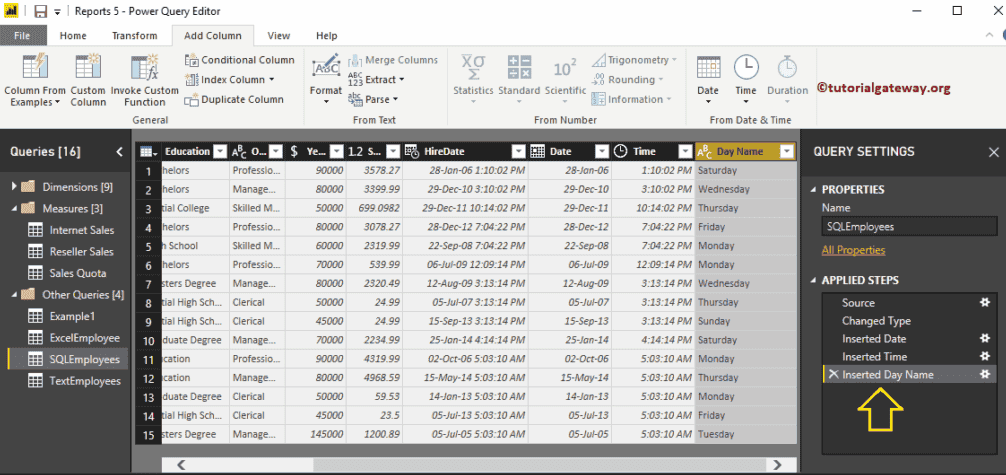
Now you can see the extra column displaying the day name. Next, hit the Close & Apply option under the Home tab to apply these changes.
Please wait until the changed are applied
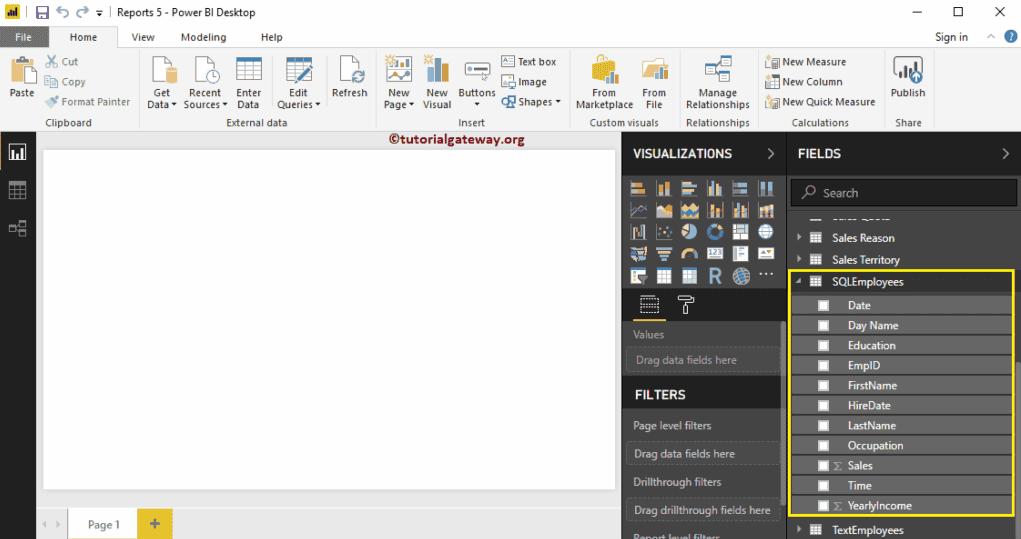
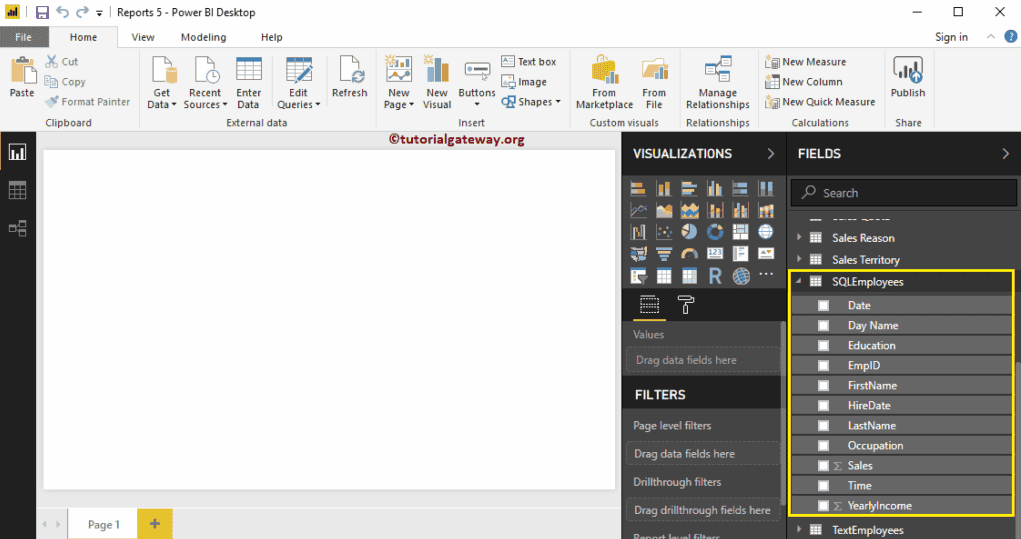
Now you can see the Date, Day Name, and Time columns under the SQL Employee table.
Create Groups in Power BI
Power BI Grouping is the process of combining or merging two or more values for further analysis. For example, When we are seeing products by category report, we may find very few records (unnoticeable products). Sometimes, it may be annoying to see all those underperforming products. In this situation, you can create a Power BI group by combining those records, and display it as one product.
In this article, we show you how to create groups in Power BI reports with an example. For this Power BI groups demonstration, we are going to use the SQL Data Source that we created in our previous article.
Please refer Connect to SQL Server article to understand the Power BI Data Source.
Create Groups in Power BI
To visually demonstrate this Power BI grouping technique, we will create a Pie chart. As you can see from the below screenshot, we created a Pie chart by dragging the Sales Amount column to Values field, and Color to Legend region.
NOTE: I suggest you to refer Create a Pie Chart, and Format Pie Chart article to understand the steps involved in creating, and formatting a pie chart.
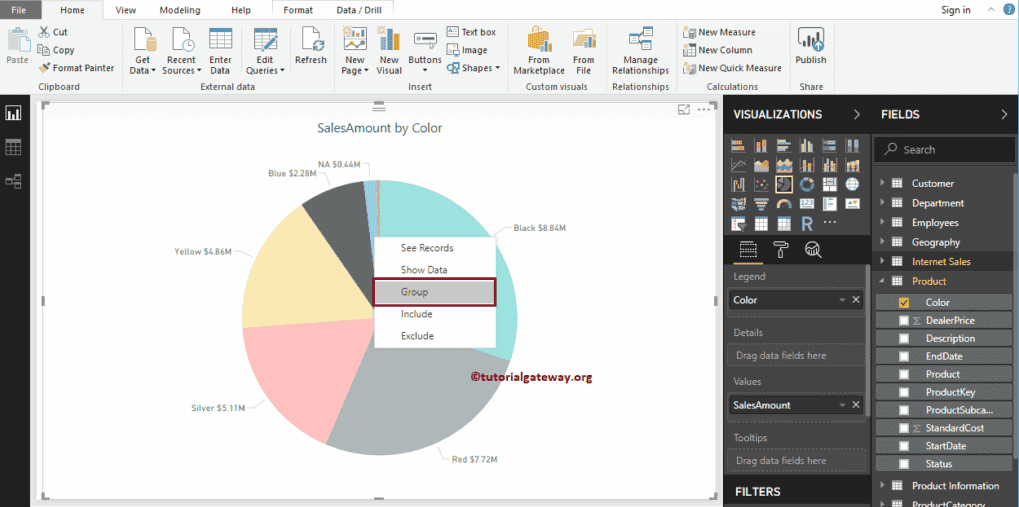
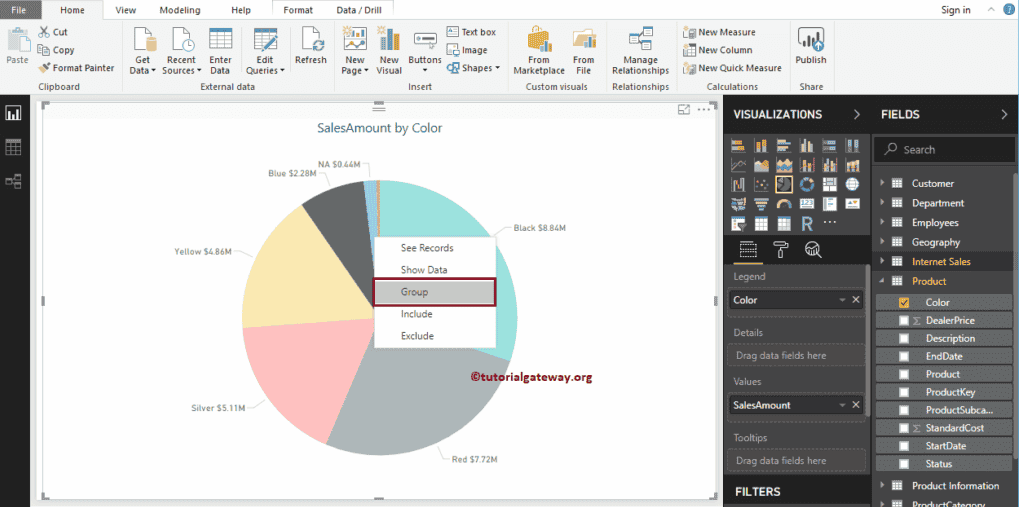
If you observe the below screenshot, Data that we highlighted such as Multi, NA, and Blue color products are not performing well. So, let us group them
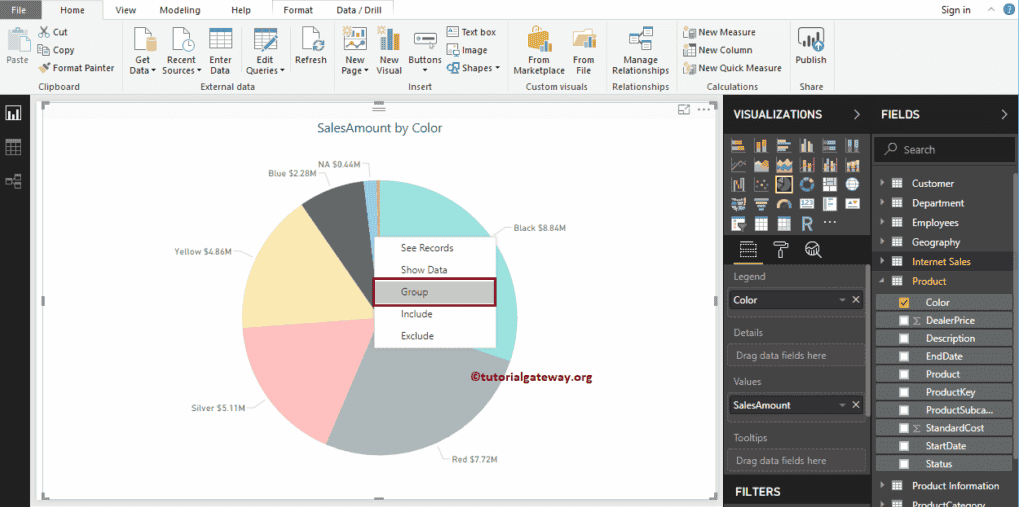
To perform grouping in Power BI, Please select the fields that you want to group, and right-click on it will open the context menu. Please select Group option from the menu.
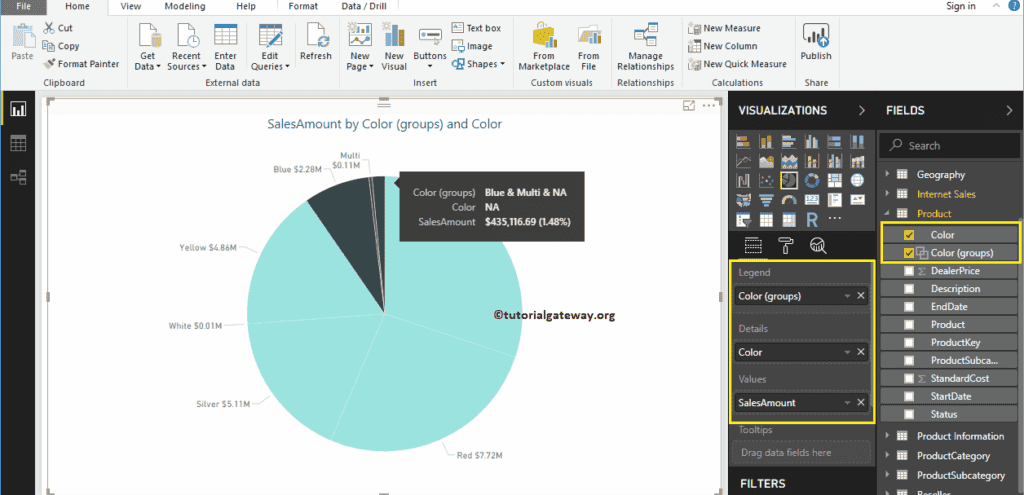
Once you Click on the Group option, Power BI will automatically group those items as shown below. That’s it, we did the grouping.
If you observe closely, Legend section is replaced by Color group, and the color is placed in the details section.
TIP: By default, Power BI Group option will group the selected items as one group and remaining options as another group.
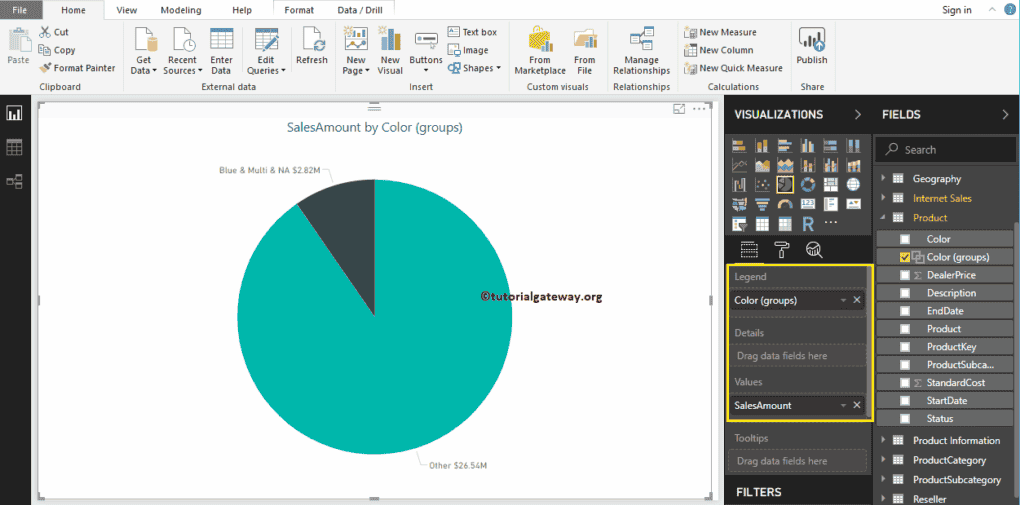
Let me remove the Color field from the Details section. Now you can see only two partitions in the Pie chart: one contains Blue, White and NA colours, and the second partition contains remaining colours.
Edit Power BI Group
Please select the group that you want to edit, and right-click on it will open the context menu. Select the Edit Groups option form it
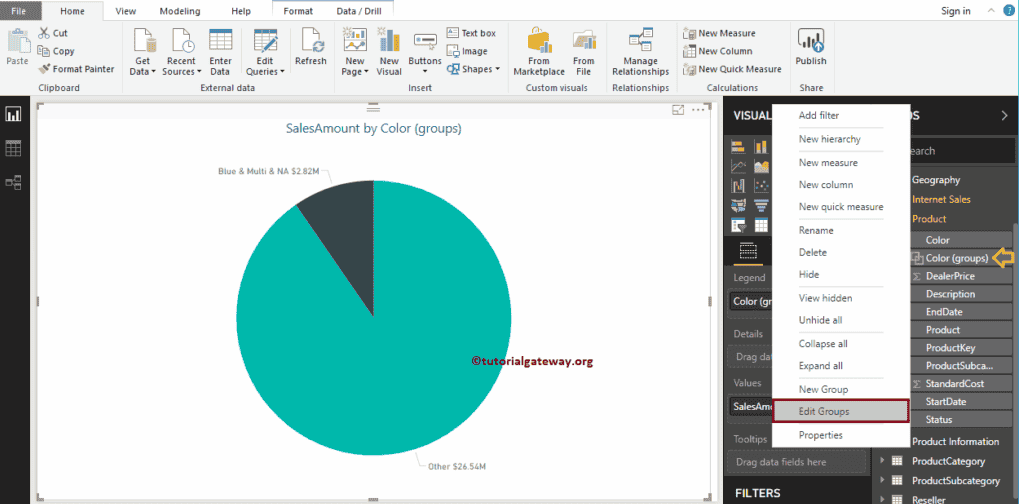
Clicking the Edit Groups option will open the following window.
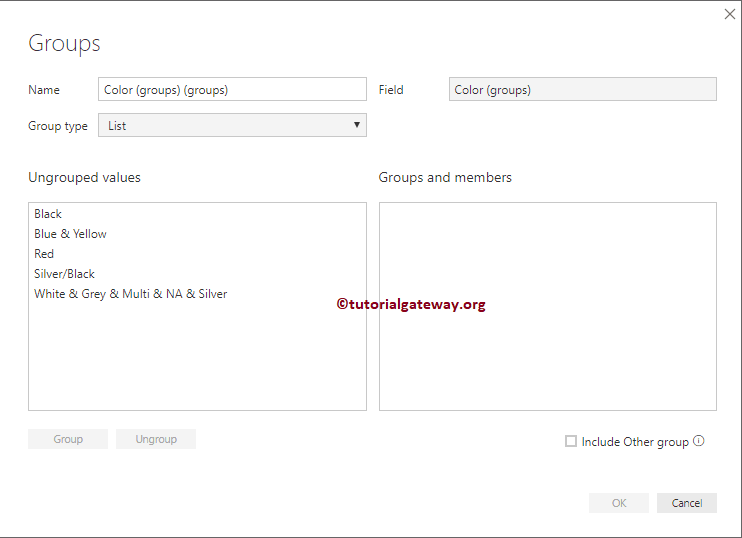
- Name: Specify the Group name
- Field: Field or Column that you used for grouping
- Group Type: List (group) or bin.
- Ungrouped values: Fields that are not grouped but available in this column.
- Groups and Members: List of groups, and their members.
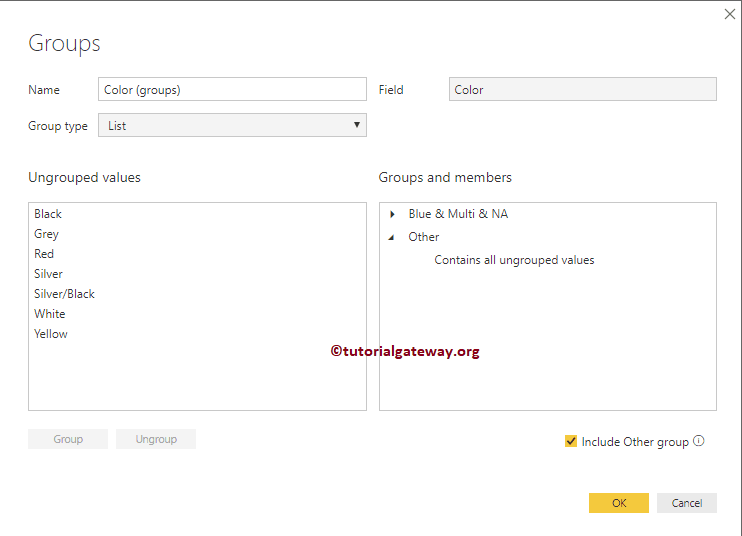
- Include Other Group: Do you want to place all the ungrouped members in the Other group. If so, checkmark this option.
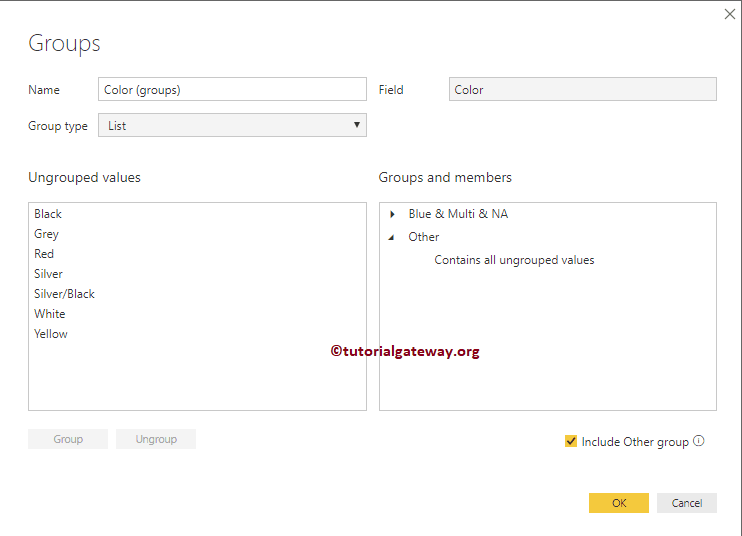
Let me uncheck the Include Other group. This will remove others group
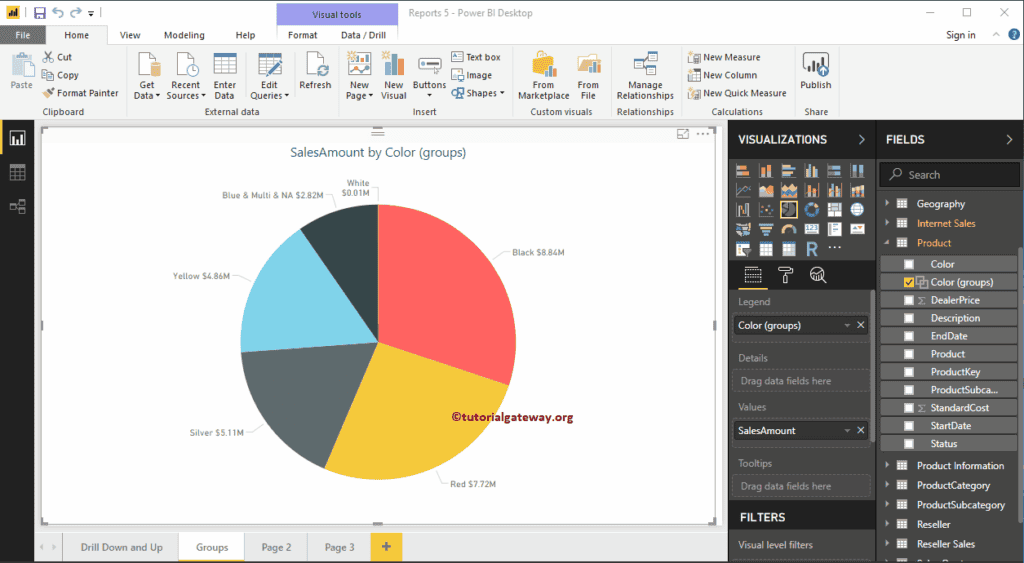
Now you can see the pie chart that is displaying all the colours, and one group that contains Blue, Multi and NA colours.
Remove Power BI Group Members
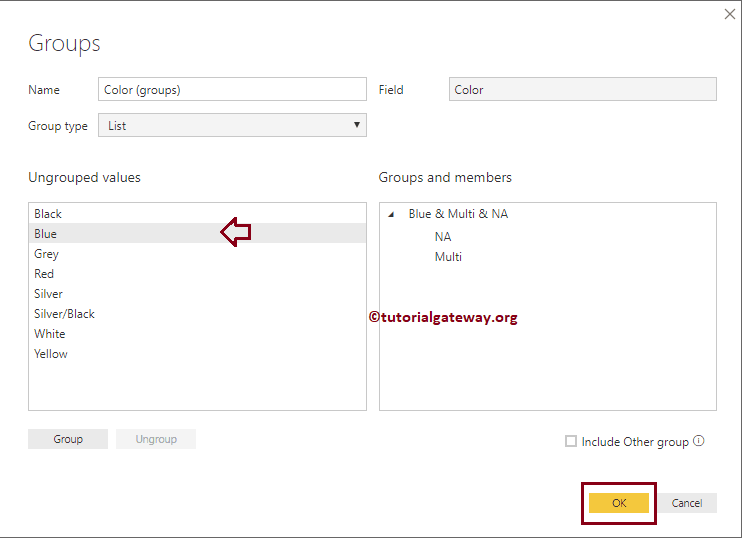
To remove Power Bi group members, Please select the group member that you want to remove, and click ungroup button. For the demo purpose, we are removing the Blue colour.
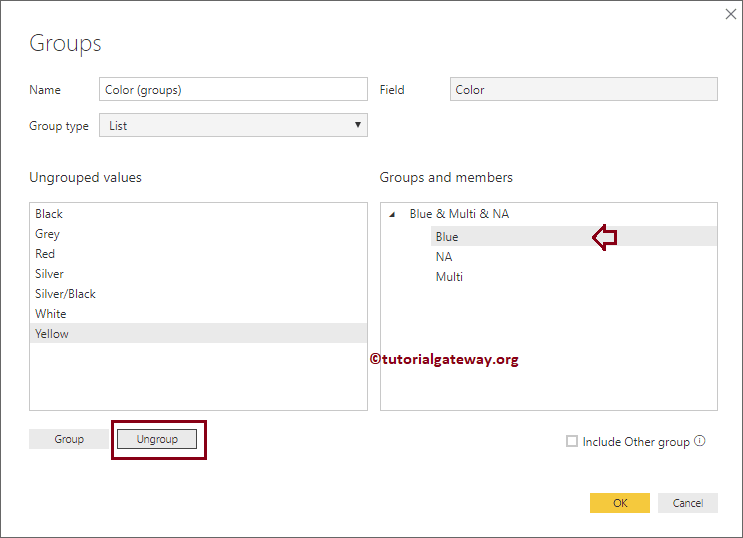
Now you can see that the Blue colour is removed, and added under the ungrouped values
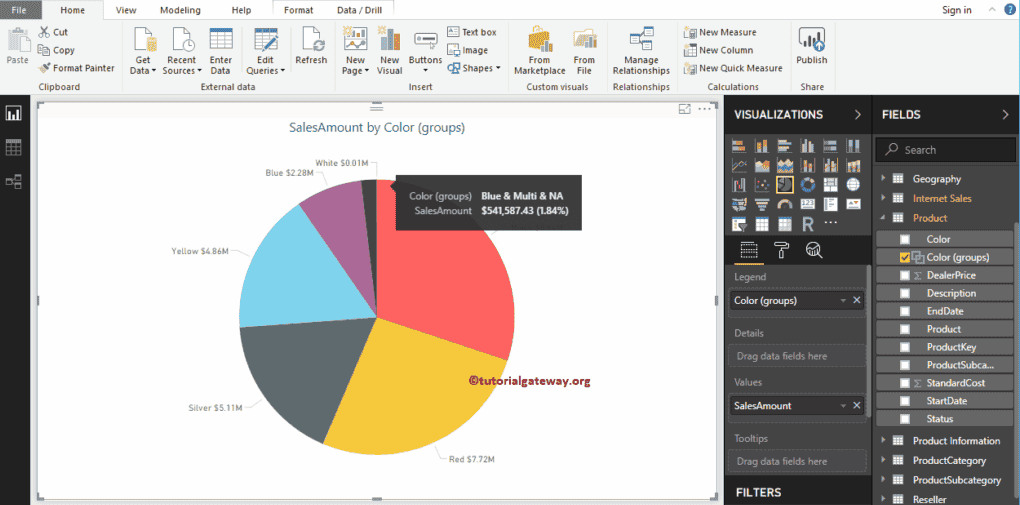
And our pie chart is displaying all the colours, and one group that contains Multi and NA colours.
Rename a Group in Power BI
Double-click on the group that you want to rename, and provide a valid name. Let me rename it as White & Multi & NA
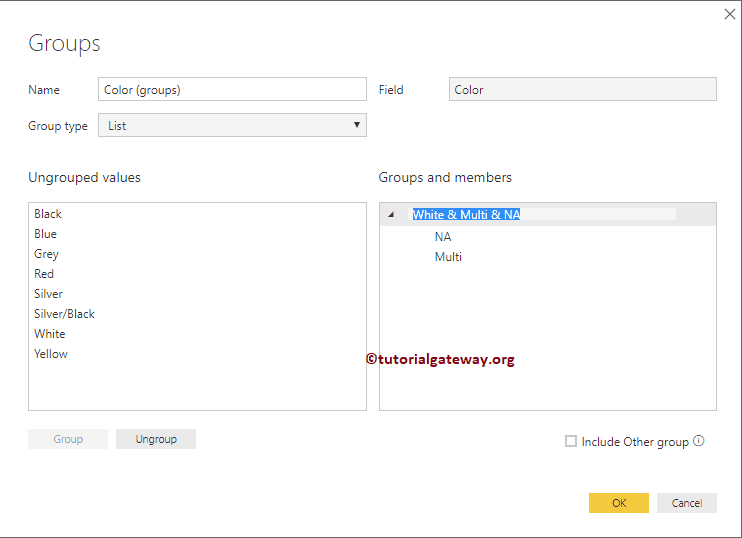
From the below screenshot, you can see that the group name is renamed.
Add a Member to Groups in Power BI
Please select the group member that you want to add, and select the group as well. Next, click on the Group button.
For the demo purpose, we are adding White colour to an existing group.
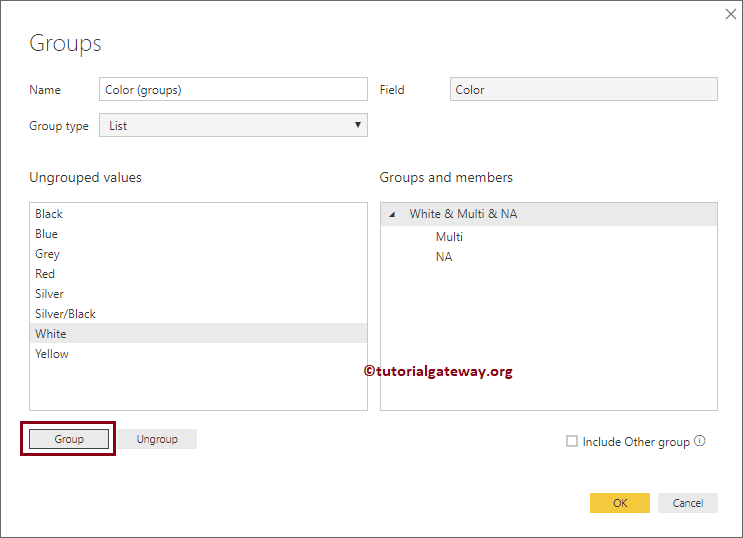
Now you can see the White colour under the group
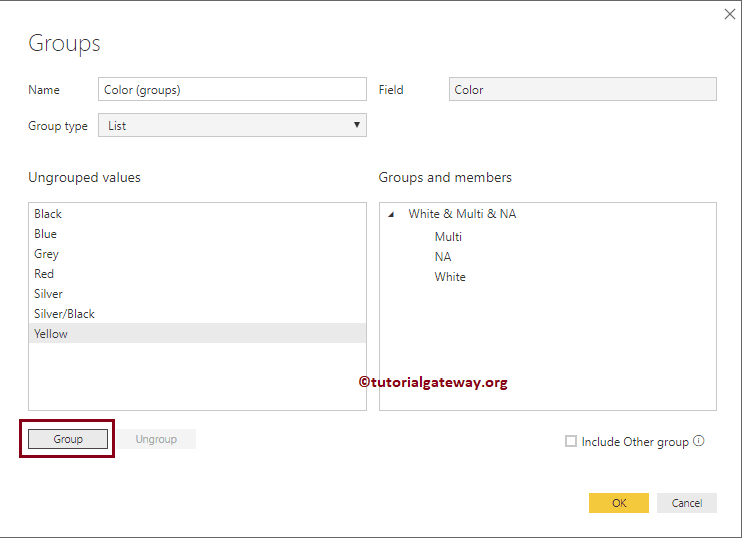
Create a New Group in Power BI
Please select the field for which you want to create a group, and click the group button. For the demo purpose, we are selecting the Yellow colour.
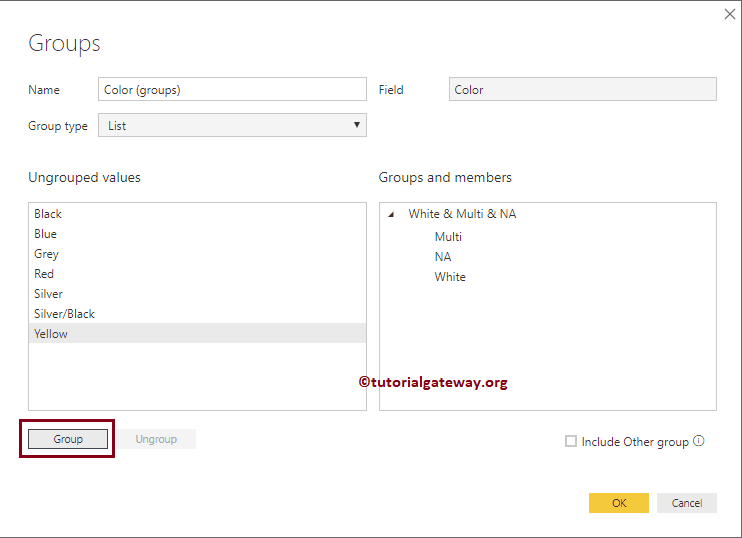
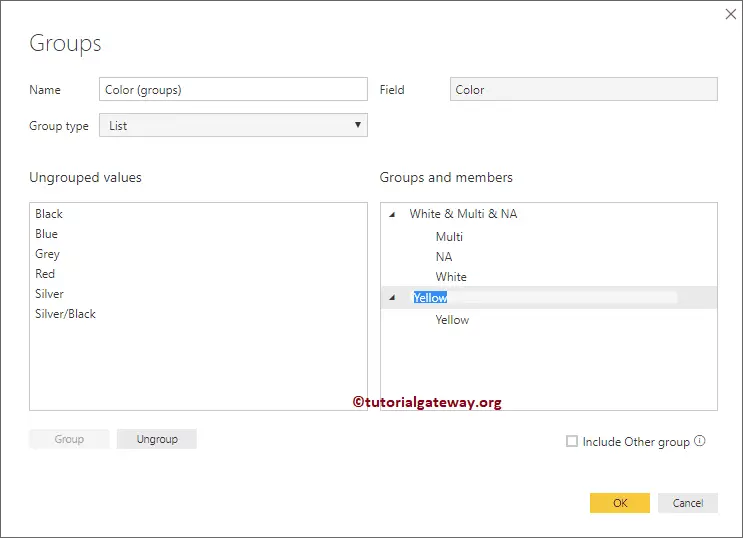
Now you can see the new group.
Let me add a few more fields to it
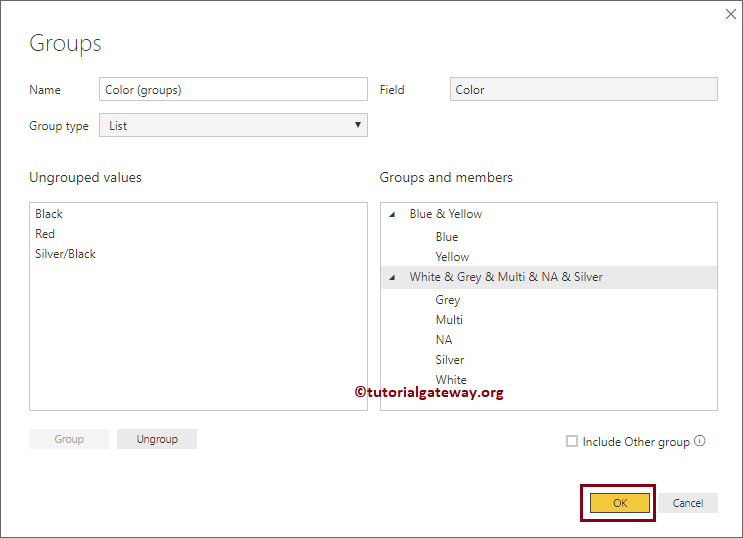
Now you can see, our pie chart has four colours, and they are: Black, Red, and two groups
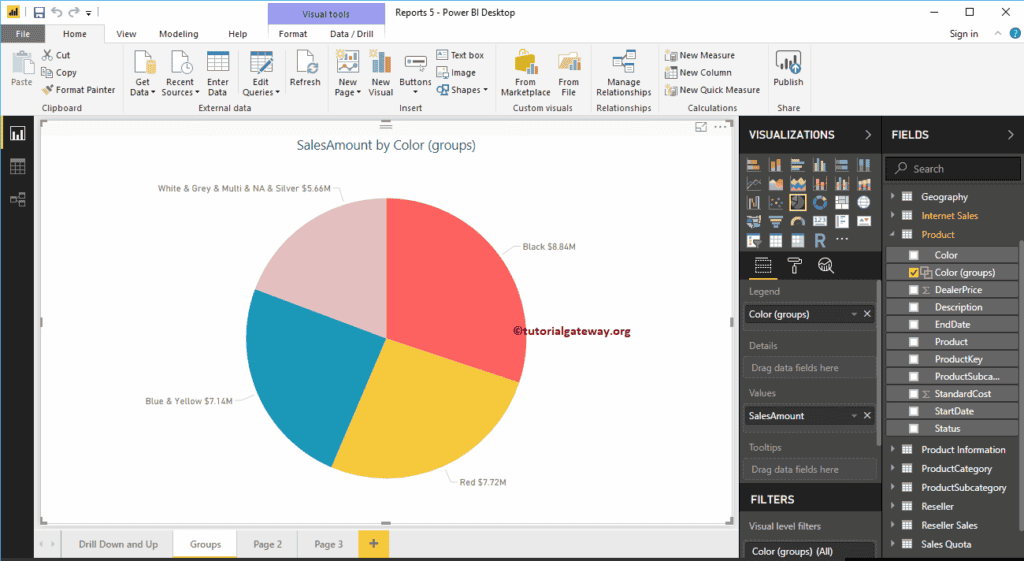
Once you created a Group in Power BI, it will act like any other column or fields. So, you can use it in N number of charts.
To demonstrate the same, we created a Column chart that shows the Country wise sales.
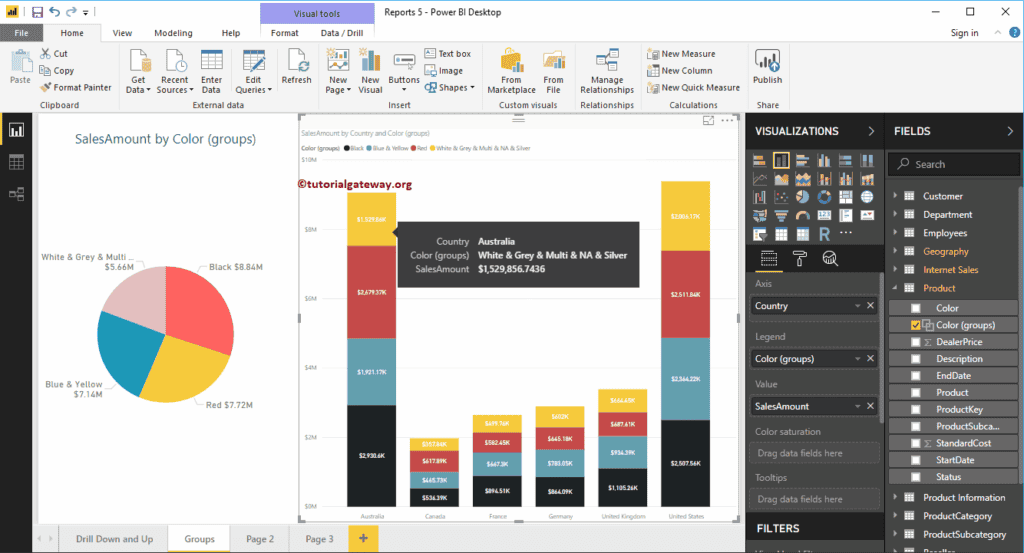
Next, we added the Color group in the legend section.
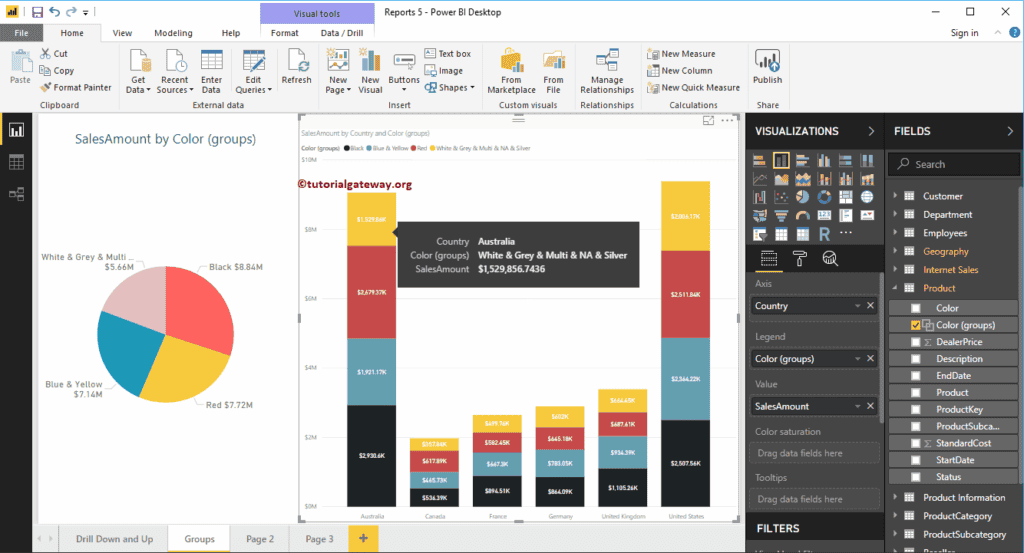
The second approach to create Groups in Power BI
Please select the filed that you want to use as a group, and right-click on it will open the context menu. Select the New Group option from the context menu.
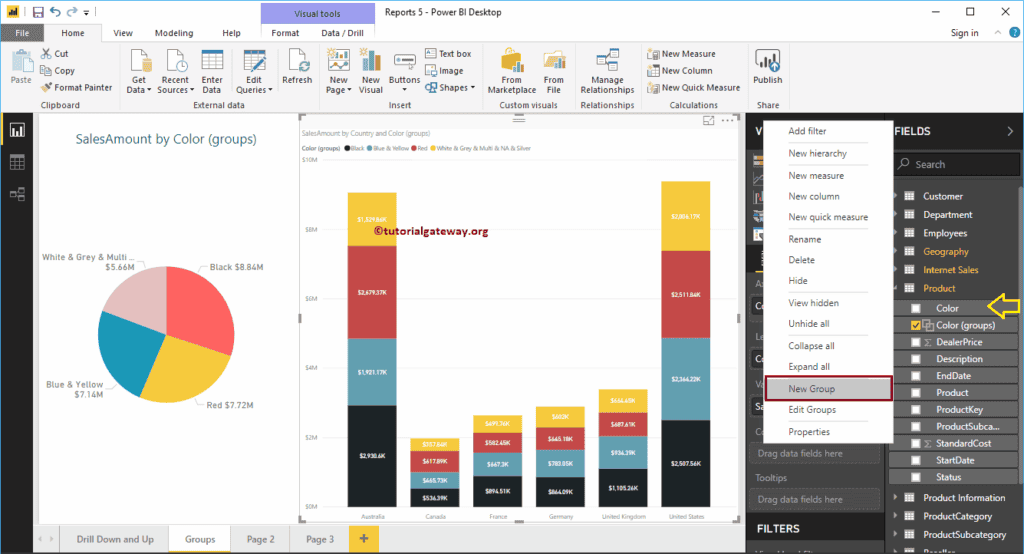
This will open the following window
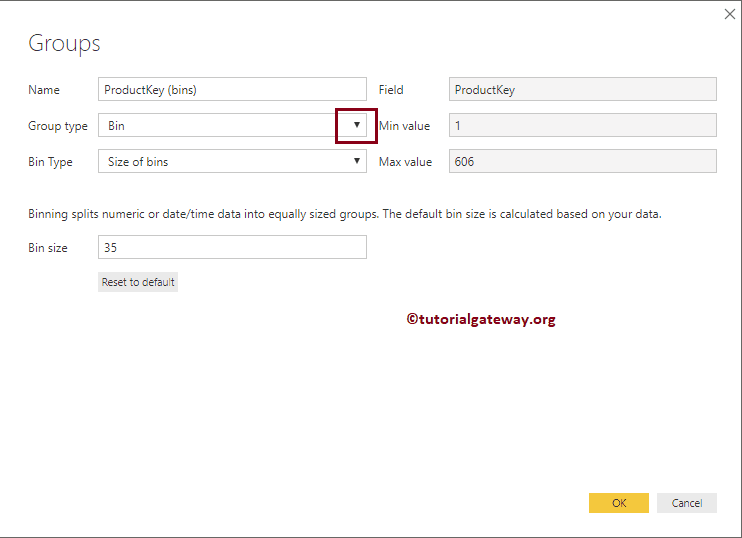
Sometimes, Power Bi will open the same window with the different option like we shown in the below screenshot. But, don’t worry, you can change the Group type from Bin to List
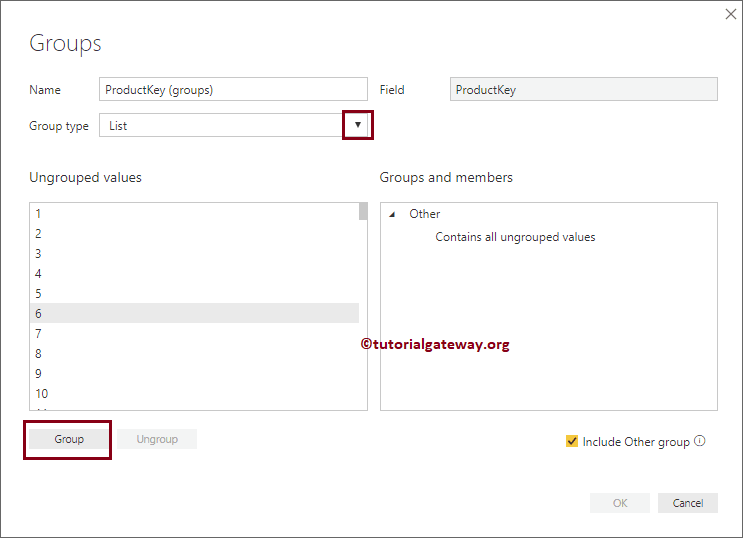
Once you changed that property, you are good to go
Create Hierarchy in Power BI
Power BI Hierarchies provide you with the drill down action to the BI report. Let me show you how to Create hierarchy in Power BI reports with an example.
How to Create Hierarchy in Power BI
To demonstrate the creation of hierarchies in Power BI, we are going to use the table that we created in the Combine Multiple Tables article.
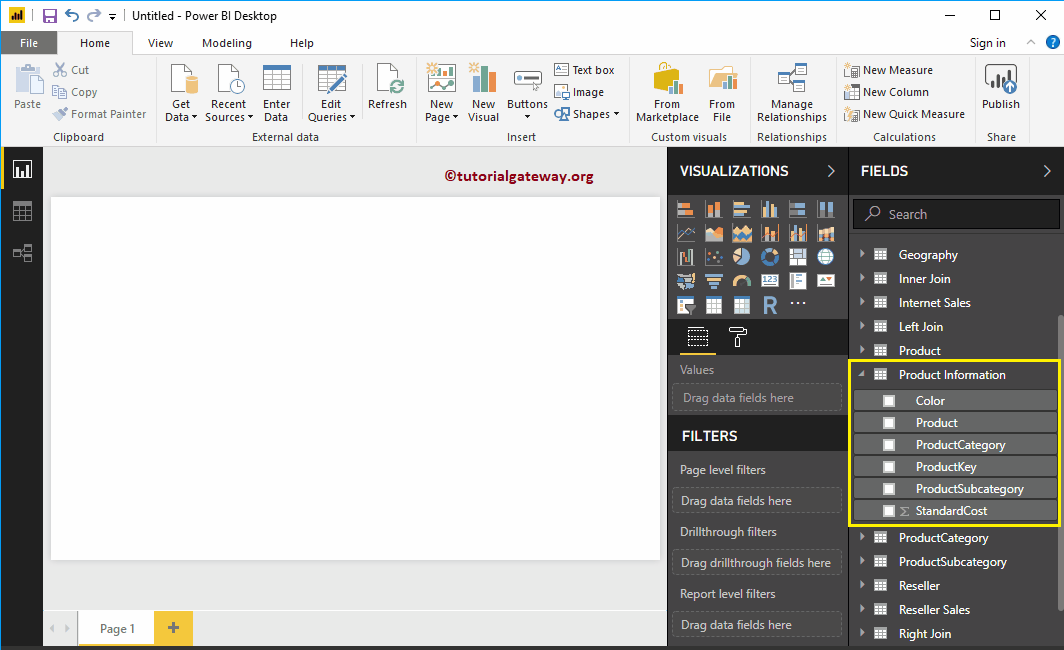
There are a couple of ways to create a hierarchy
The first approach to Create Hierarchy in Power BI
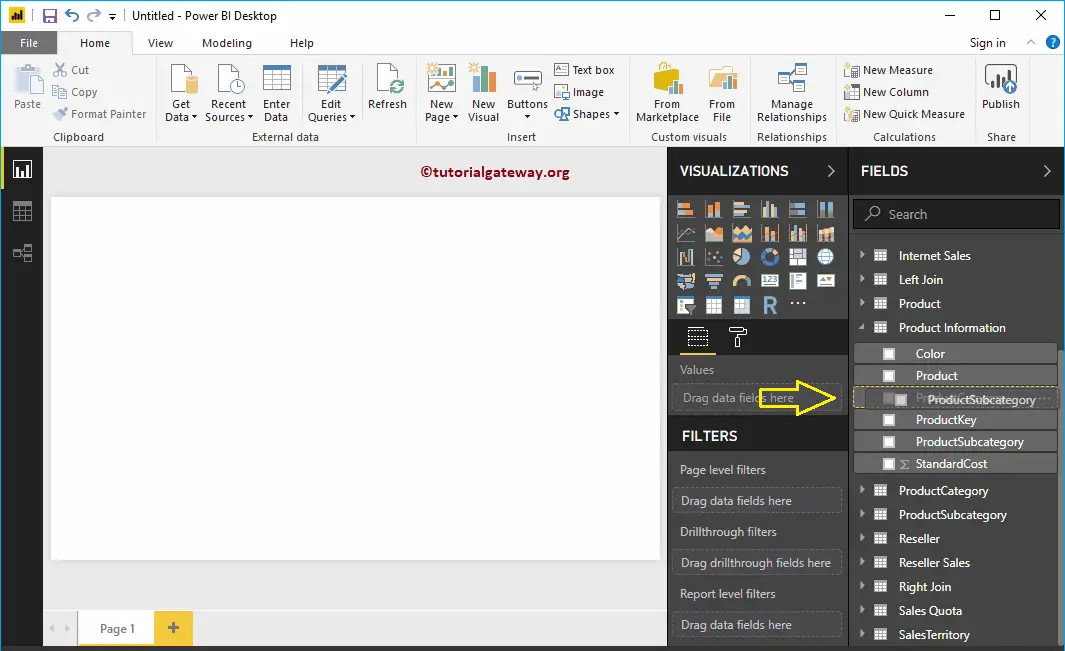
To create a new hierarchy in Power BI, Drag and drop one field on to the other. It automatically creates a Hierarchy for you. To demonstrate the same in Power BI, we are dragging the product subcategory onto the product category field.
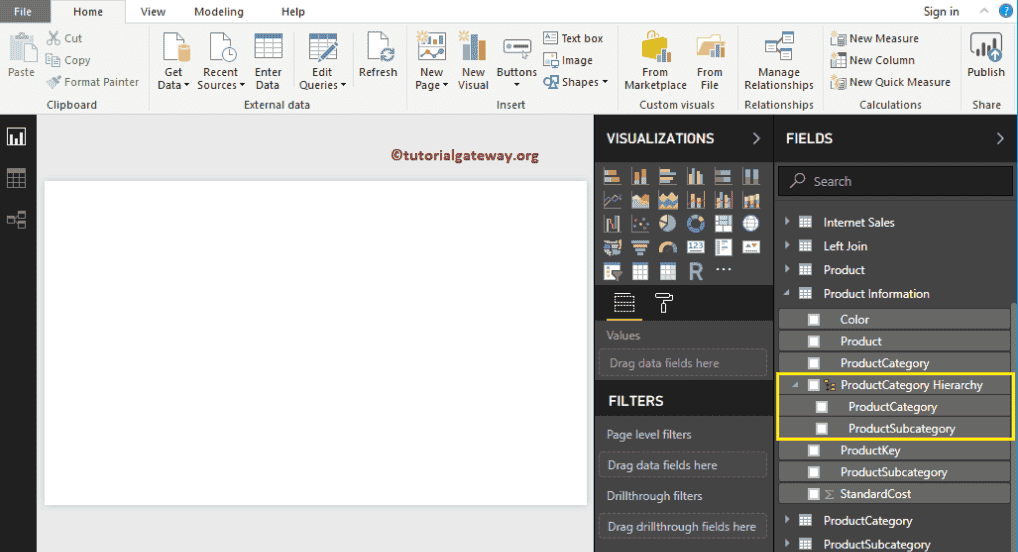
Now you can see the newly created hierarchy.
The first approach to add fields to a Power BI hierarchy
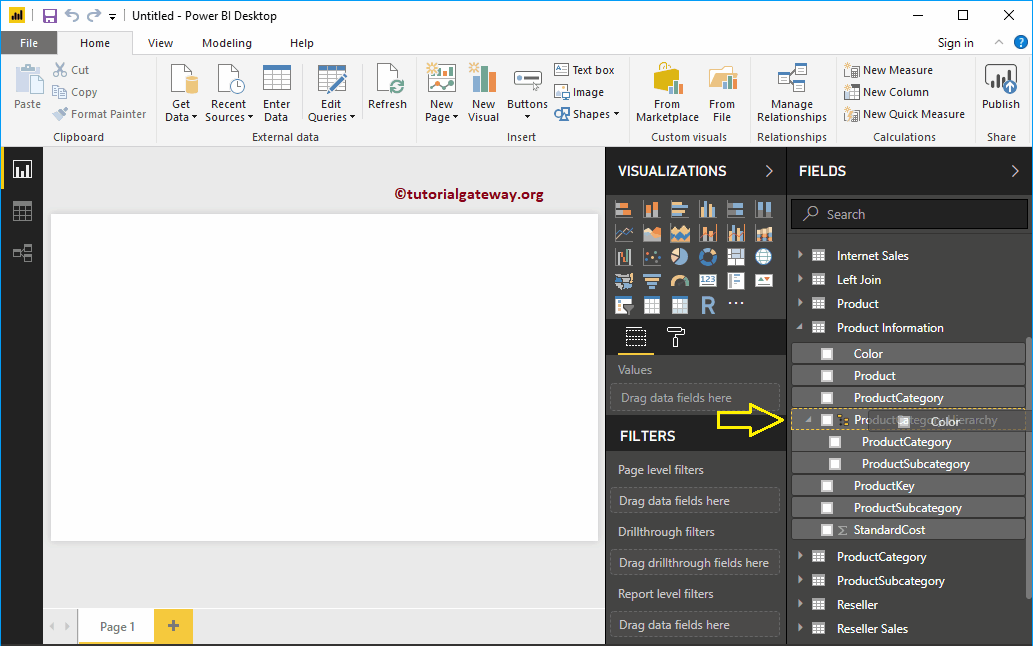
Drag and drop the required field to the newly created hierarchy. Let me drag the color field.
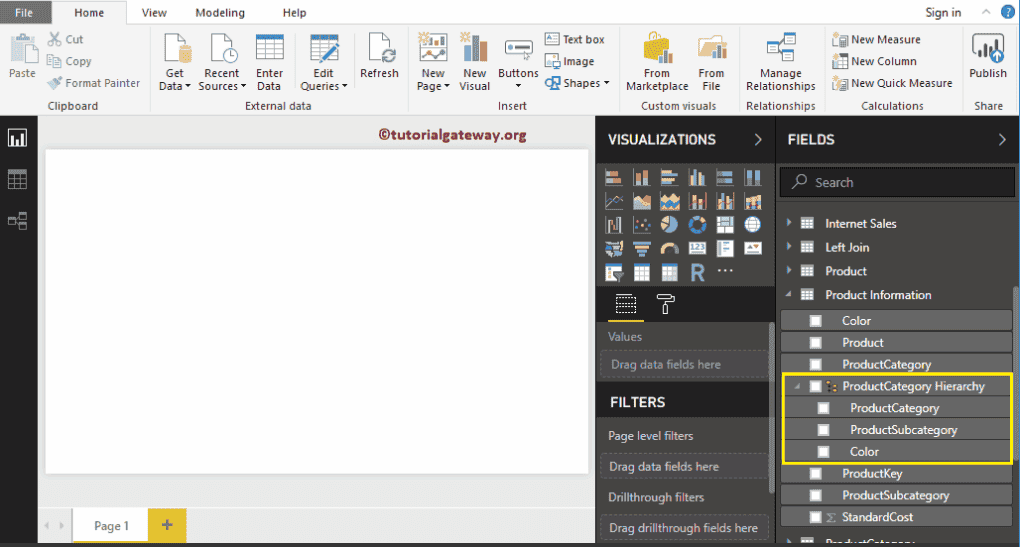
Now you can see the Color field inside the Hierarchy.
The second approach to add fields to a Power BI hierarchy
Please select the field that you want to add (let me select product), and right-click on it will open the context menu. Select the Add to Hierarchy, and then select the Hierarchy name (Product Category Hierarchy)
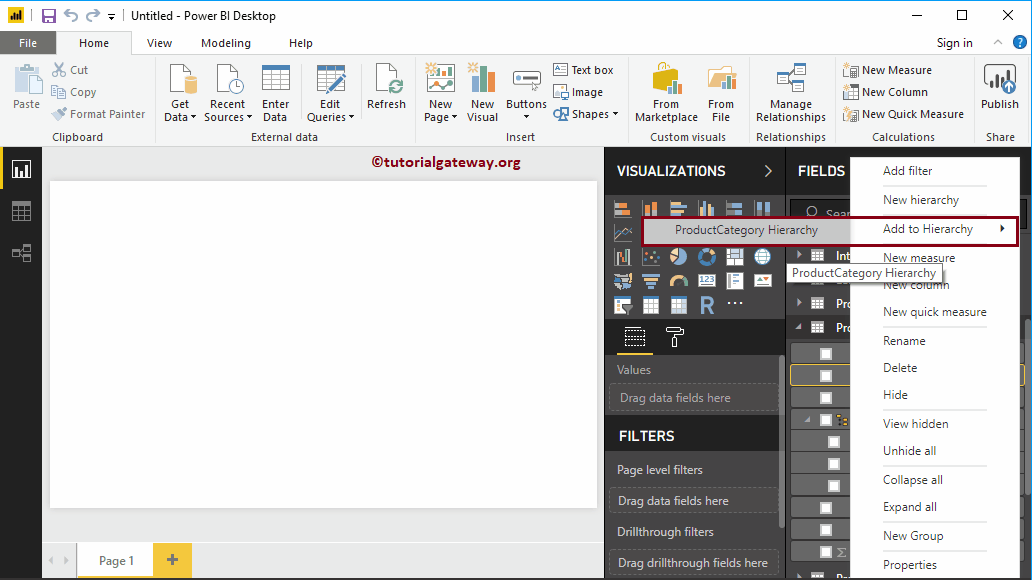
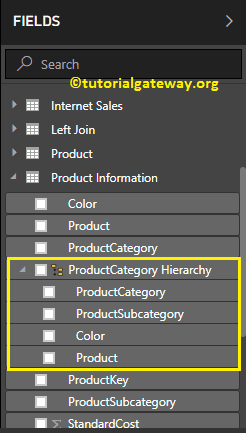
Now you can see the Product under the hierarchy.
Change Hierarchy Levels in Power BI
Please be careful while configuring the hierarchy levels. For instance, if you have the State column above the Country, then Level 1 is State, level 2 is the Country.
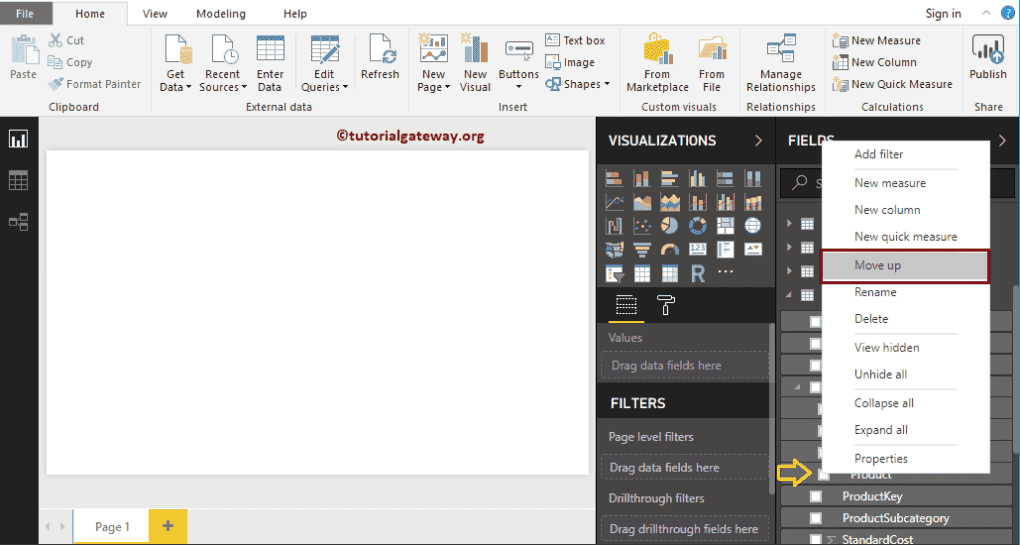
Please select the field that you want to change the position or level. Next, right-click on it and select the Move Up option (or move down) from the context menu. Alternatively, you drag and drop the field at the required position.
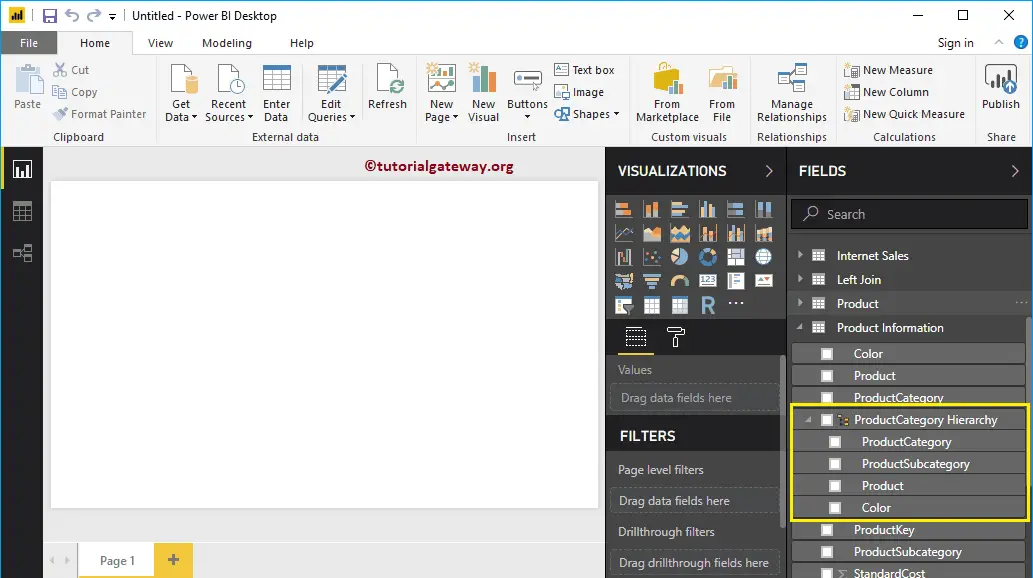
Now you can see the product at the third position
Rename Hierarchy in Power BI
Please select the Hierarchy that you created, and right-click on it will open the context menu. Select the Rename option from the context menu. Alternatively, you can double-click on the hierarchy name
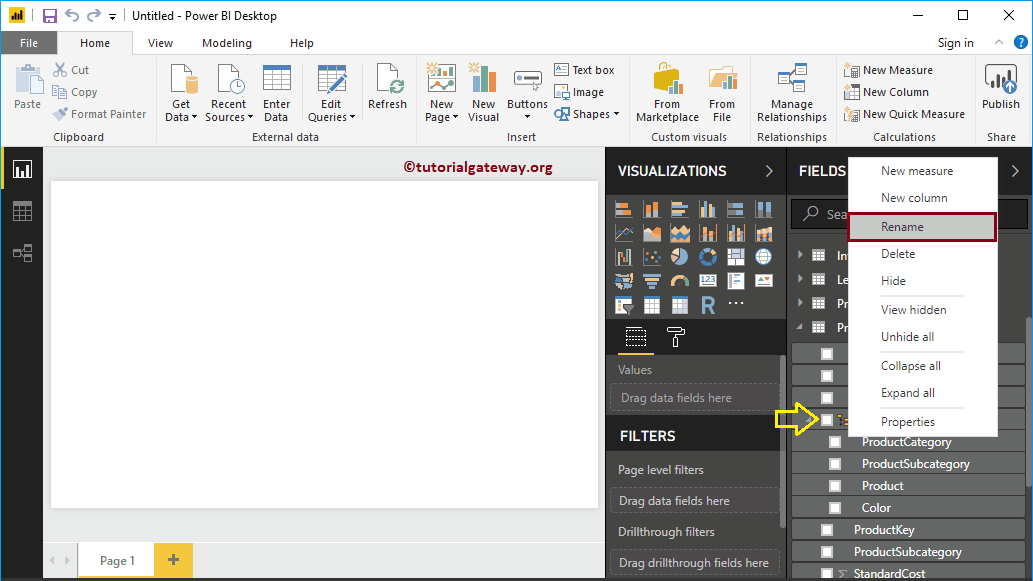
Let me rename it as the product hierarchy
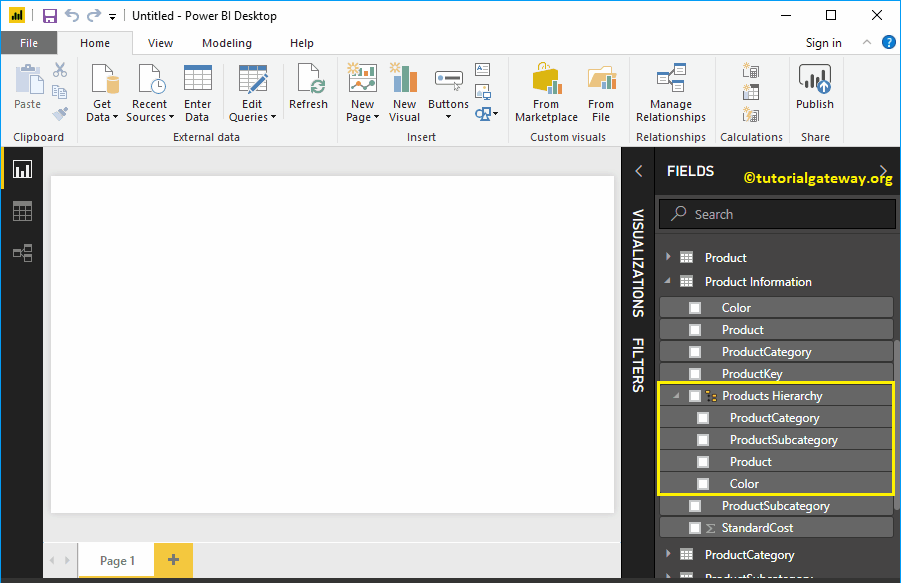
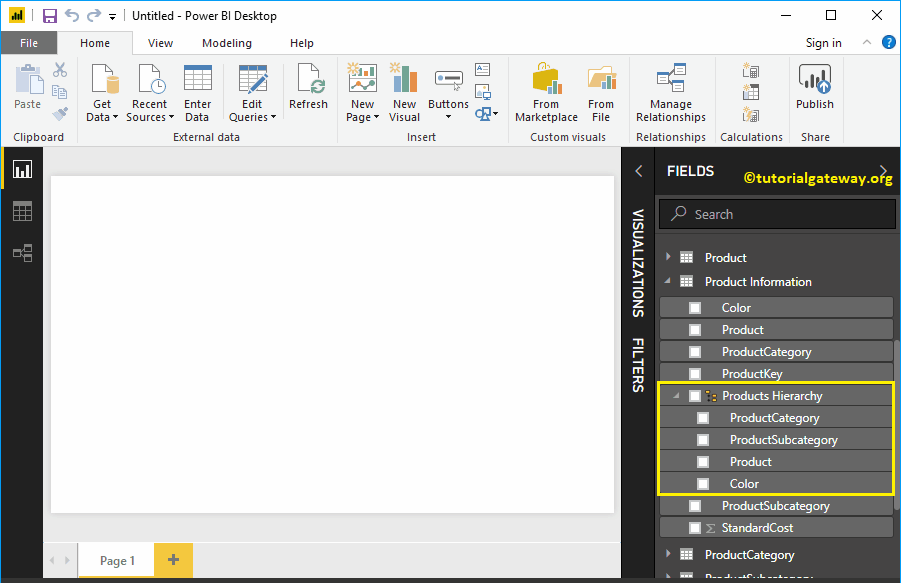
Now you can see the new name
Delete Hierarchy in Power BI
Select the Hierarchy that you delete, and right-click on it open the context menu. Please select the Delete option from the context menu.
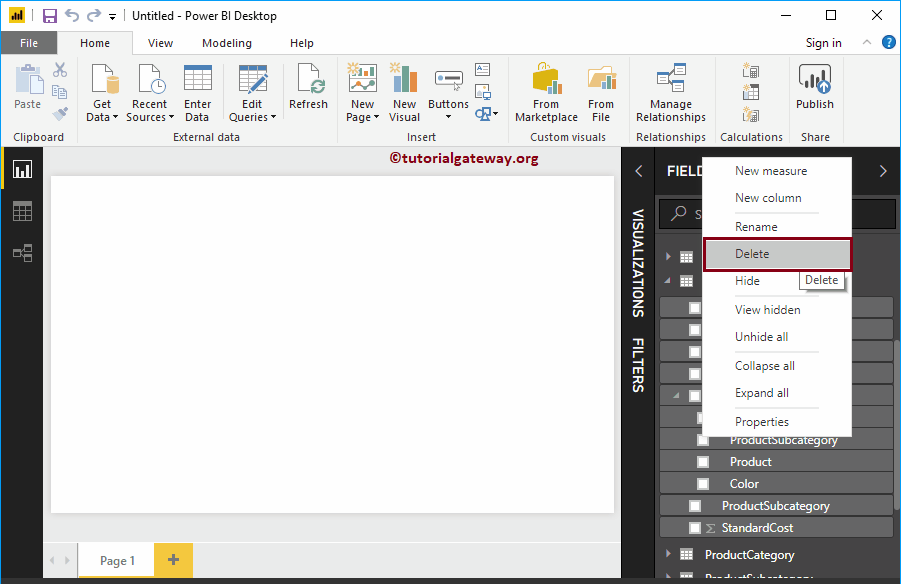
Click on the Delete button to confirm the delete operation.
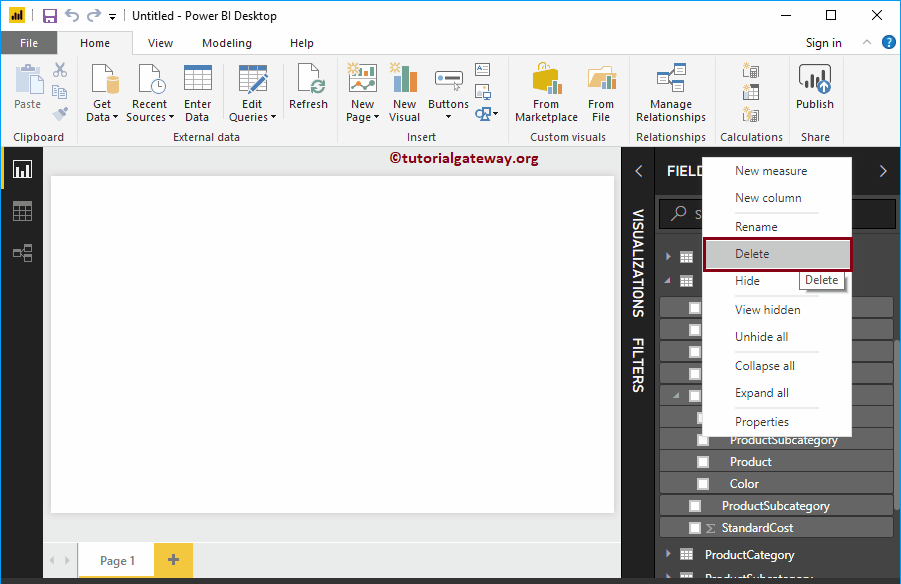
The second approach to create Hierarchy in Power BI
Please select the filed that you want to use in Hierarchy, and right-click on it will open the context menu. Select the New Hierarchy option from the context menu.
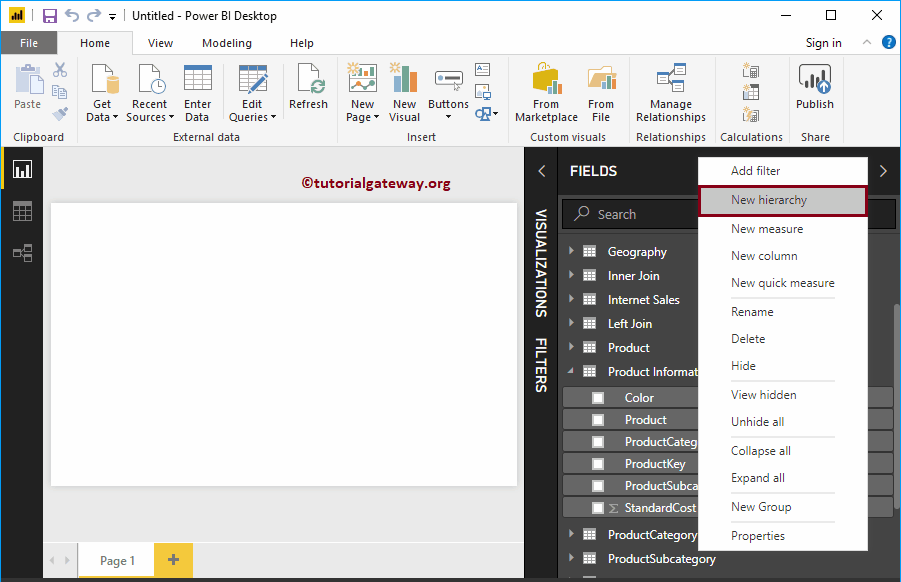
It creates a new hierarchy for you.
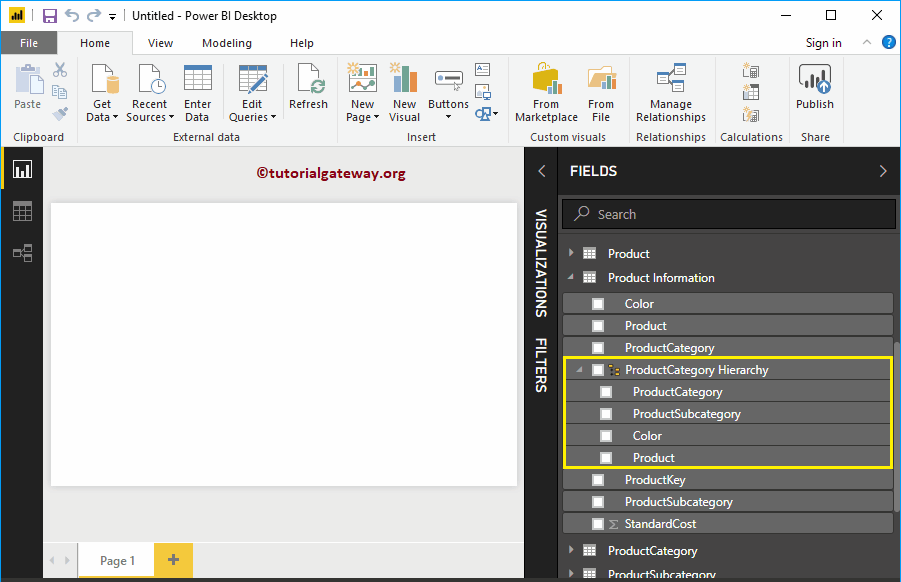
Let me add a few more fields
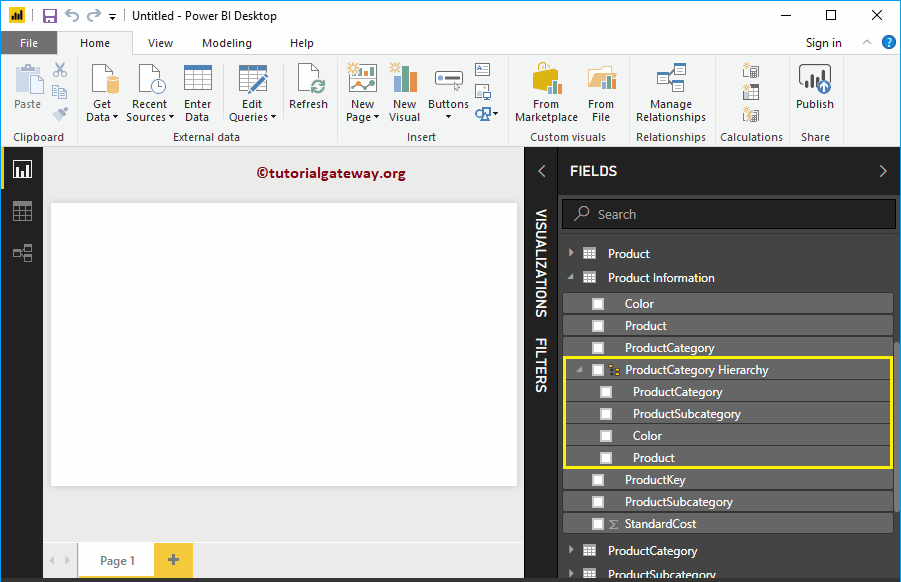
Delete Fields from Hierarchy
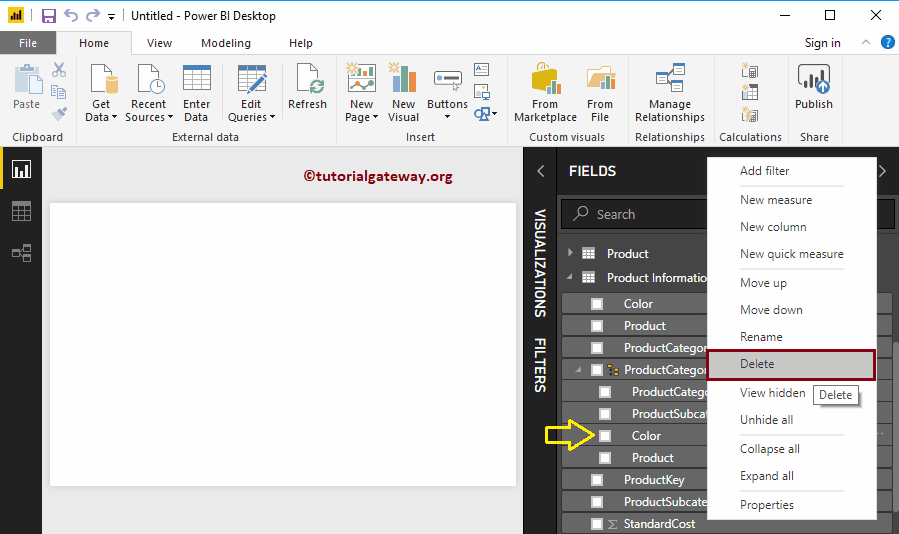
Please select the field that you want to remove or delete from the hierarchy. Next, right-click on it and Delete option from a context menu.
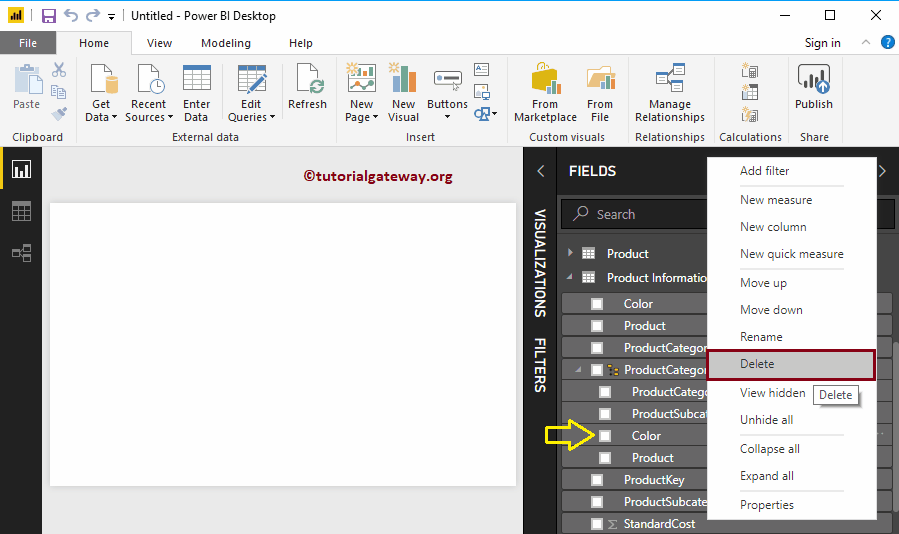
Click the delete button to delete the Color field from the hierarchy.

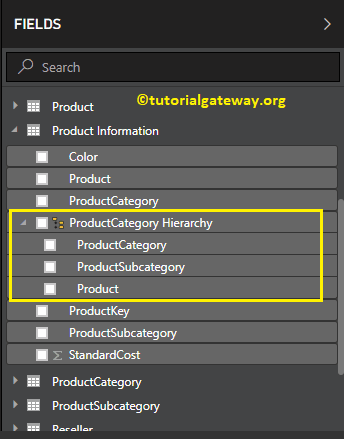
You can see the same in the below screenshot
Again, we added the Color field and renamed the hierarchy as the Product Information.
Joins in Power BI
Power BI supports all major joins that are available in SQL. Let me show you how to use joins in Power BI to join multiple tables with an example.
The following join types are the Standard join types in Power BI and SQL
- Inner Join: Returns the rows present in both Left and right table only if there is a match. Otherwise, it returns zero records.
- Full Outer Join: It returns all the rows present in both the Left and right table.
- Left Outer Join: It returns all the rows present in the Left table and matching rows from the right table (if any).
- Right Outer Join: Returns matching rows from the left table (if any), and all the rows present in the SQL Right table.
How to Perform Joins in Power BI
To demonstrate the Power BI join types, we are going to use the tables that we imported in the Load Data from Multiple Data Sources article.
To show the join operations on existing tables, please click the Edit Queries option under the Home tab.
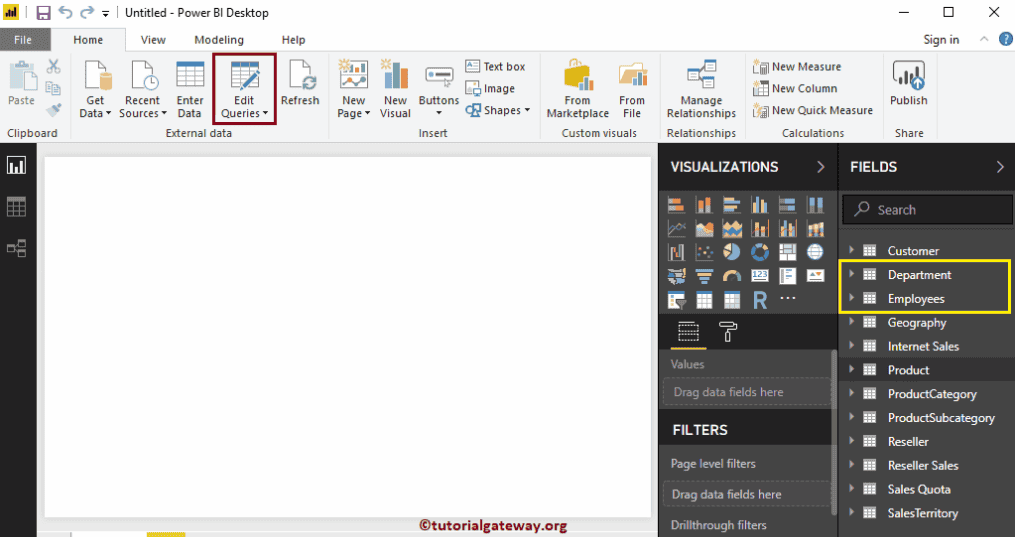
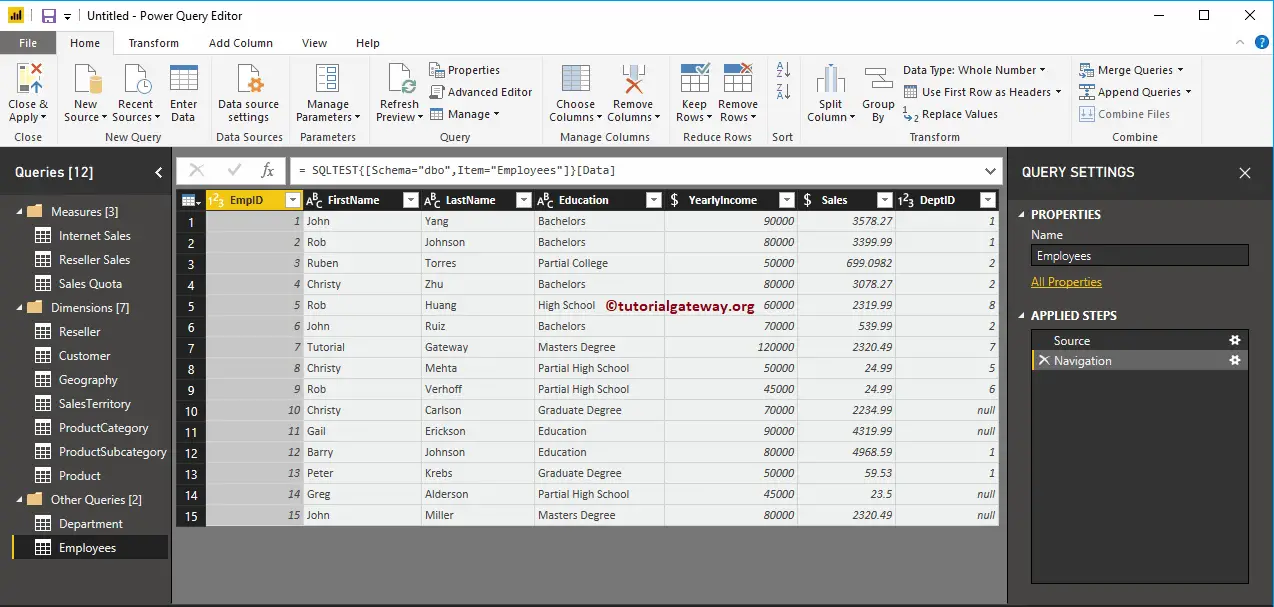
The below Power BI screenshot show you the data present in the Employees table
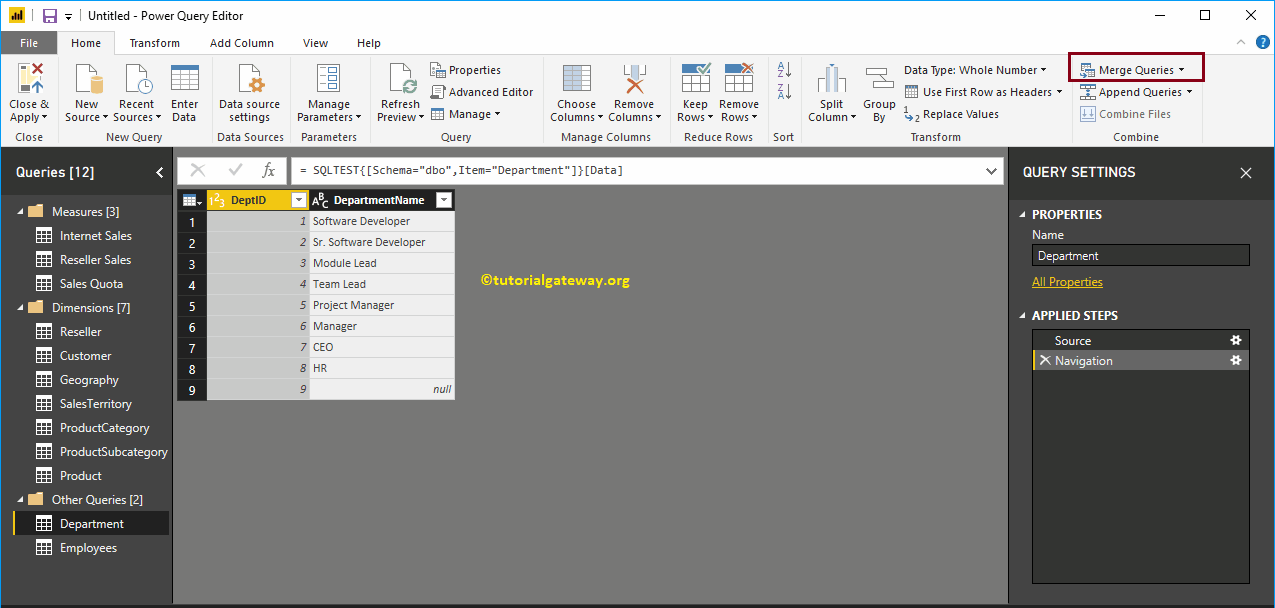
The following screenshot shows you the data present in the Department Table.
To perform Power BI Join operations on any table, we have to use the Merge Queries button present in the Home tab
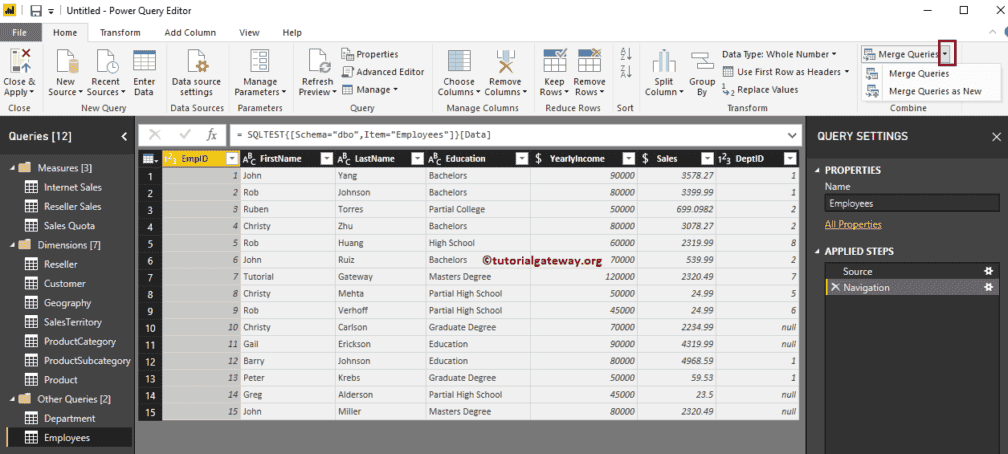
This drop-down list has two options:
- Merge Queries: It merges the second table inside this original table.
- Merge Queries as New: It creates a new table with the result of joining the first and second tables.
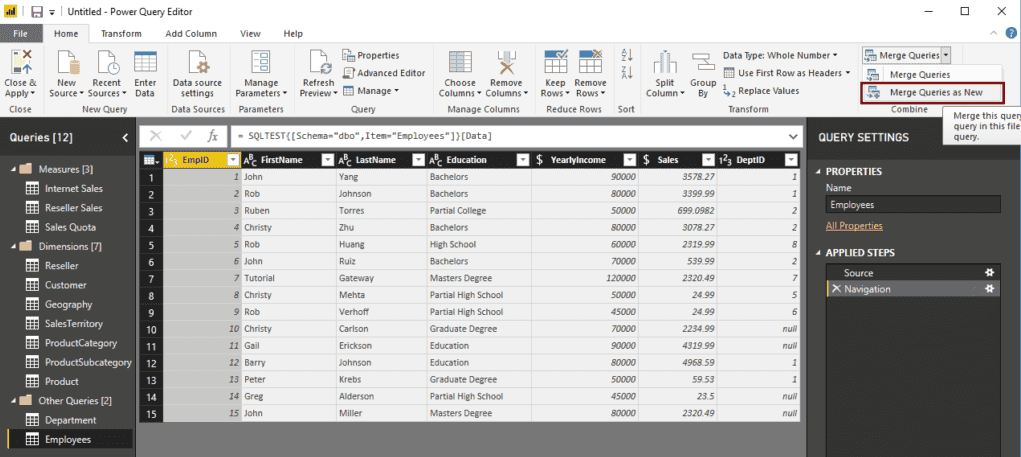
Let me select the Employees table, and select Merge Queries as a New option because we don’t want to disturb the original table
The following window will open. Use this window to select the Second Table, Join Type, and standard column filed in both the tables.
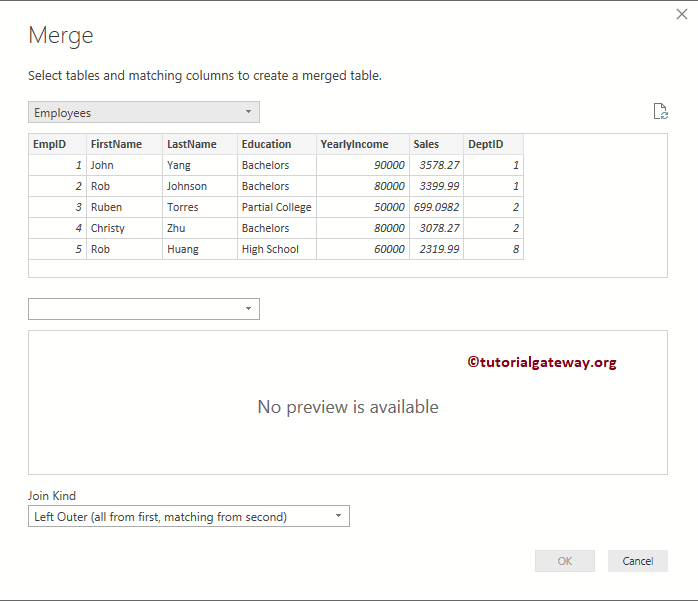
We are selecting the Department table as the second table.
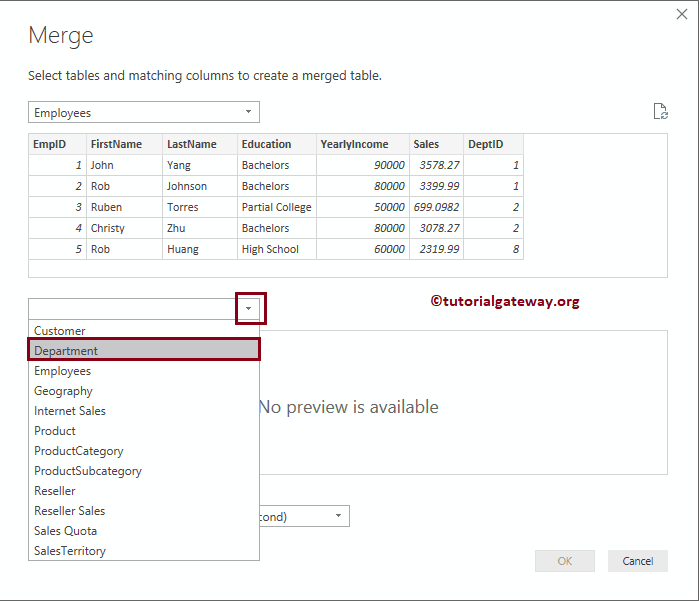
Now you can see the list of supporting join types.
Left Outer Join in Power BI
For now, we are selecting the Left Outer Join
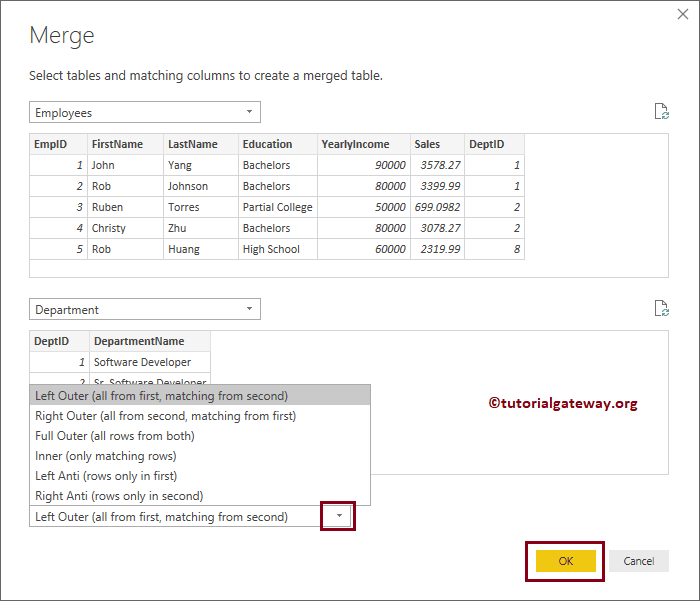
Next, we selected the DeptID from Employees and Department table as the common fields
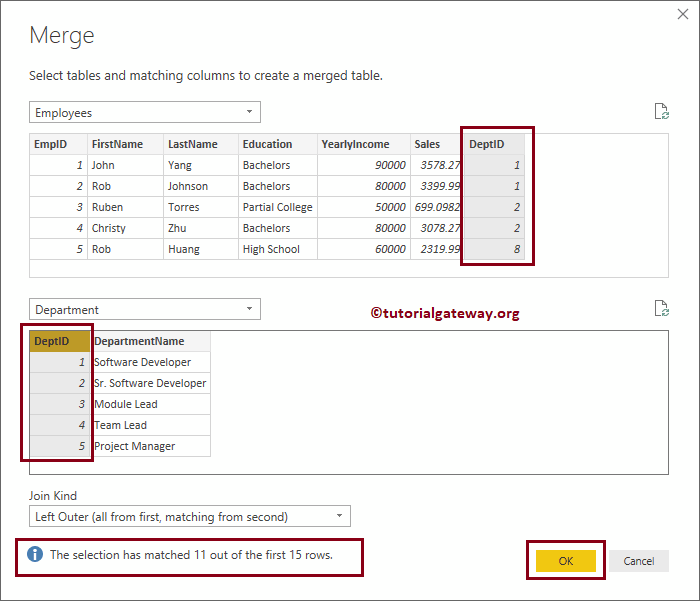
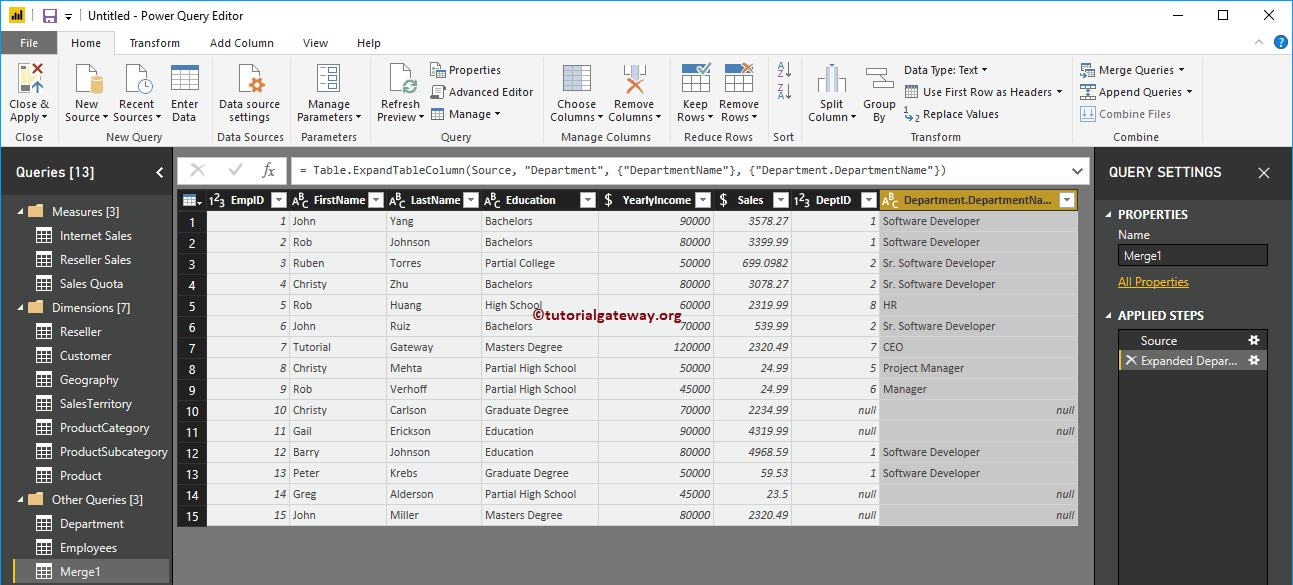
Now you can see the new table called Merge1 with all the fields from the Employees table along with one extra filed of values table
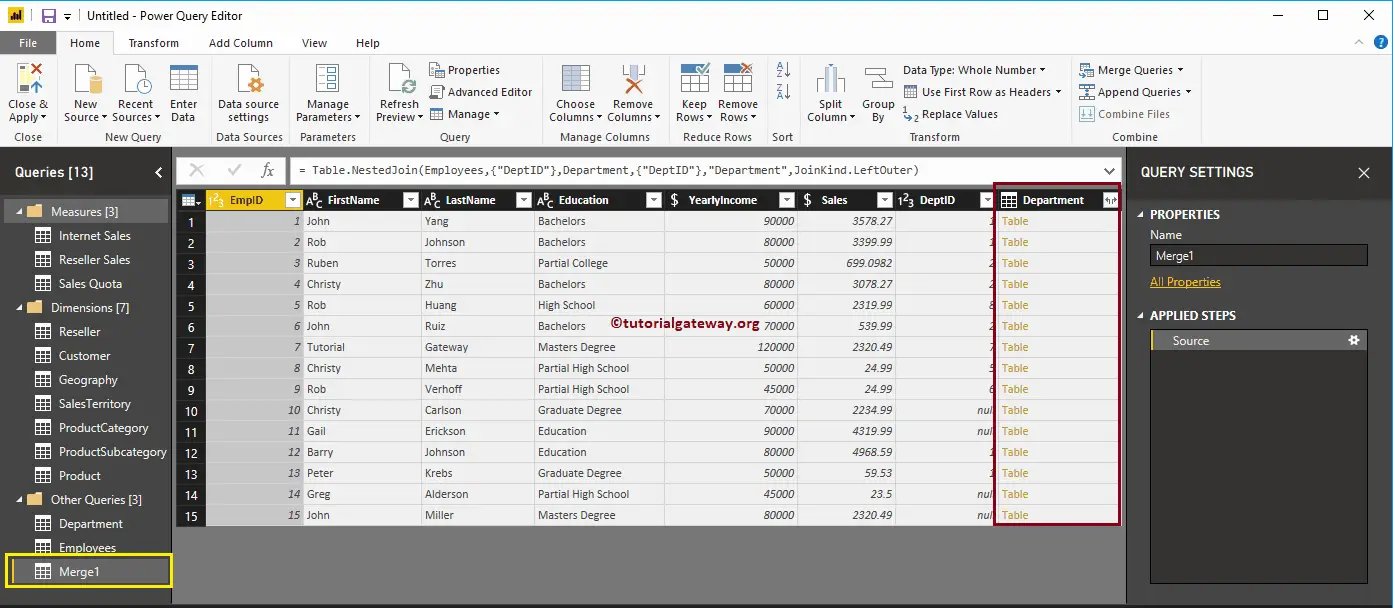
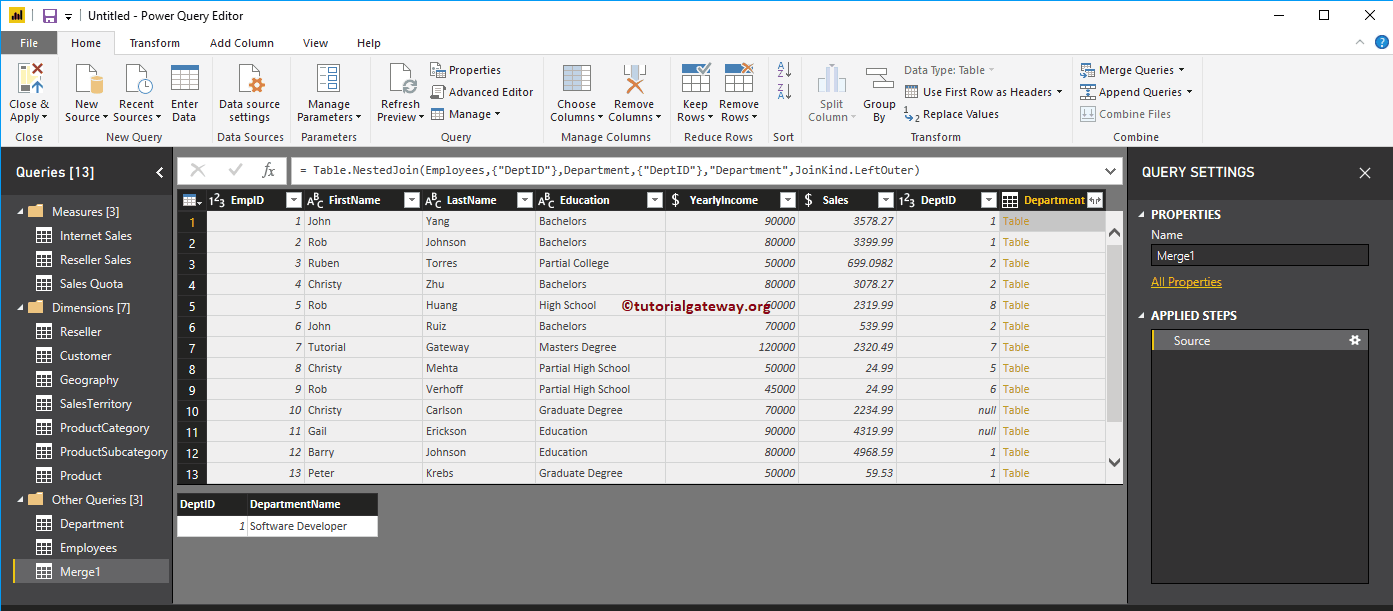
Click on the table on any row show you the respective table information
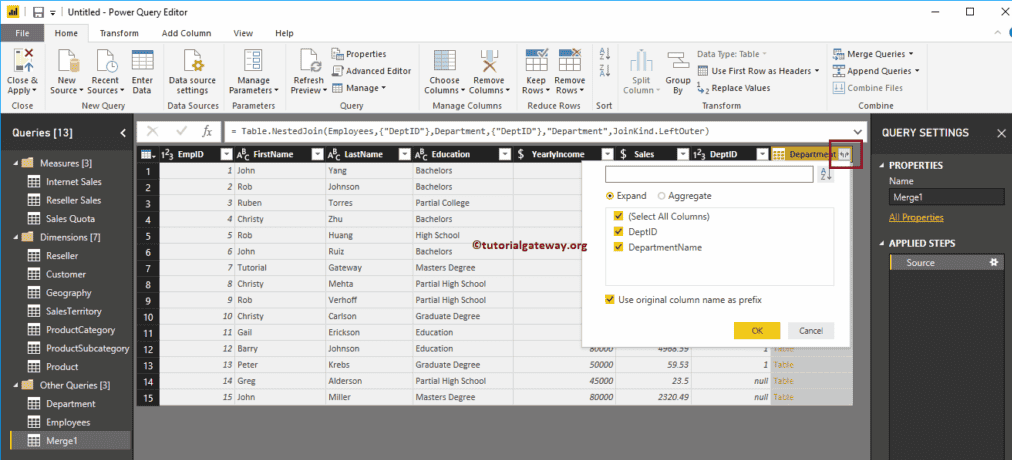
Please click on the right corner of the Department column header. This will open the following window. Use this window to select the required fields from the department table.
Let me select the Department name from the department table, and click OK
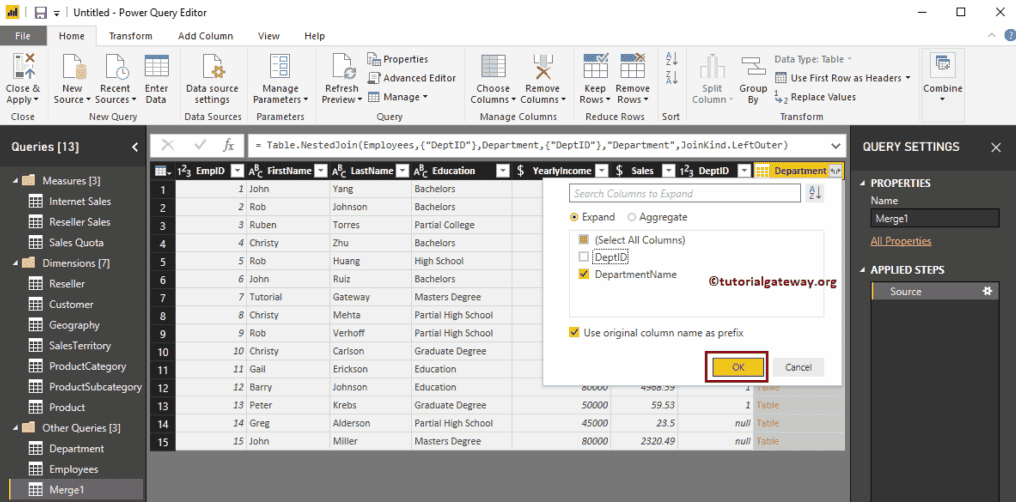
Now you can see the Department name merge with the Employee table.
Right Outer Join in Power BI
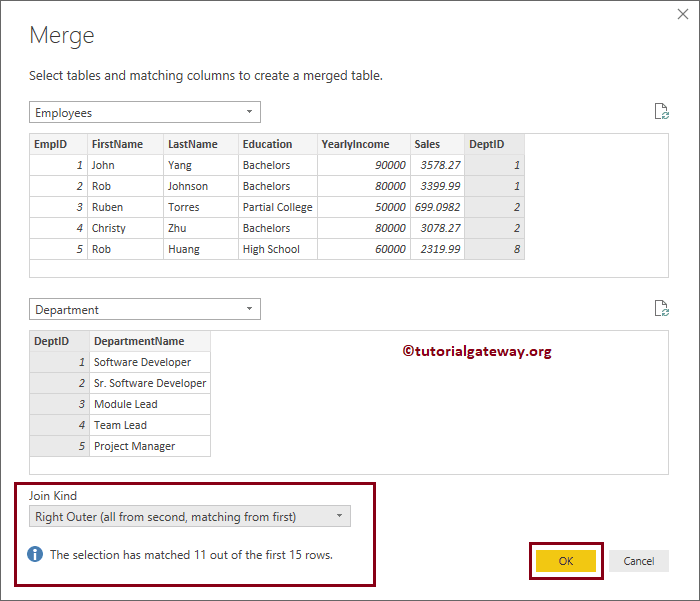
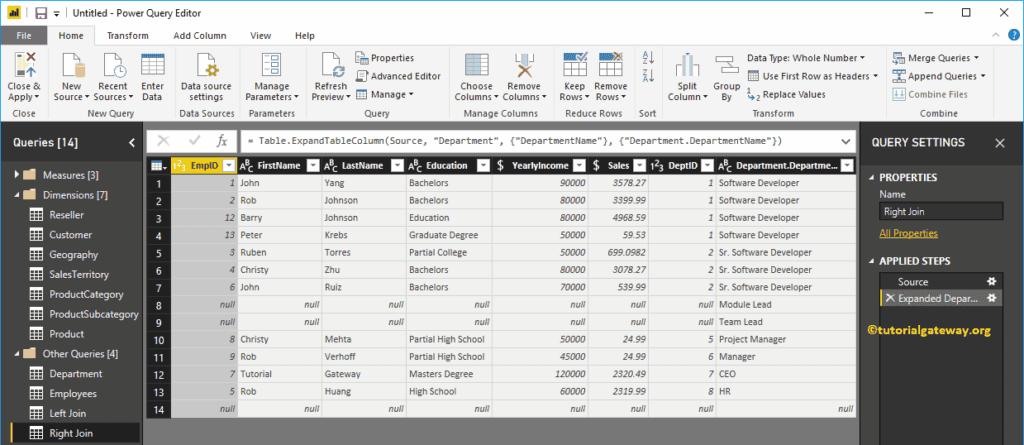
Let me select the Employees table as the first table, Department table as the second table. And the Dept Id is the common filed, and right outer join as the join type.
Now you can see the new table result of the Power BI right outer join
Full Outer Join in Power BI
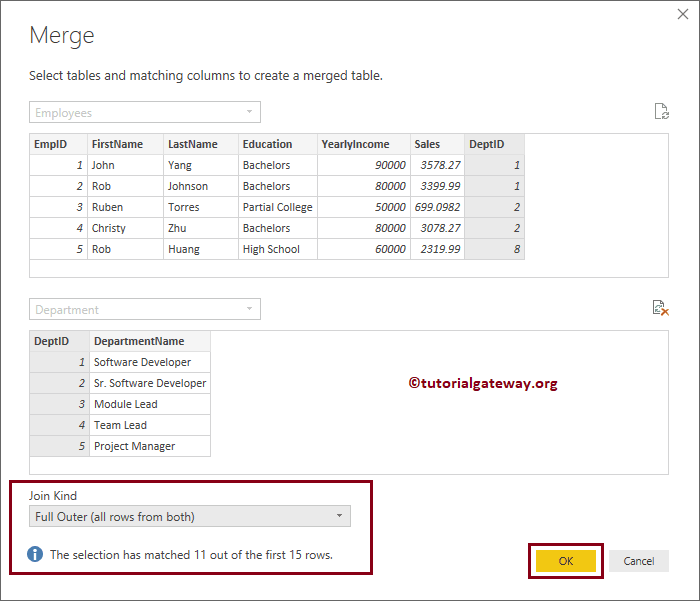
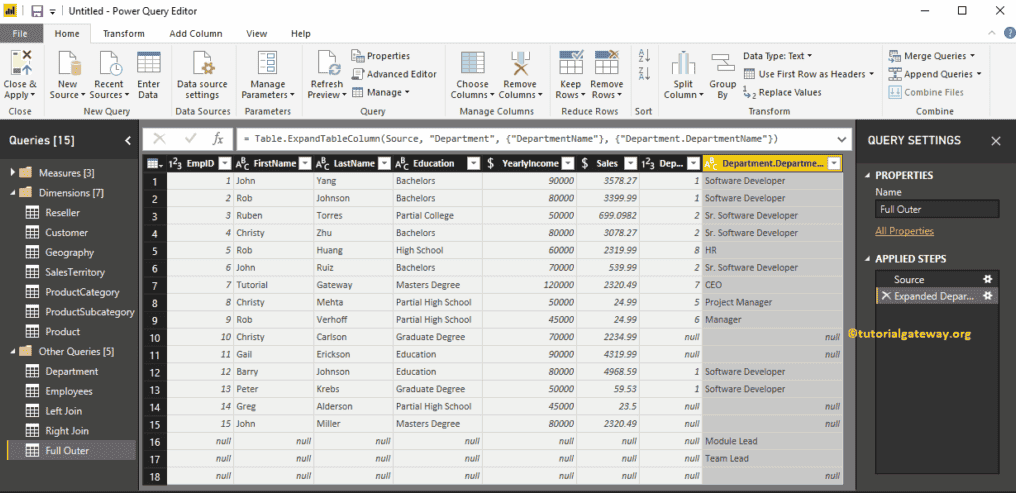
Let me select the Employees table as the first table, Department table as the second table. Here, we select Dept Id is the common filed, and full outer join as the join type.
Now you can see the result of Power BI Full outer join in a new table
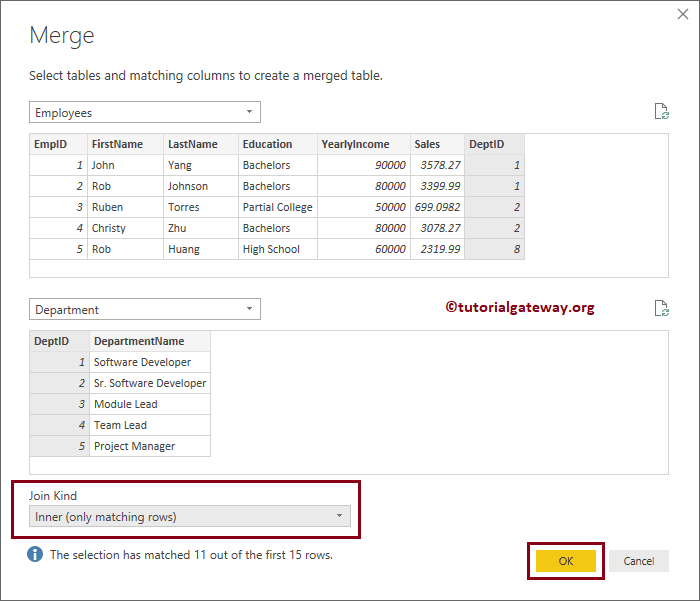
Inner Join in Power BI
Let me select the Employees and Department tables, Dept Id as the common field, an inner join as the join type
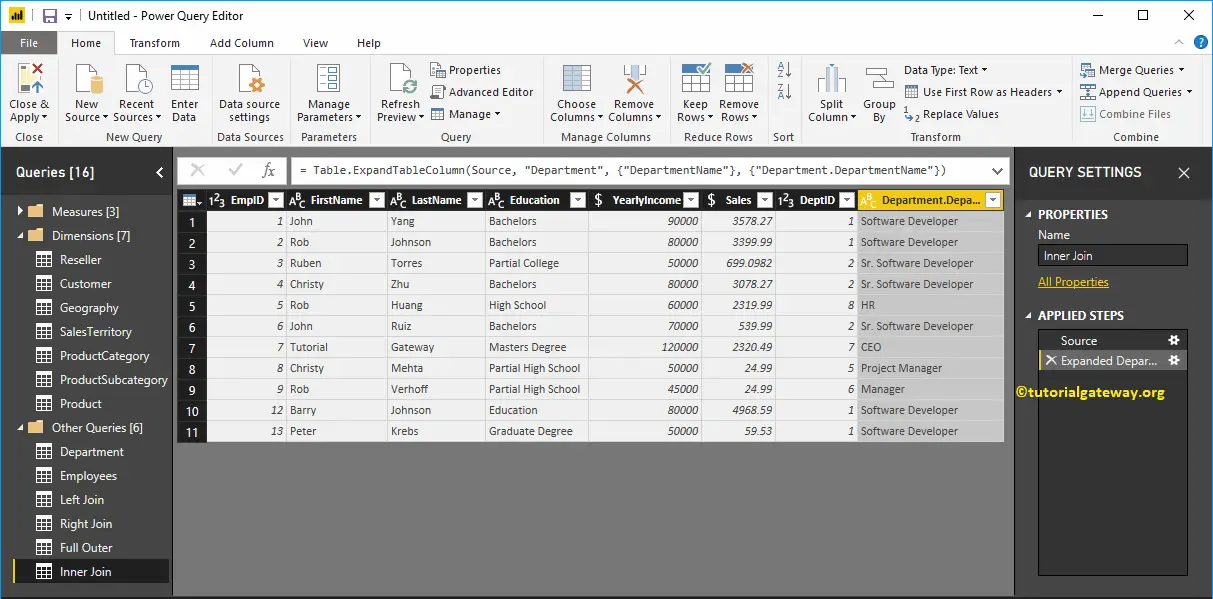
Now you can see the result of Power BI Inner join in a new table
Power BI Pivot Table
Power BI pivot table option converts selected rows into columns. Let me show you how to create a pivot table or how to convert the unpivoted table into a pivot table in Power BI with an example.
How to create a Power BI Pivot Table
To create a Power BI pivot table or to convert unpivot to a pivot table, please click the Edit Queries option under the Home tab.
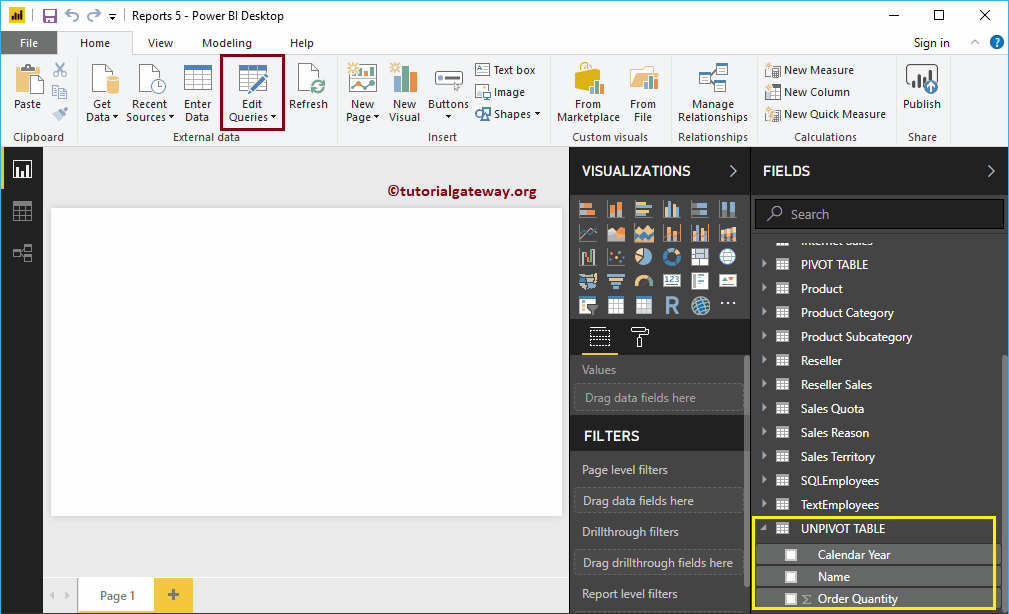
Clicking Edit Queries option opens a new window called Power BI Power Query Editor.
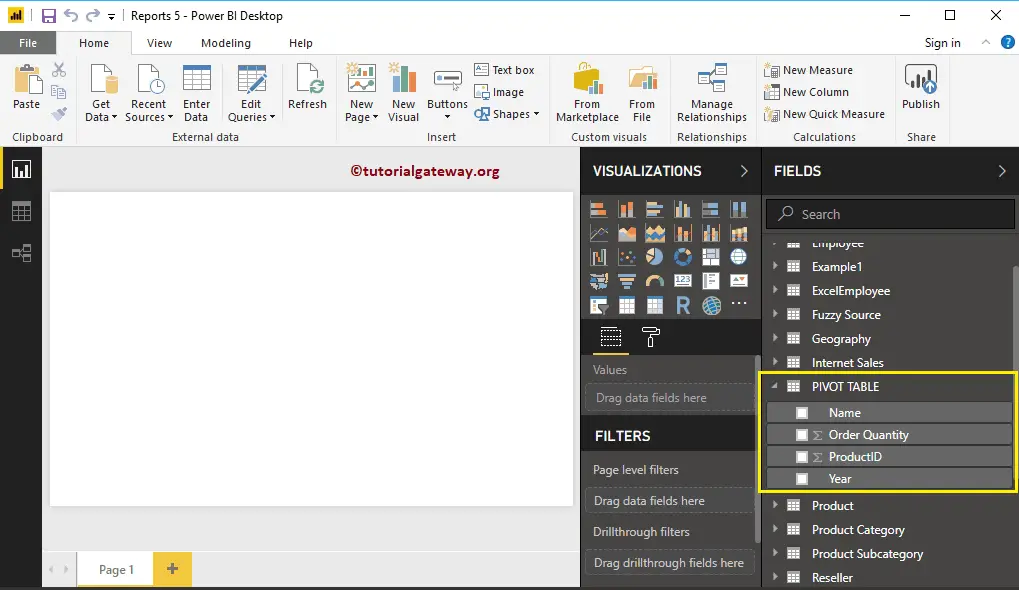
In this example, we are going to pivot the calendar year column based on the order quantity.
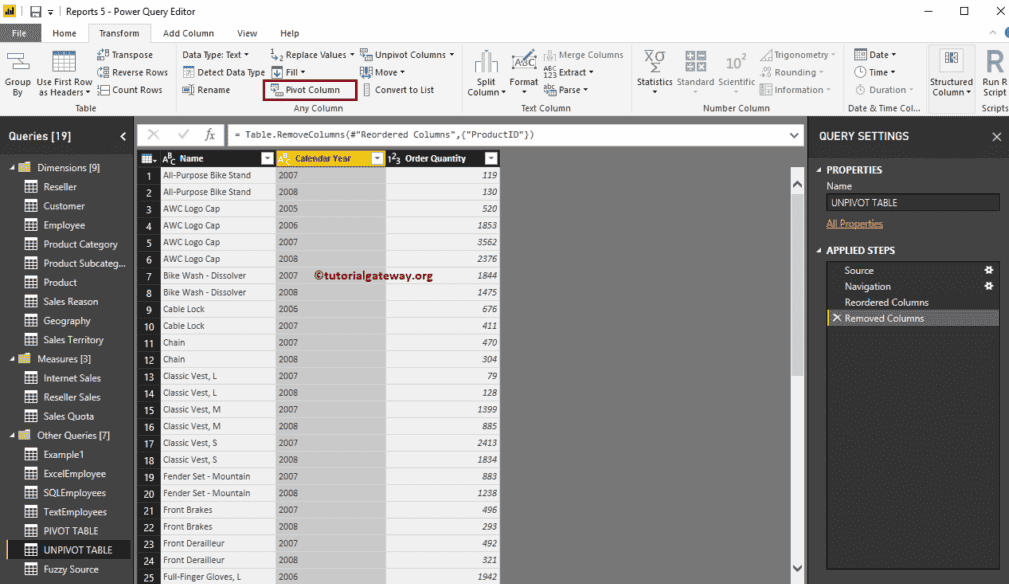
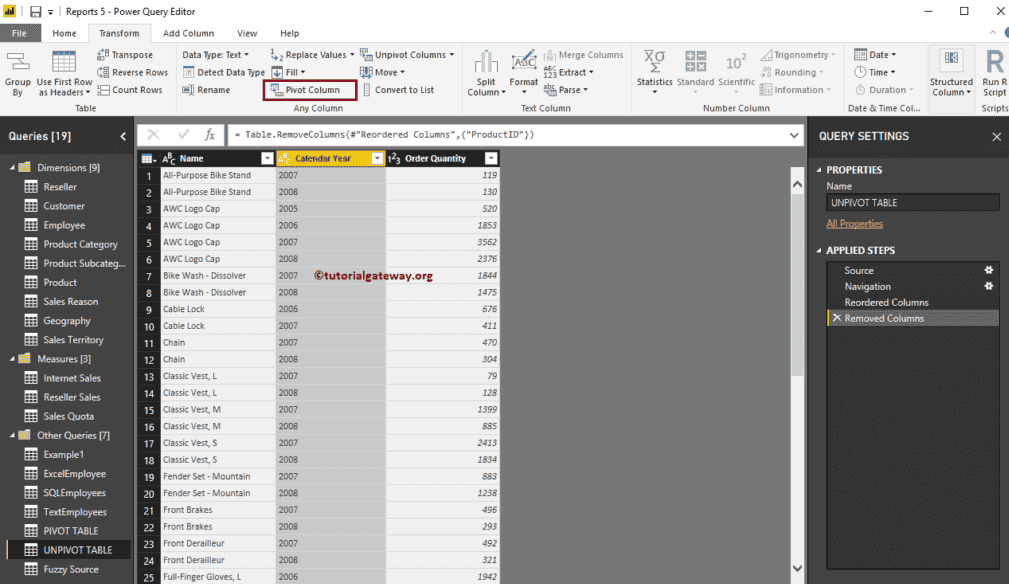
To convert the unpivot table into a pivot table, go to Transform Tab. Under this tab, you can find the pivot Column button as shown below.
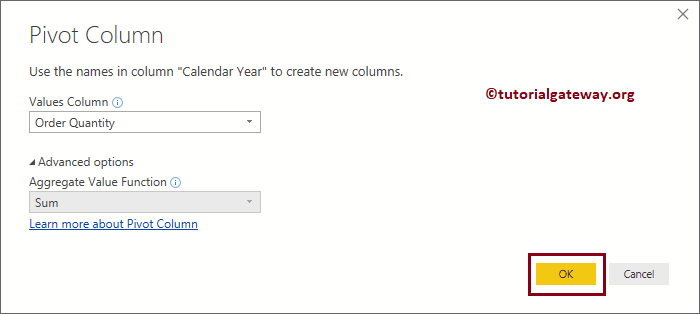
Clicking the pivot Column button opens the following window.
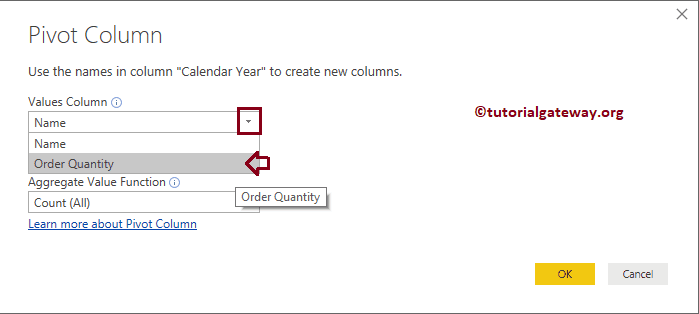
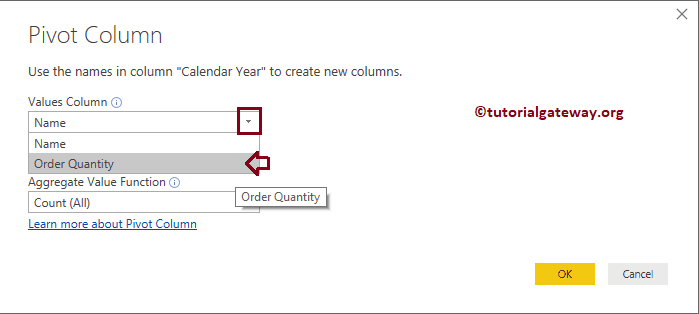
Let me select the Order Quantity as the values column
Next, we selected the Sum as the aggregate function value
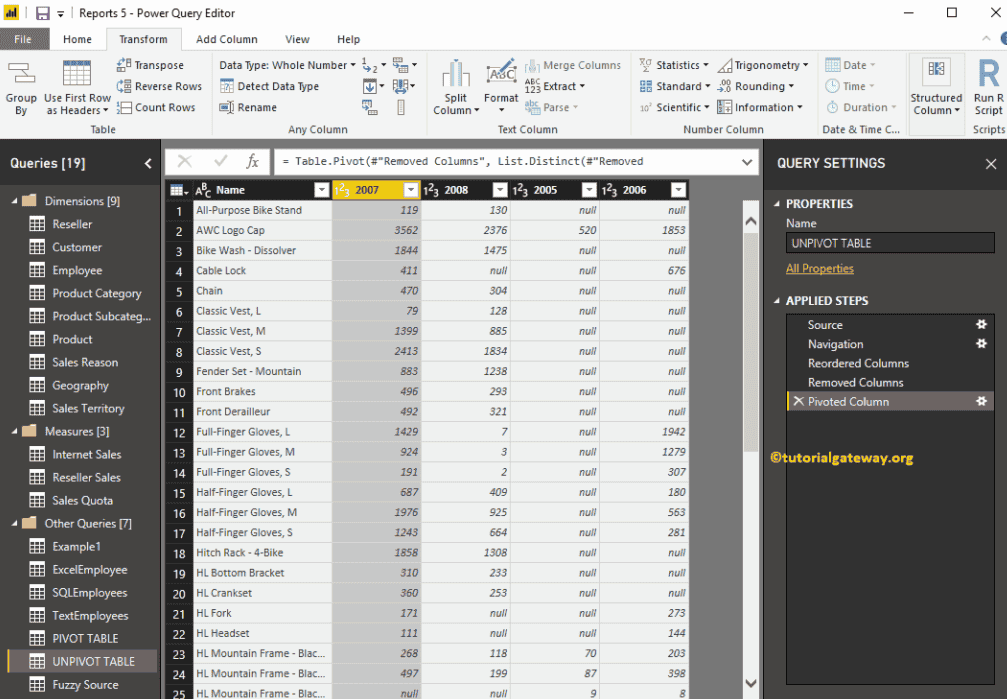
Now you can see the pivot table
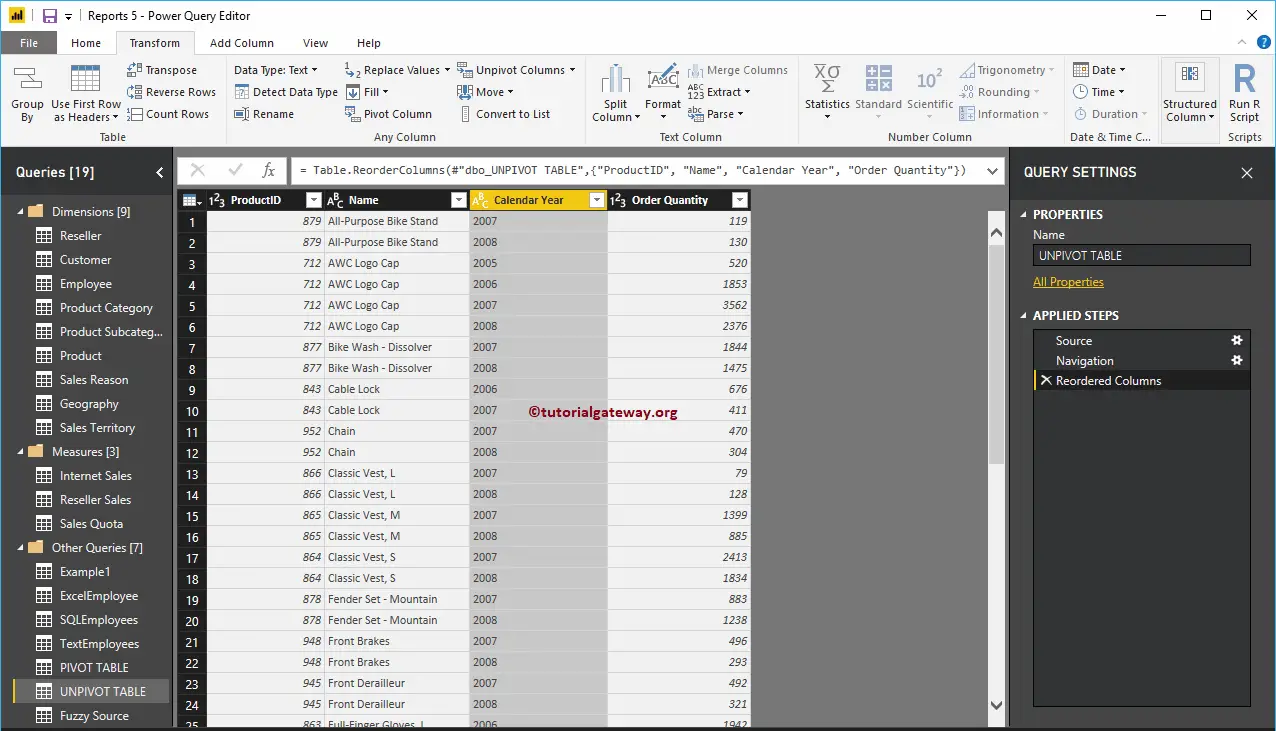
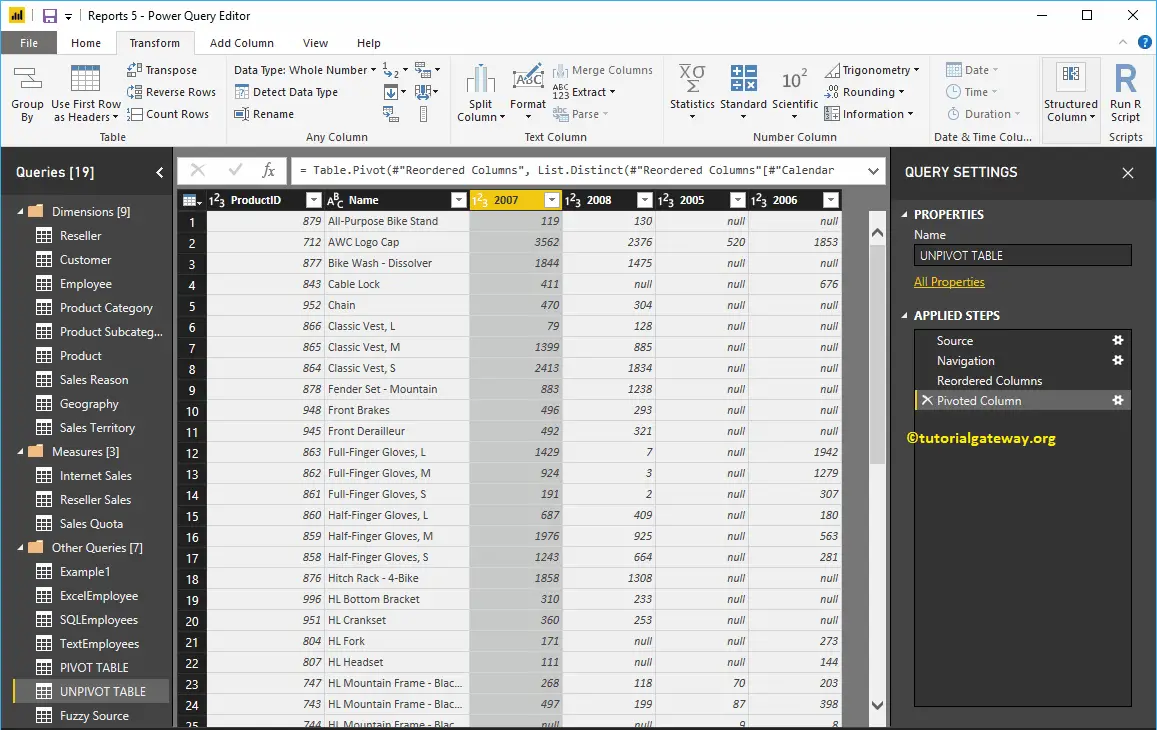
What if your table had more than one static column (a column that won’t change in the pivot process)? For this, we added one more column called Product Id to this table.
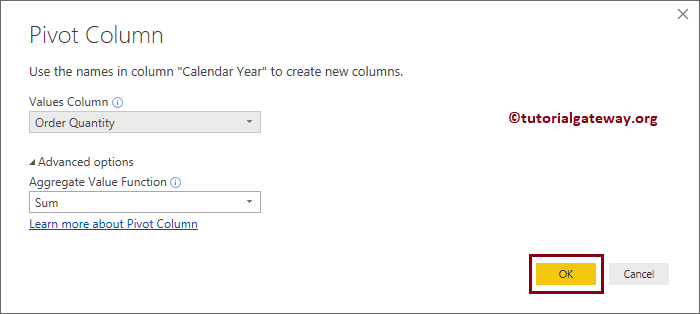
Let me select the Order Quantity column as the values column, and Sum as the aggregate function
Now you can see the Pivot table in Power BI. Remember, having more than one unchanged static column will not make any difference in creating a pivot table.
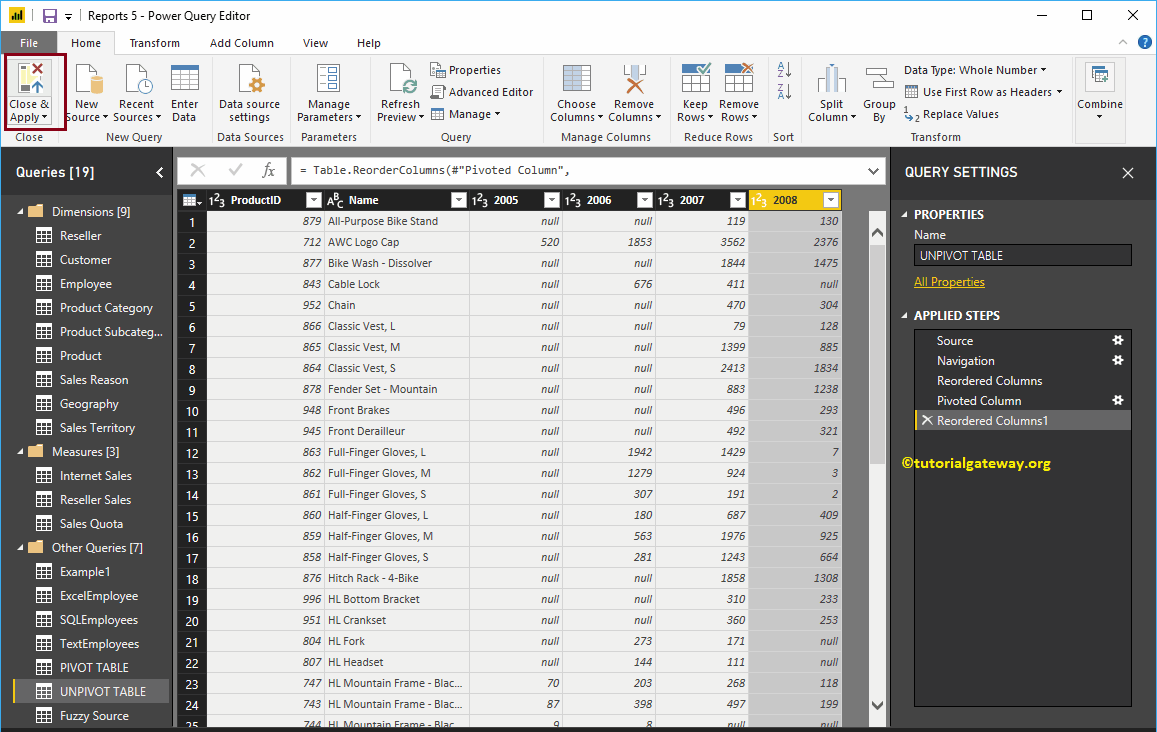
Next, hit the Close & Apply option under the Home tab to apply these changes.
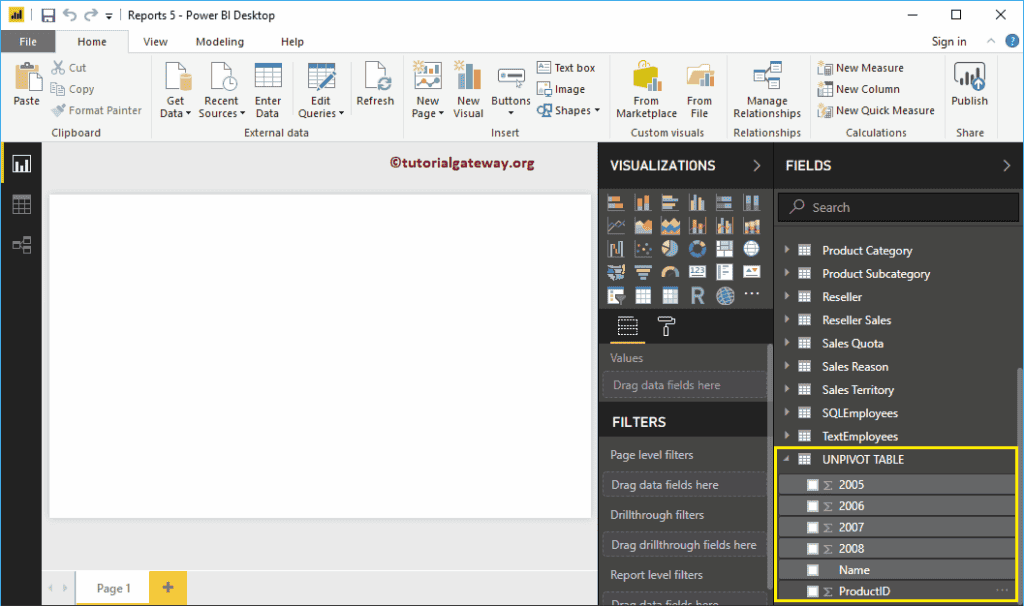
From the screenshot below, you can see the pivot columns.
Create Query Groups in Power BI
This article shows you the steps required to Create Query Groups in Power BI with an example. In general, the tables that we load from the source arranged in alphabetical order. However, in real-time, we might have to group those tables based on the content.
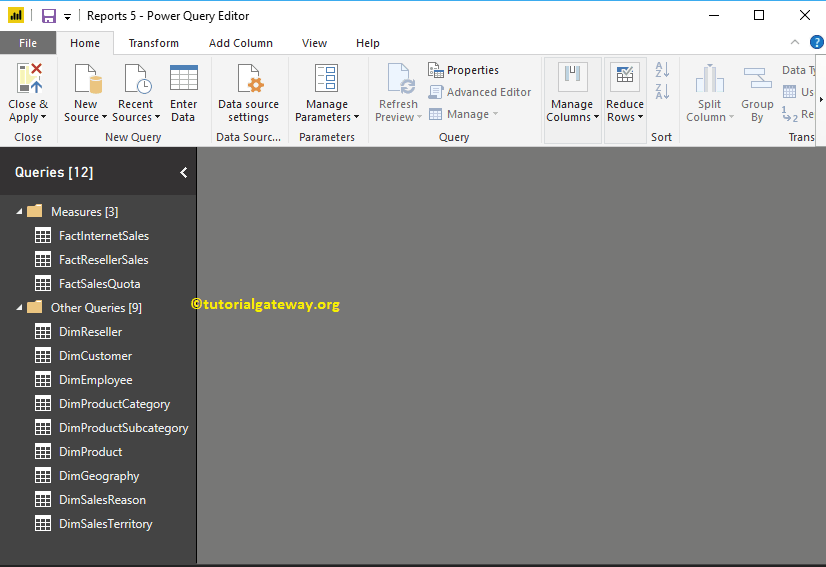
For example, arrange Dimension tables in one group and fact tables as another.
How to Create Query Groups in Power BI
To create the Power BI query group on existing tables, please click the Edit Queries option under the Home tab.
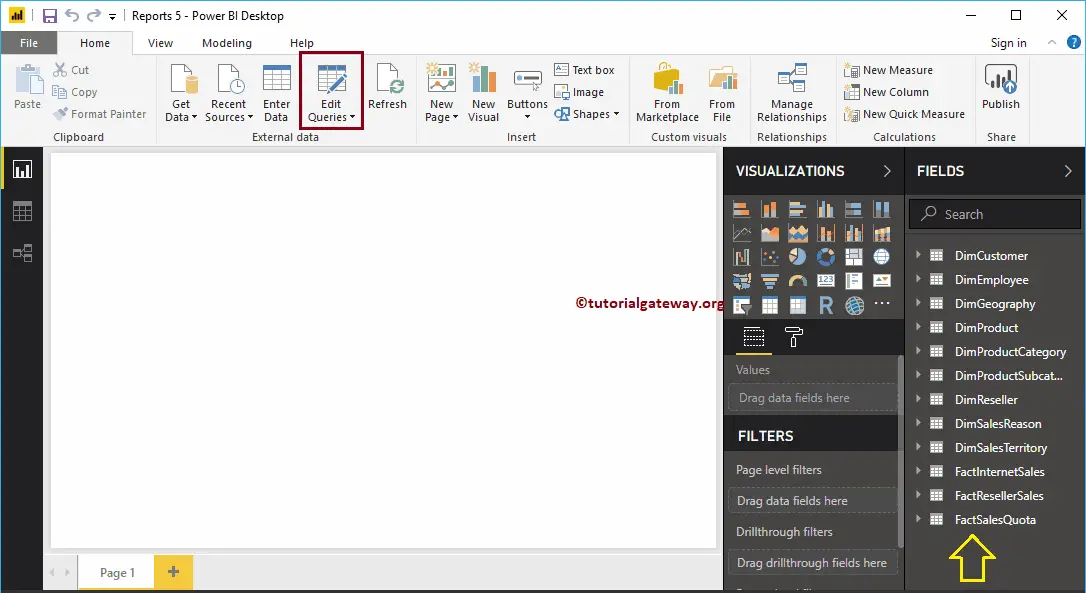
Clicking Edit Queries option opens a new window called Power Query Editor. Under the Power BI Queries section, you can see the list of available tables.
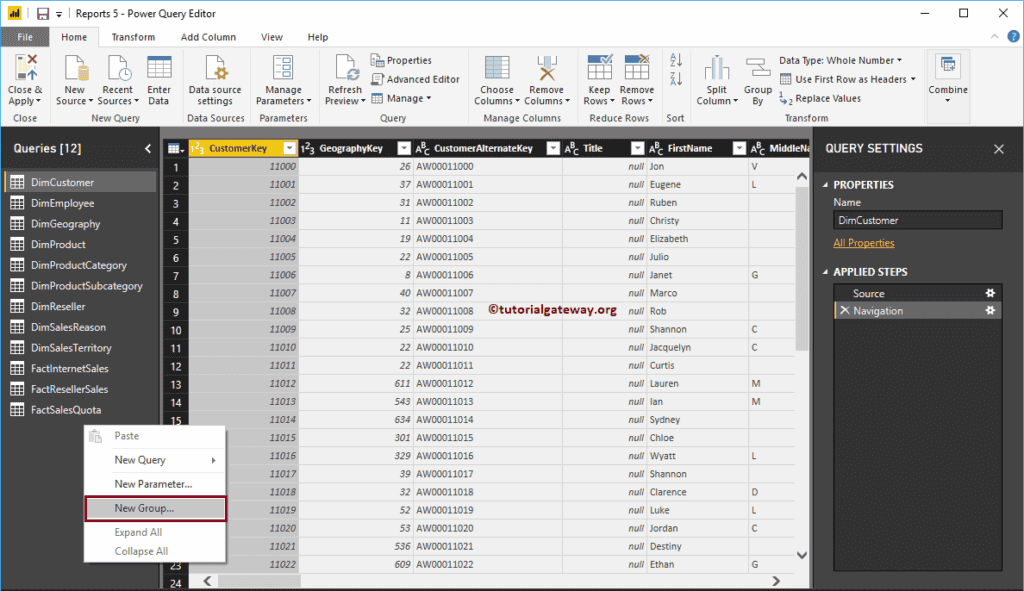
There are a couple of ways to create a new query group
The first approach to Create Power BI Query Group
To create a new query group, right-click on the empty space under the queries section and select the New Group option from the context menu.
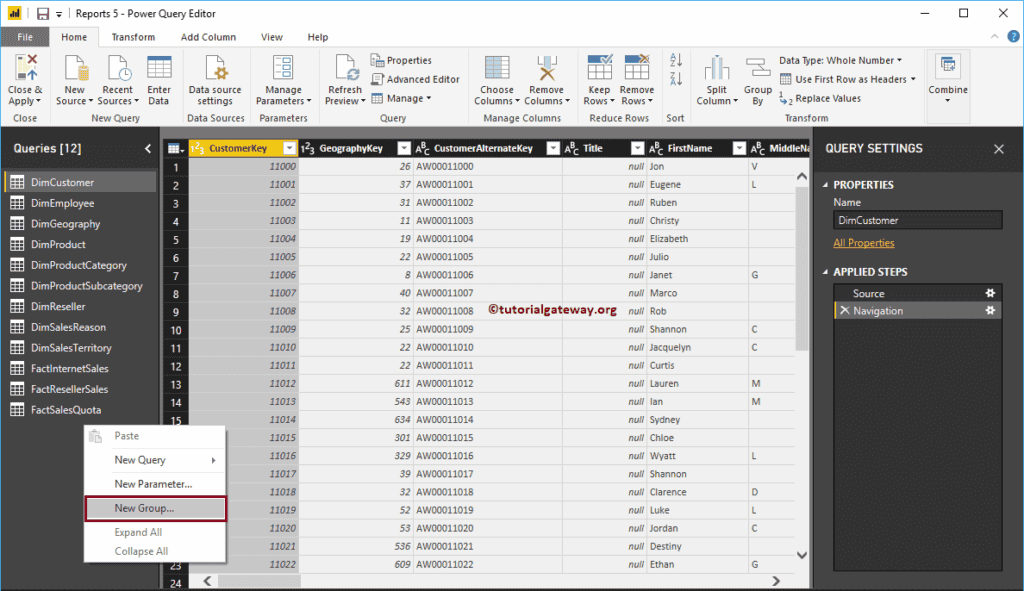
Selecting the New Group option will open the following window. Please specify the Group Name and the description. For now, we are assigning the Dimensions as the Group name.
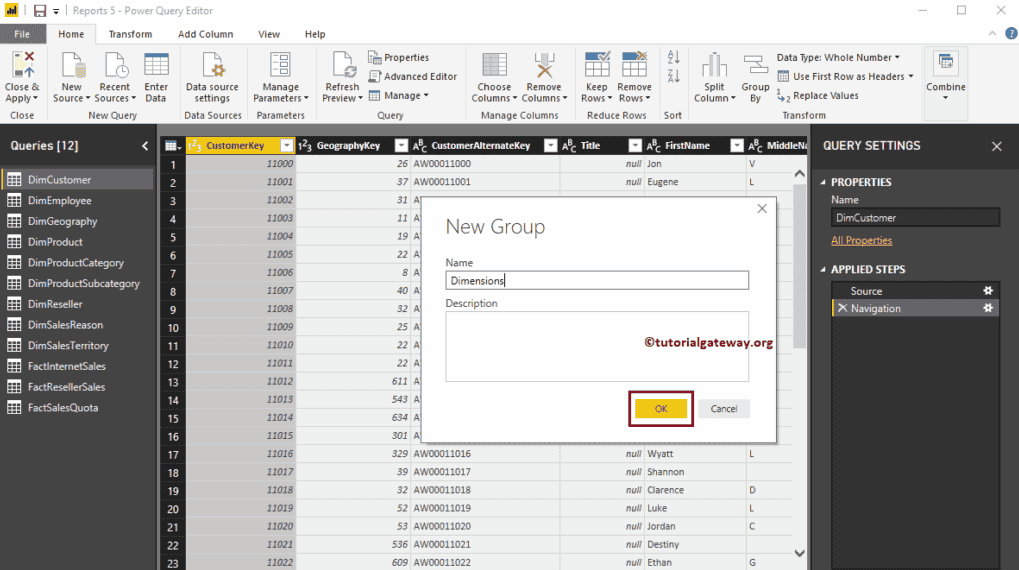
You can see the New folder (Query Group)
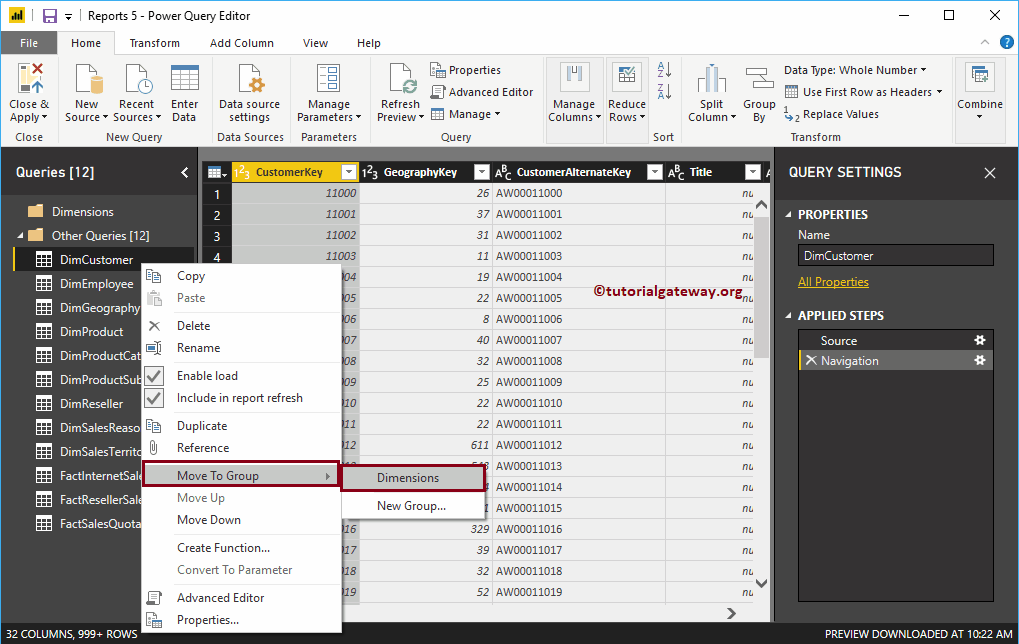
The first approach to add Tables to Query Groups in Power BI
Right-click on the table that you want to add opens the context menu. Please select the Move to Group option, and then select Group Name, i.e., Dimensions.
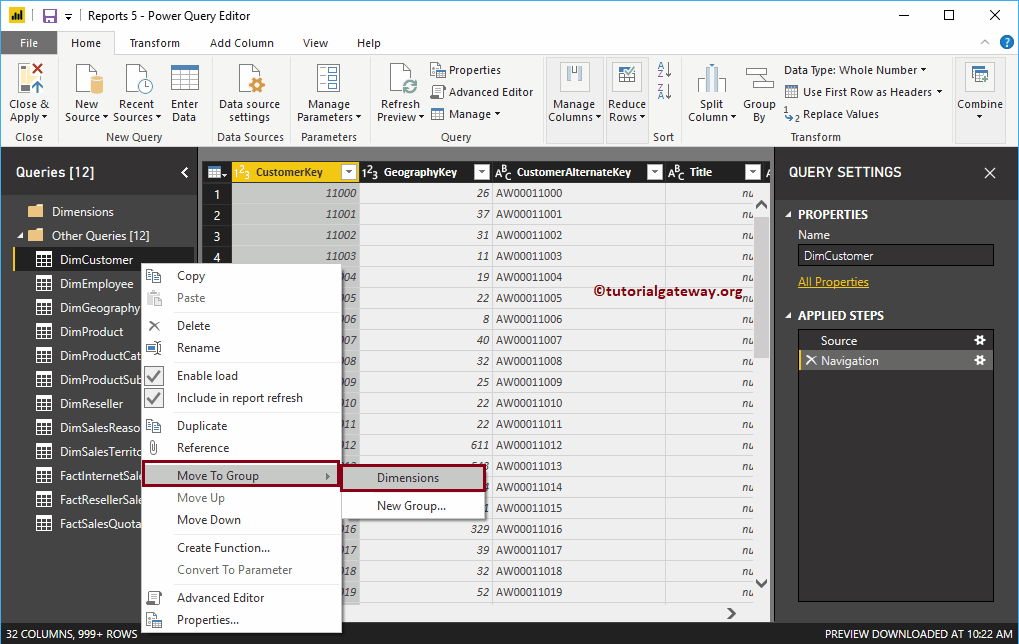
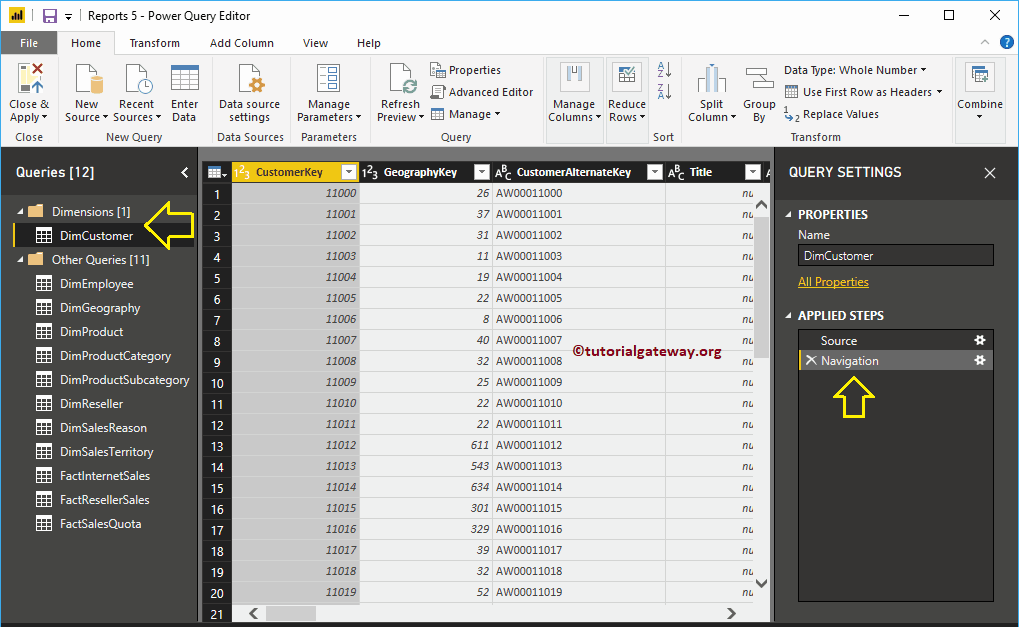
Now you can see the DimCustomer table under the Dimensions group
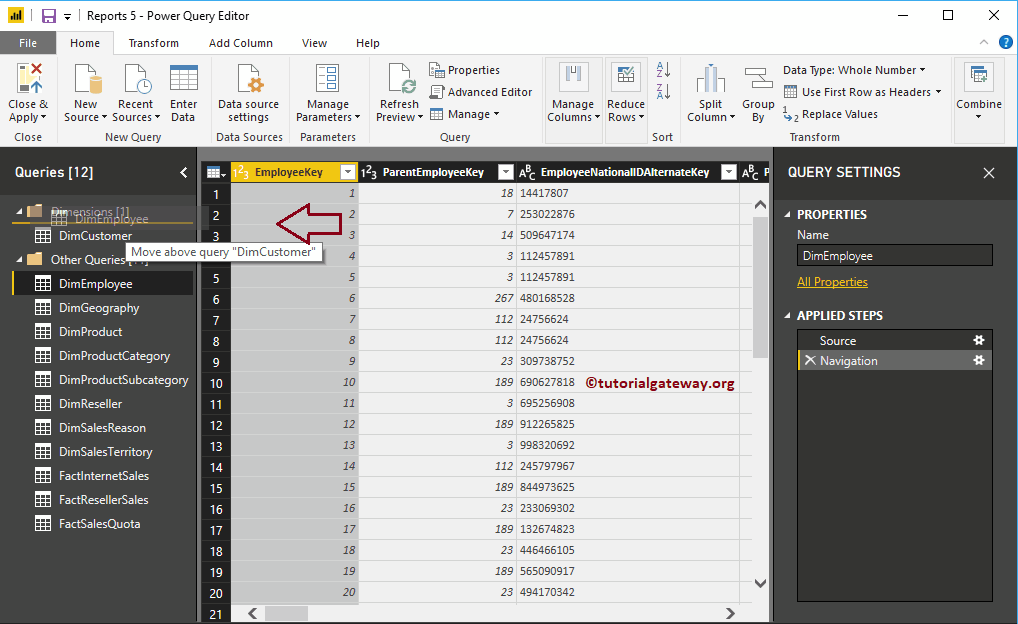
The second approach to add Tables to Query Groups in Power BI
Drag the required table, and Drop under the Query group automatically add that table to the query group. For the demonstration purpose, we are dragging the Dim Employee table to the Dimension group.
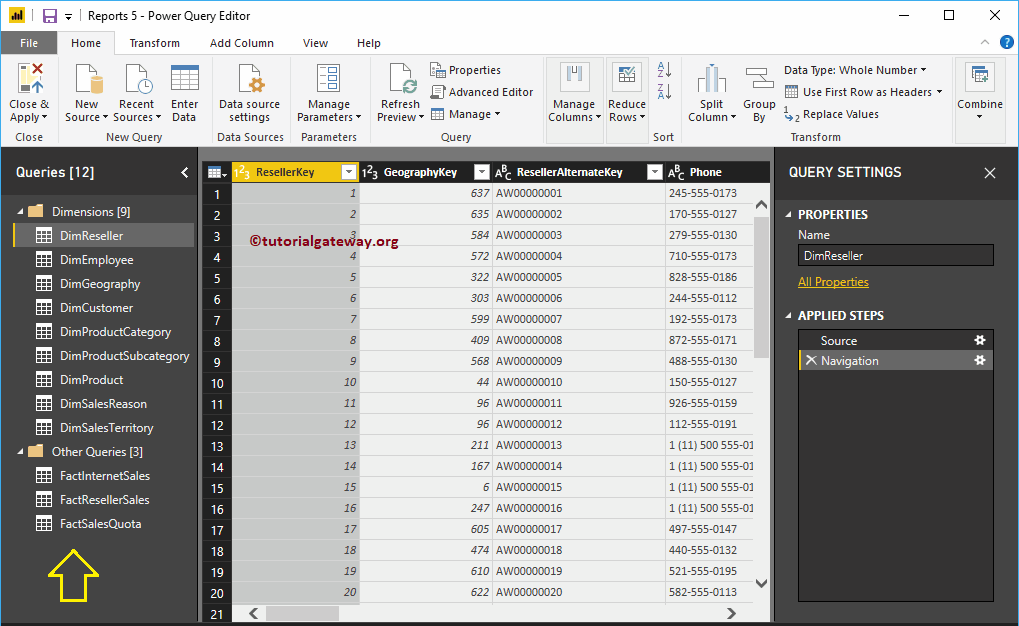
Similarly, we added the remaining dimension tables to the Dimension query group.
The second approach to create Power BI Query Groups
To create a new query group, right-click on any table will open the context menu. Please select the Move to Group option, and then select the New Group option.
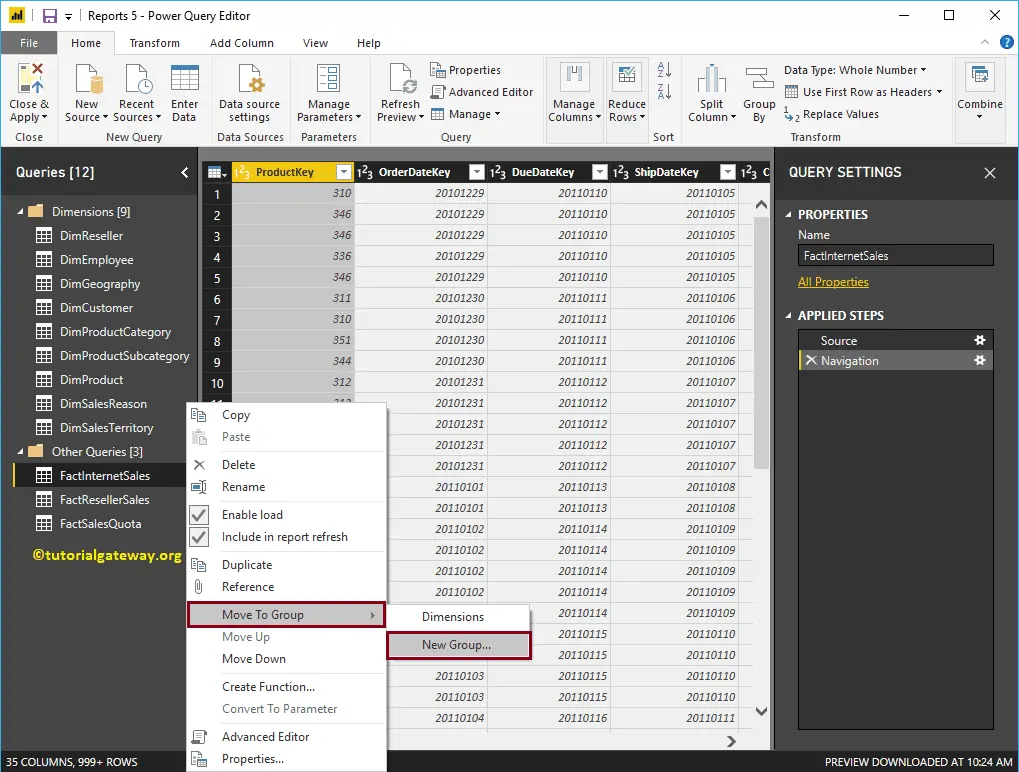
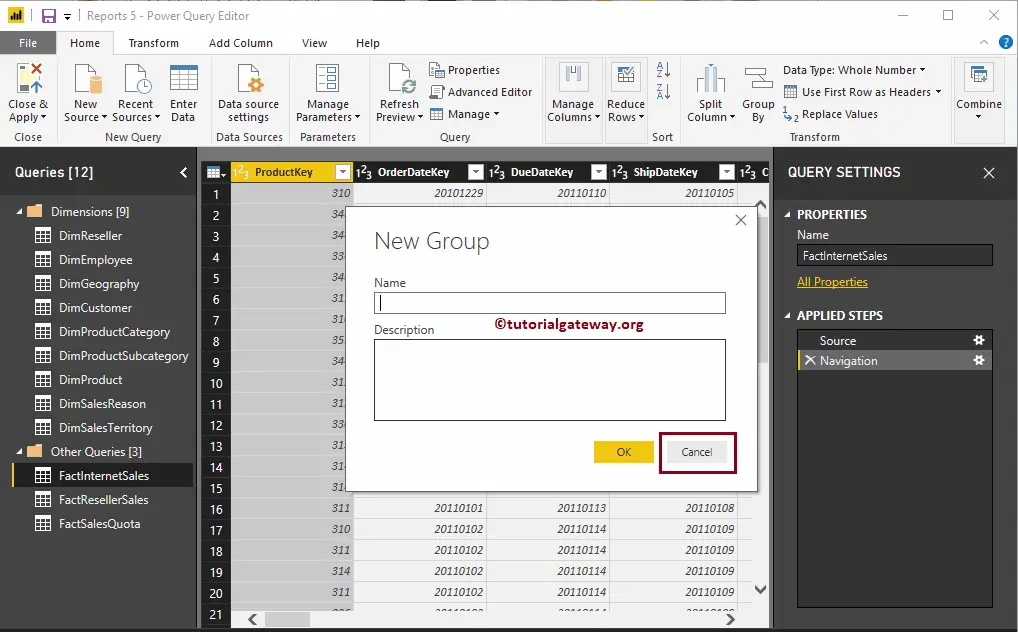
Selecting the New Group.. option will open the following window. For now, we are assigning the Group name as measures.
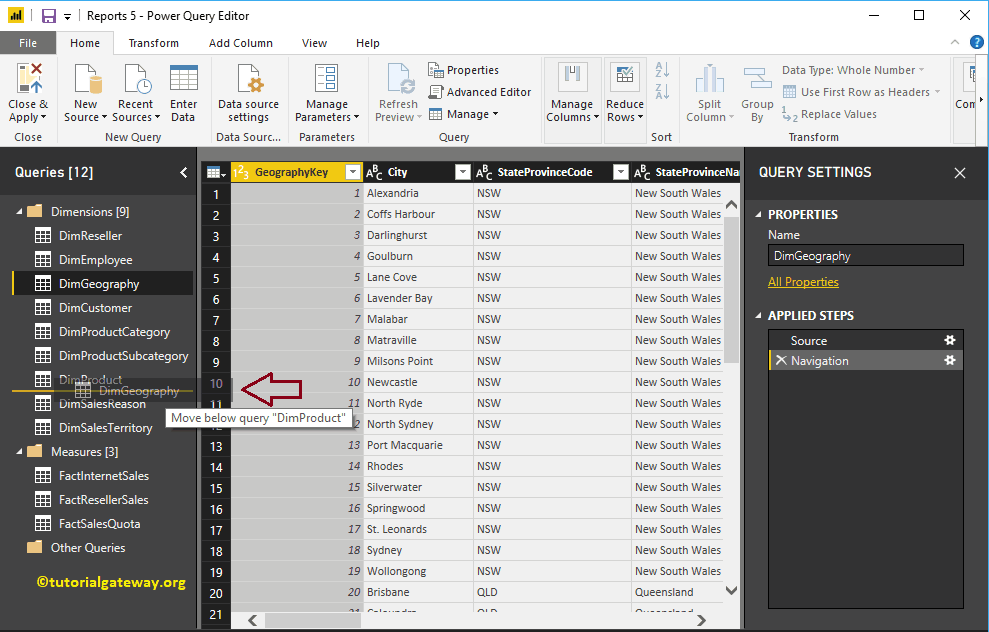
Rearranging tables in a Power BI Query Groups
By simply moving the table up and down will change the table position.
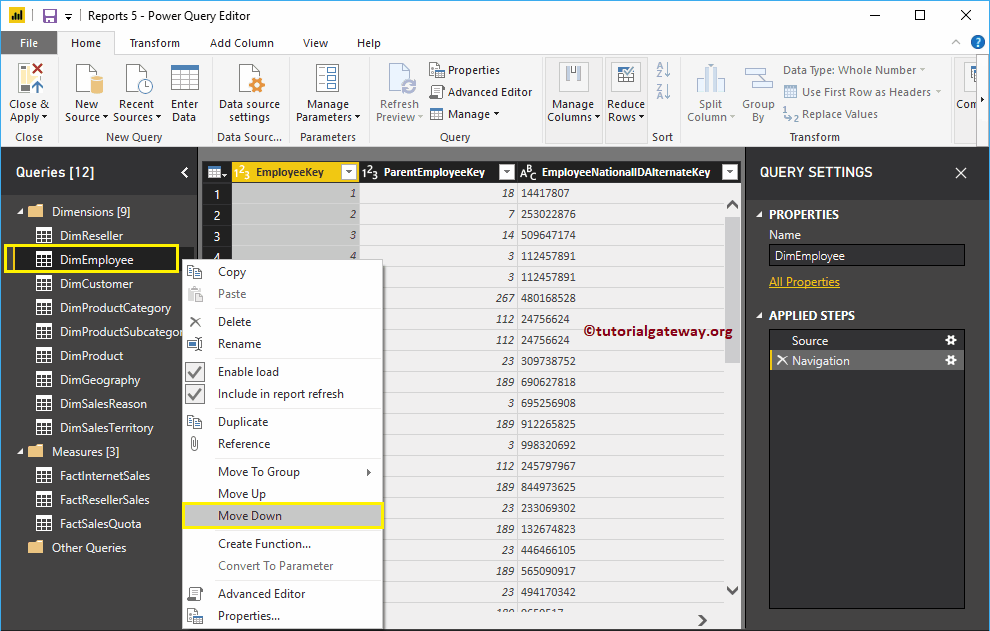
Alternatively, right-click on the table that you want to move will open the context menu. Please select the Move Down or Move Up option. For the demonstration purpose, we moved Dim Employee table to down.
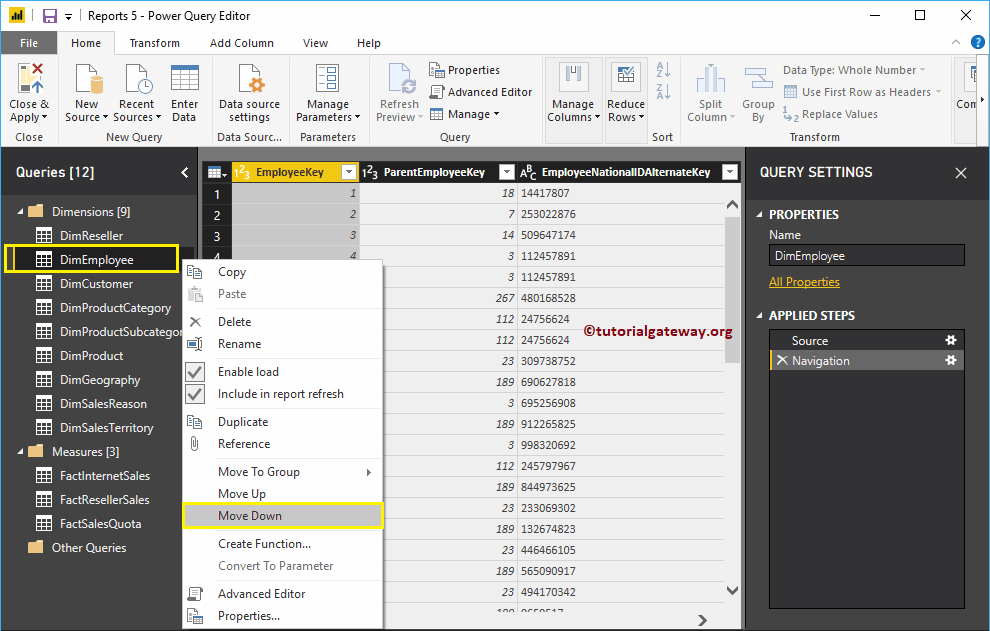
Now you can see the Dim Employee table in the third position.
Delete Query Groups in Power BI
To delete the existing query group, right-click on the group name will open the context menu. Please select the Delete Group option.
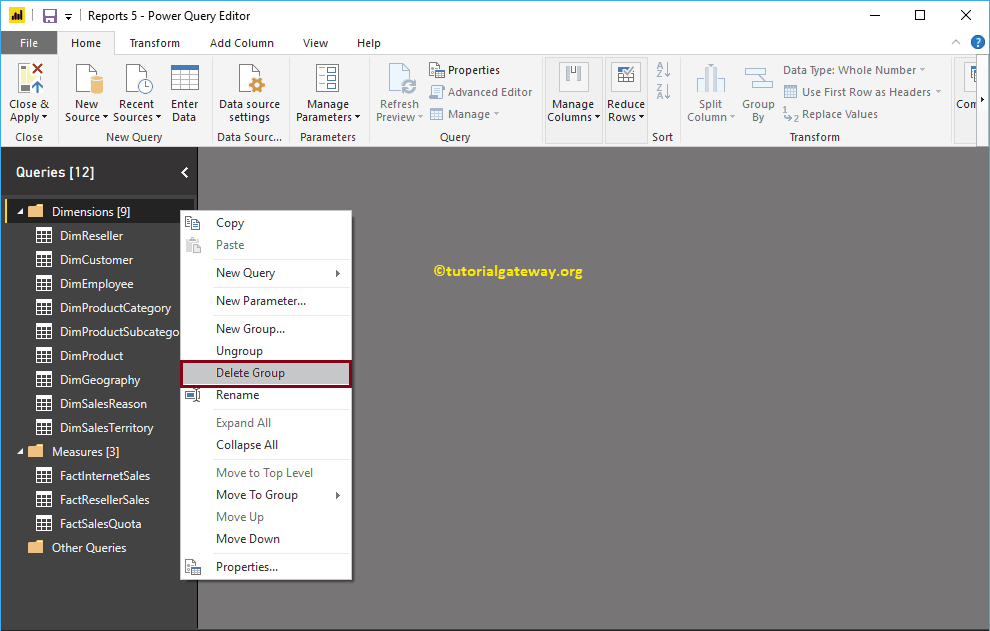
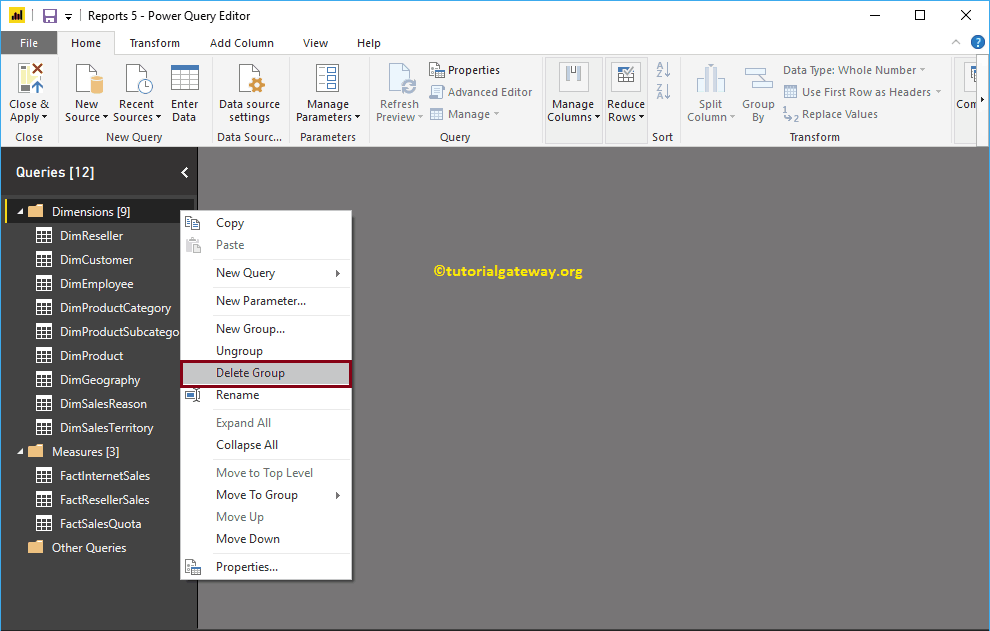
Selecting the Delete Group option opens the following message box. For now, we are clicking the Cancel button
How to Ungroup existing Query Groups in Power BI
To ungroup or remove the existing group, right-click on the group name and select Ungroup option from the context menu.
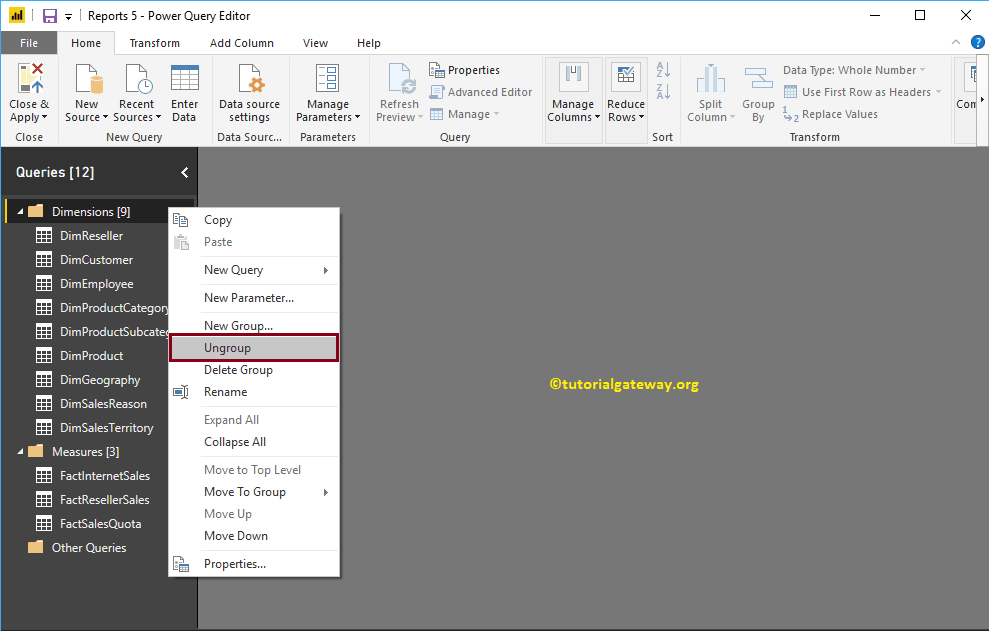
Now you can see that the Dimensions group removed.
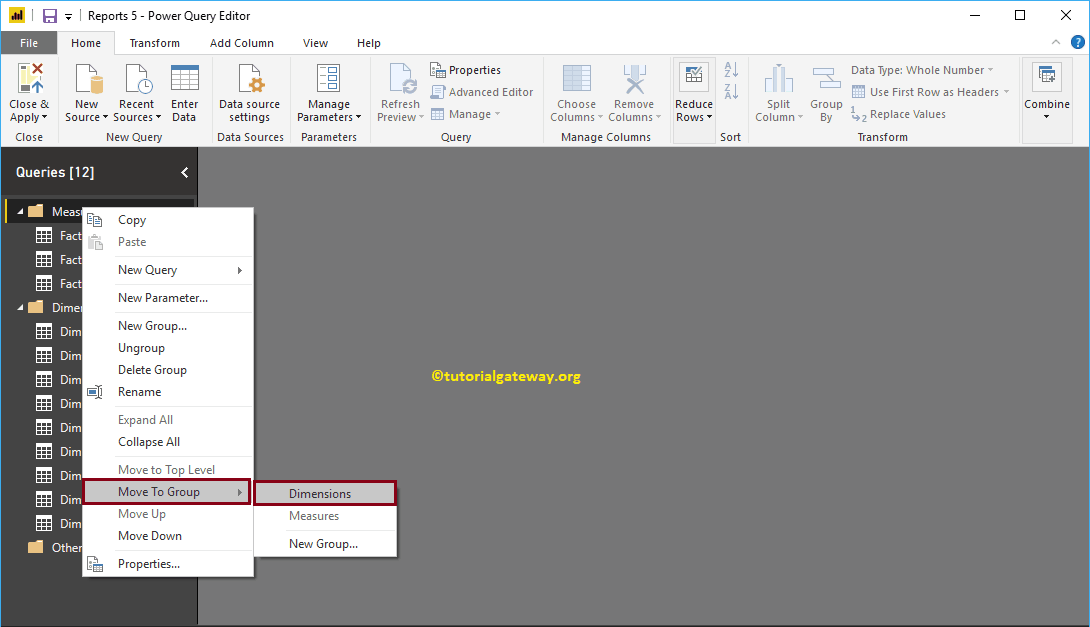
Nested Query Groups in Power BI
To add one group inside another group, right-click on the group name opens the context menu. Please select the Move to Group option and then select the Master Group name, i.e., Dimensions.
Now you can see that the Measures Group Nested inside the Dimensions group.
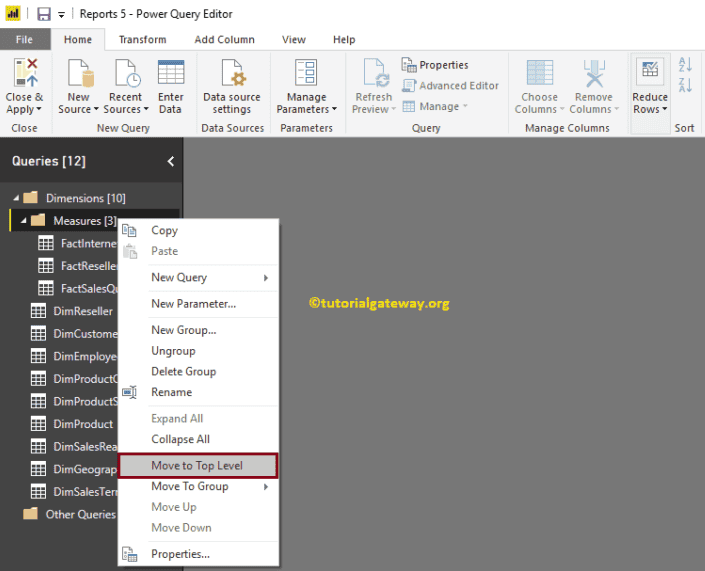
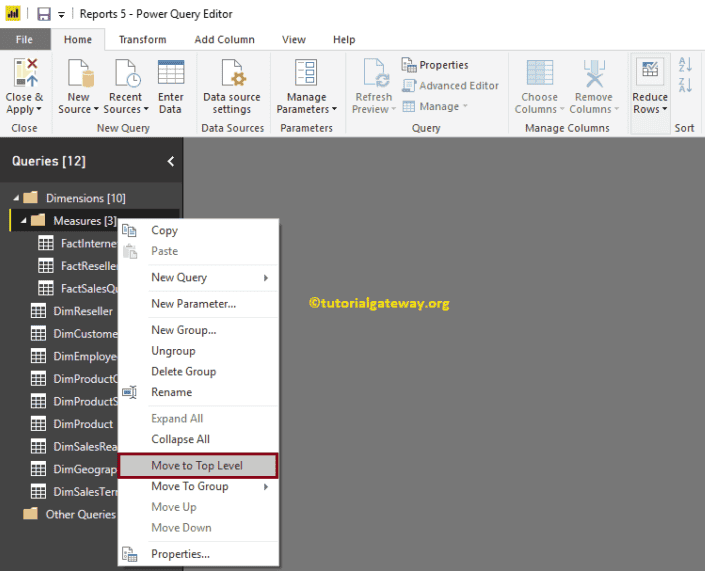
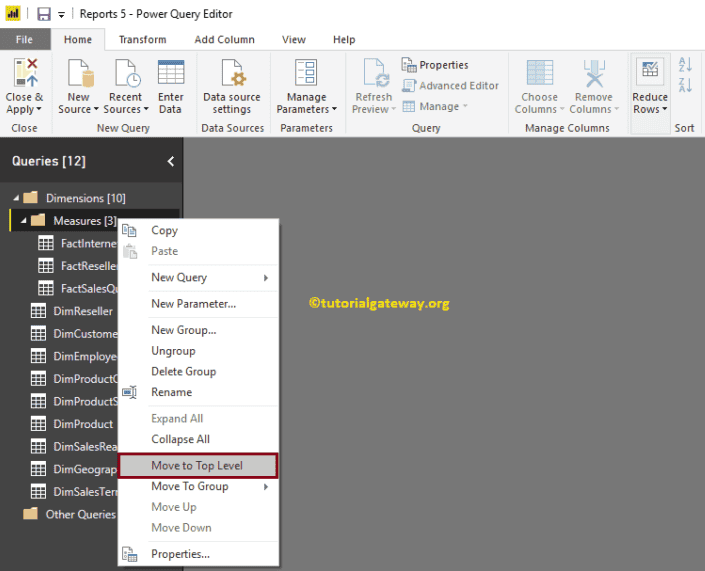
You can undo this by right-clicking the group name and selecting the Move to Top Level option from the context menu
Whatever the changes you made (query groups) won’t affect until you hit Apply. Let me hit the Close & Apply option under the Home tab.
Remove or Reorder Columns in Power BI
Generally, the data that we get from the source might have few columns that may not require for the analysis purpose. Let me show you the steps required to Remove or Reorder Columns in Power BI with an example.
How to Remove or Reorder Columns in Power BI
To reorder columns, or remove unwanted columns from the existing Power BI tables, please click Edit Queries option under the Home tab.
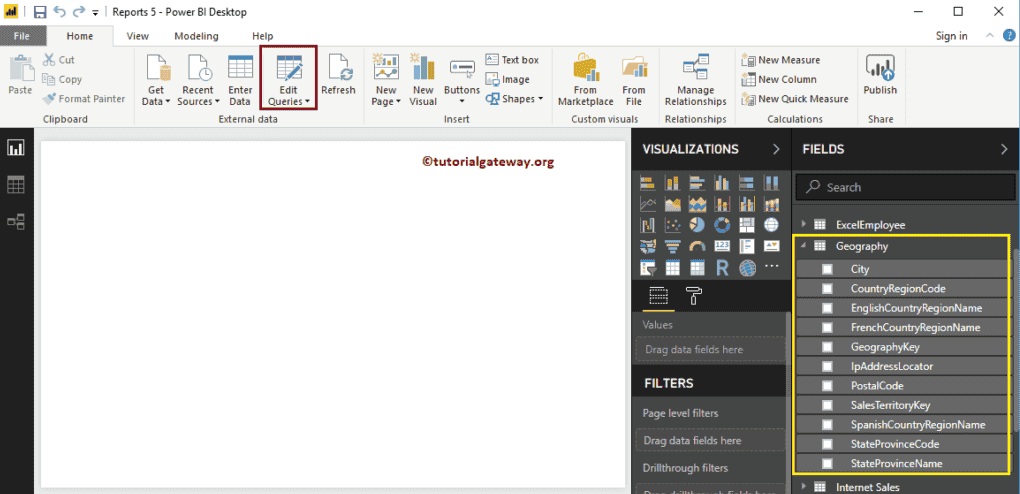
Clicking the Edit Queries option opens a new window called Power Query Editor.
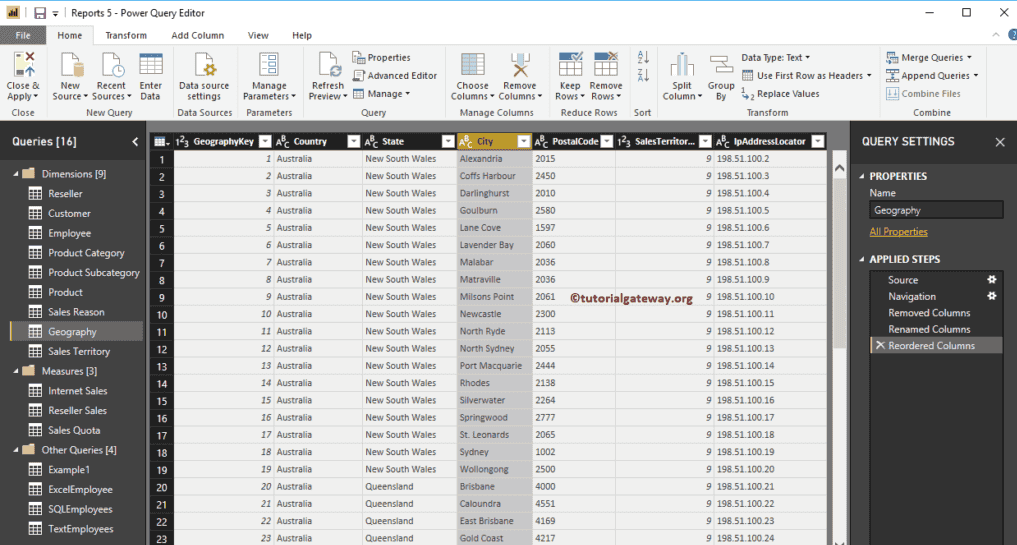
From the below Power BI screenshot, you can see there are State codes, country codes, which are not required for the analysis purpose. So, let me remove those columns from this Power BI Geography table
Remove Columns in Power BI
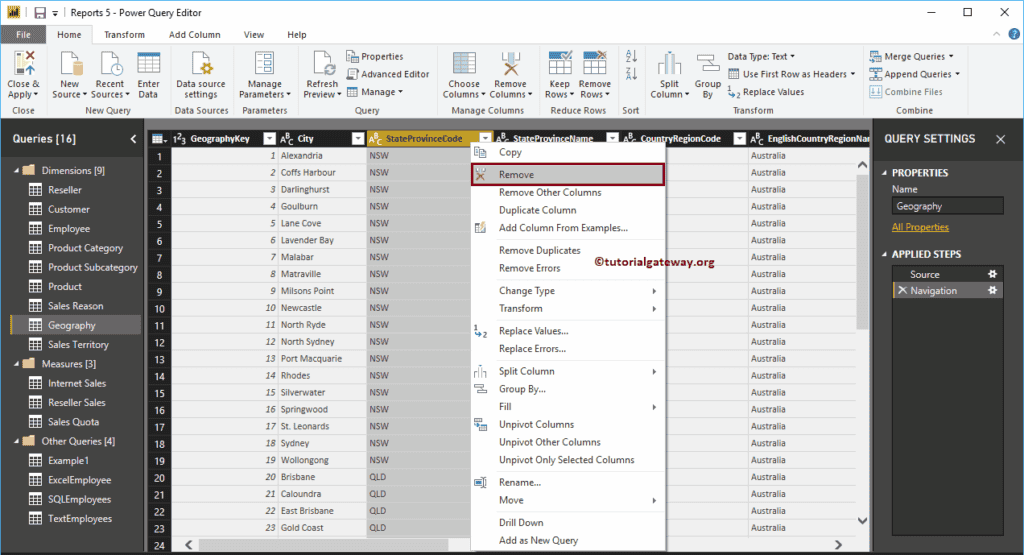
To remove Power BI columns, please select the Column that you want to remove and right-click on it open the context menu. Select the Remove option from the context menu
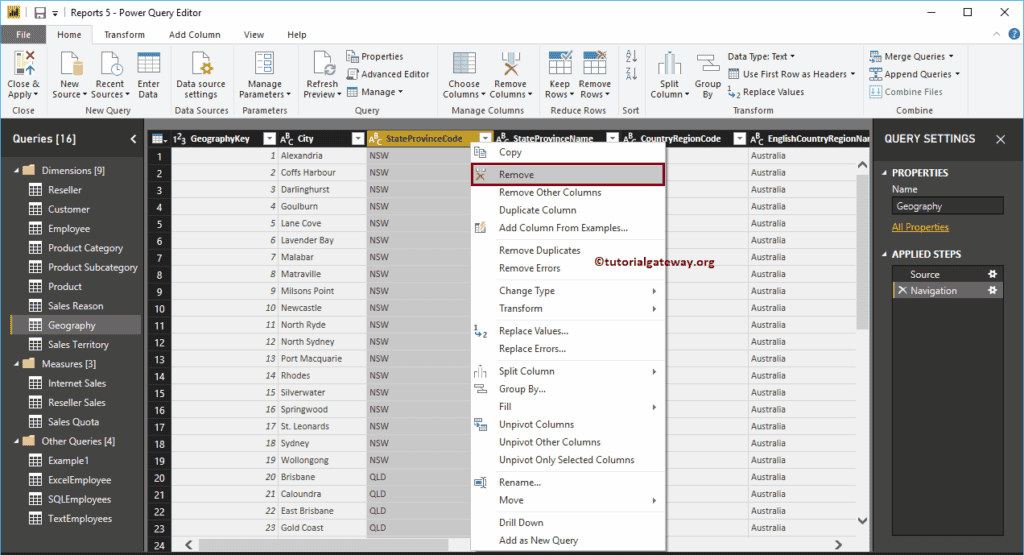
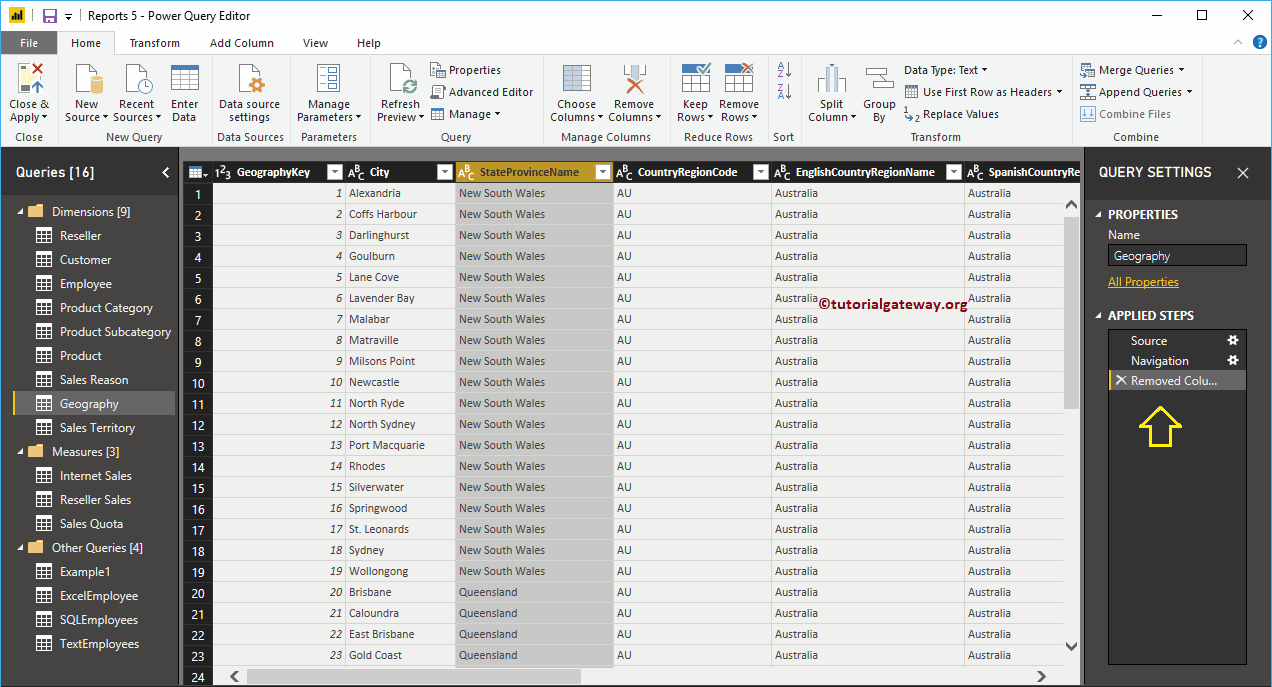
Now, you can see that the State-Province Code column removed from the table. And you can see the same under the Applied Steps section.
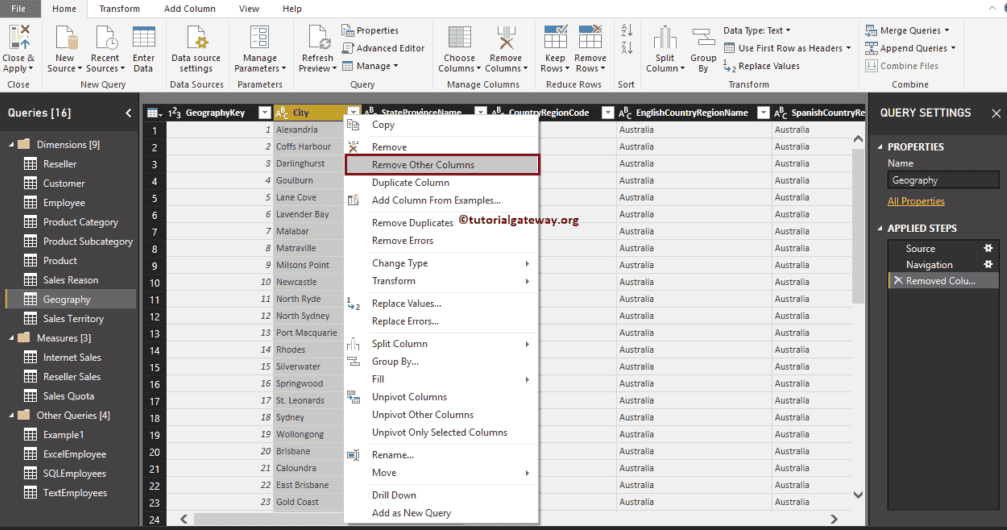
Use Remove Other Columns option to remove all the columns from the table except the selected columns.
For the demonstration purpose, I am selecting City and selected the Remove Other Columns option from the context menu.
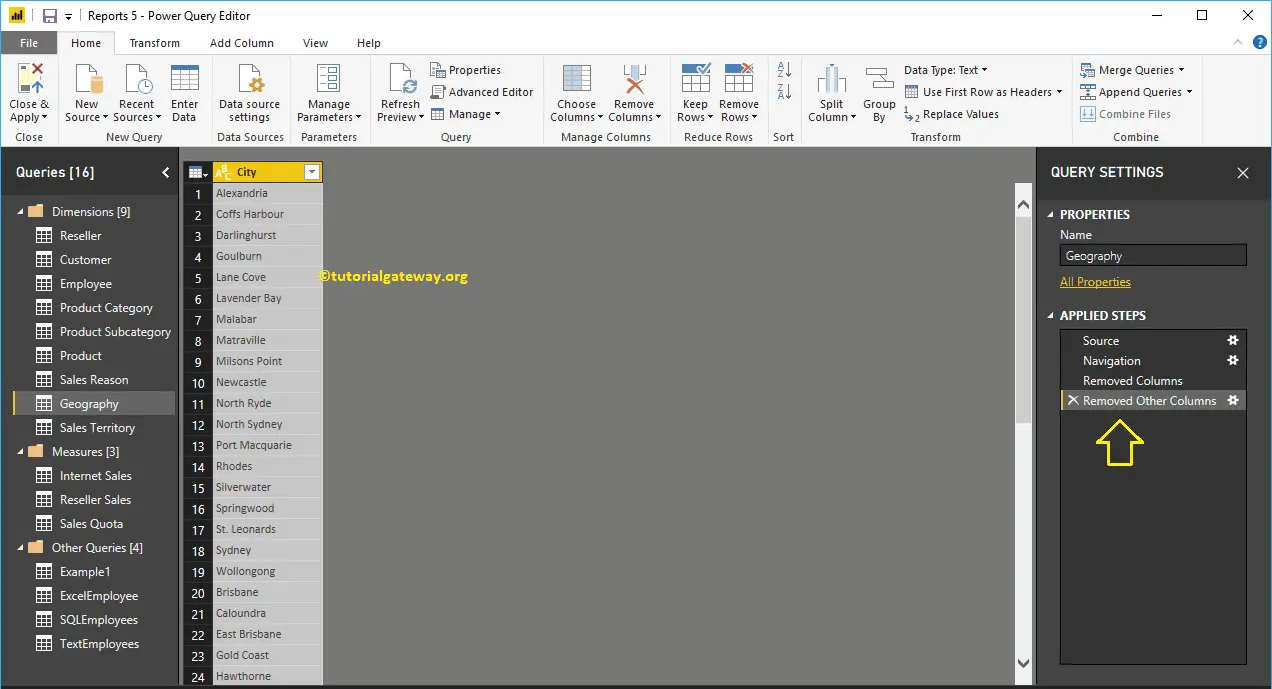
As you can see, all the other columns except City removed from the Geography table.
Alternatively, you can click on the Remove Columns button under the Home Tab
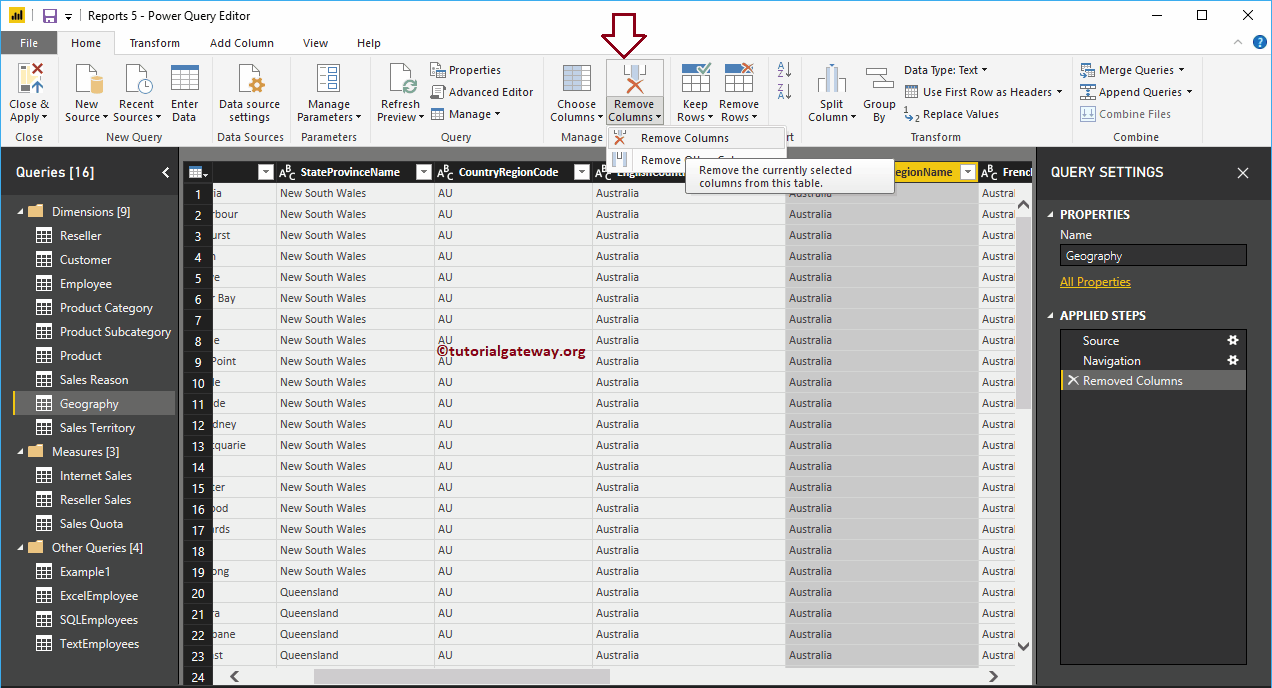
Similarly, we removed the remaining unwanted columns.
Reorder Columns in Power BI
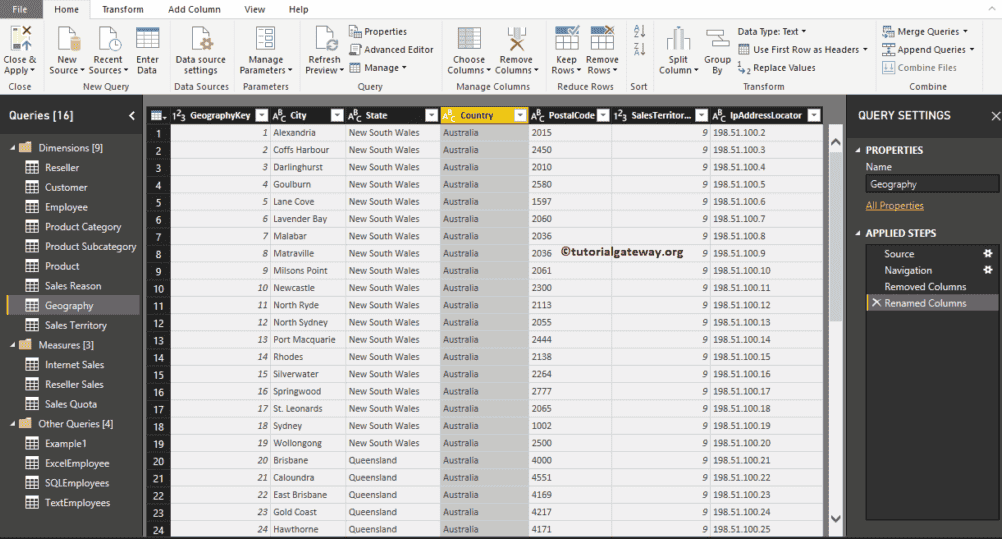
Drag the required column and Drop at the position you want to place. For the Power BI reorder columns demonstration purpose, we are dragging Country Column to the second position (after geography Key).
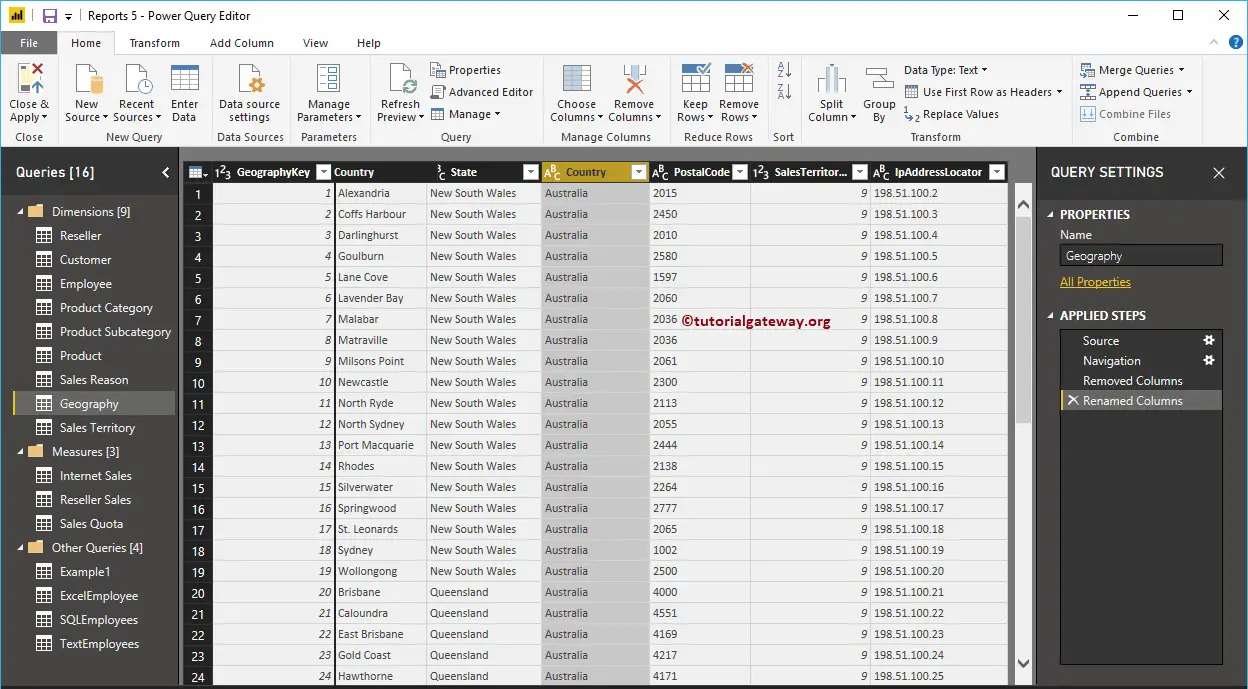
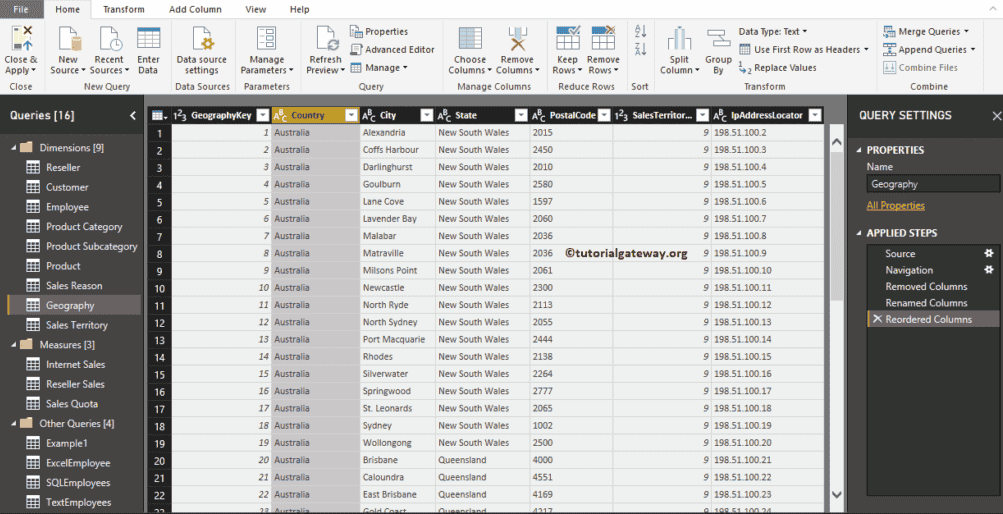
Now you can see the Country names in the second position
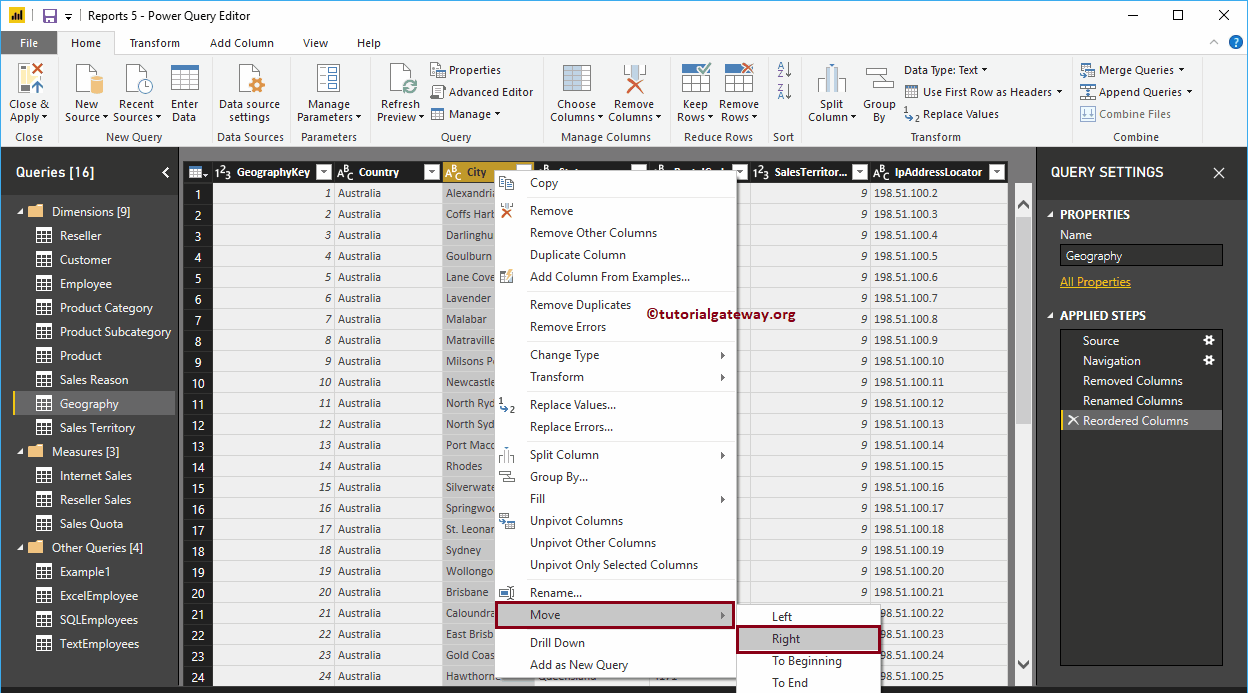
Alternatively, right-click on the column name that you want to move will open the context menu. Please select the Move and then select Right, Left, To End, or To Beginning option
Now you can see the State in the third position. Next, hit the Close & Apply option under the Home tab to apply these changes.
Please wait until the changed are applied
How to Rename Column Names in Power BI
Let us see how to Rename Column Names in Power BI Desktop with an example. Generally, when you load the data from a data source, you get the column names that are available in a data source. While you are designing the report, you might need more meaningful names. In these situations, you can use the Power BI rename column names option.
How to Rename Column Names in Power BI
To demonstrate this Rename Column Names option, we are going to use the Text Employee table that we imported in Enter Data, and altered in split column article.
To rename the column names in an existing table, please click the Edit Queries option under the Home tab.
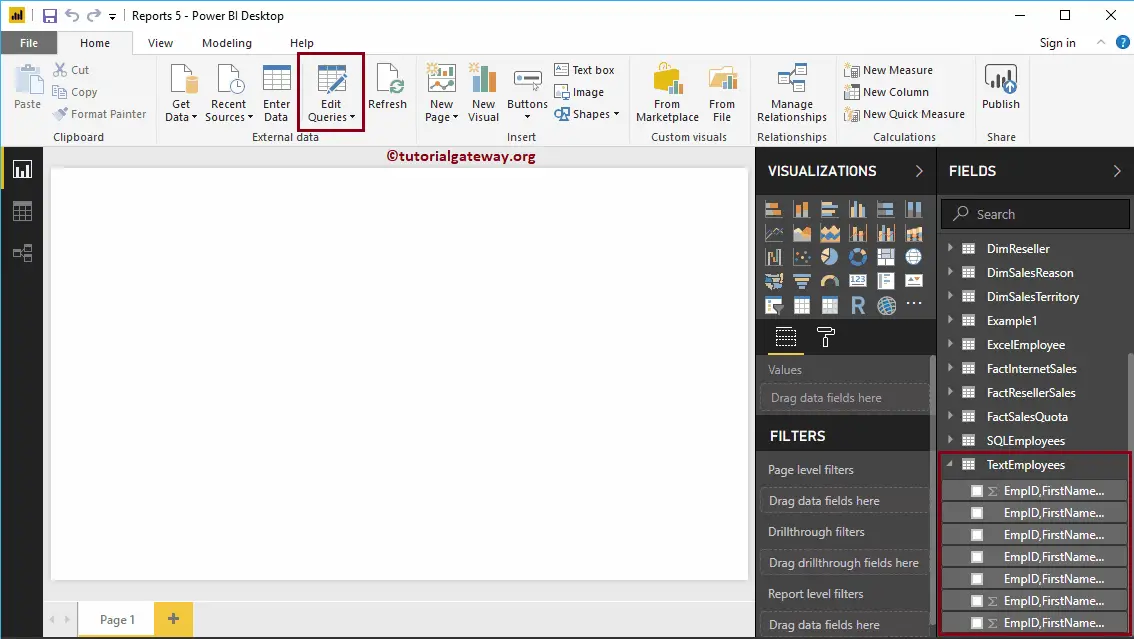
Clicking Edit Queries option opens a new window called Power BI Power Query Editor. From the screenshot below, you can see that the columns in this table have a common name.
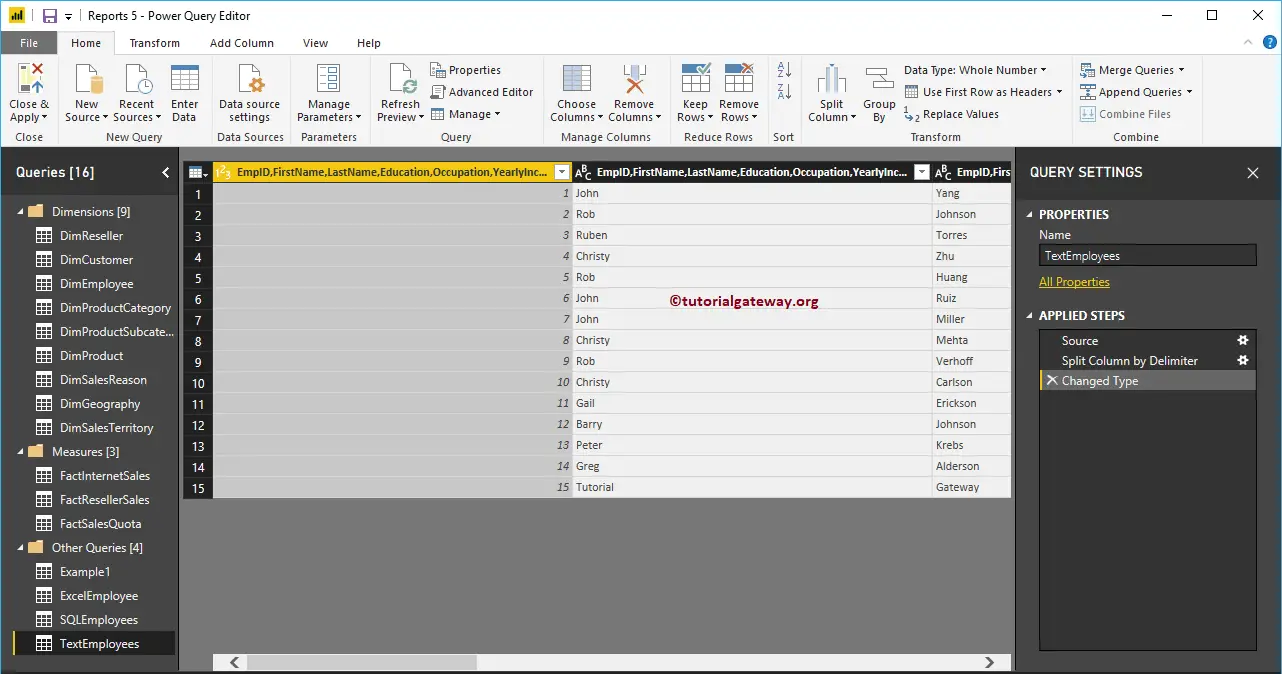
There are a couple of ways to rename column names in Power BI table report
To rename the columns in a table, right-click on the column that you want to rename will open the context menu. Please select the Rename option.
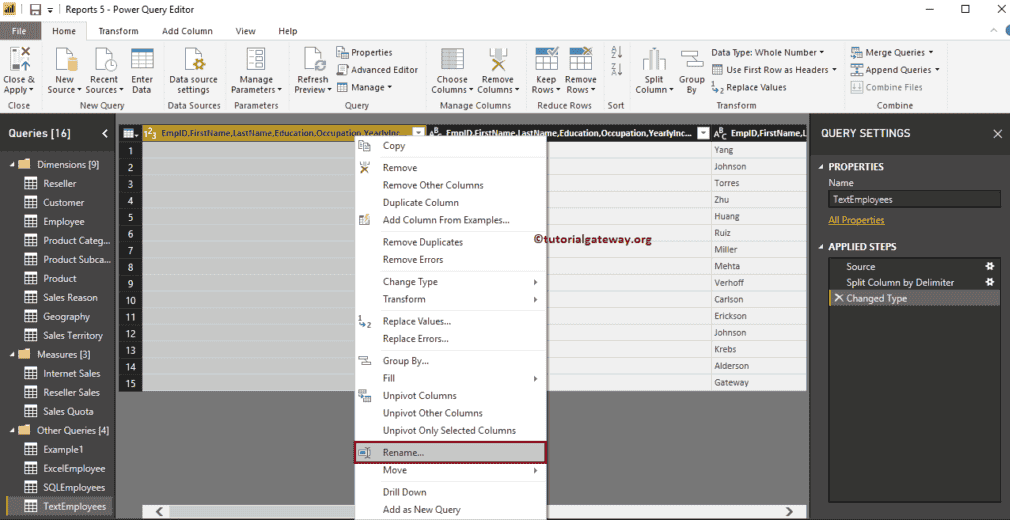
It allows you to rename the column. Let me rename it as EmpID.
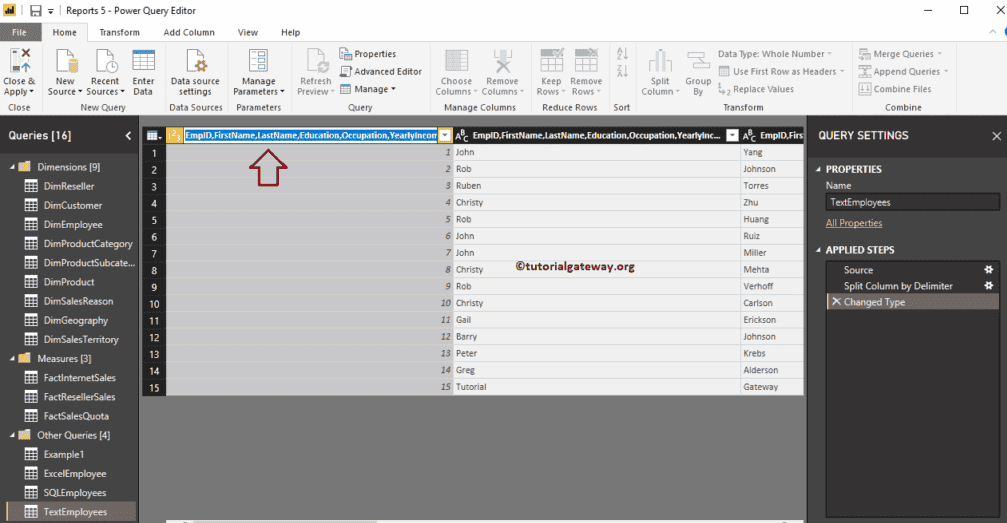
Now you can see the column with EmpID name
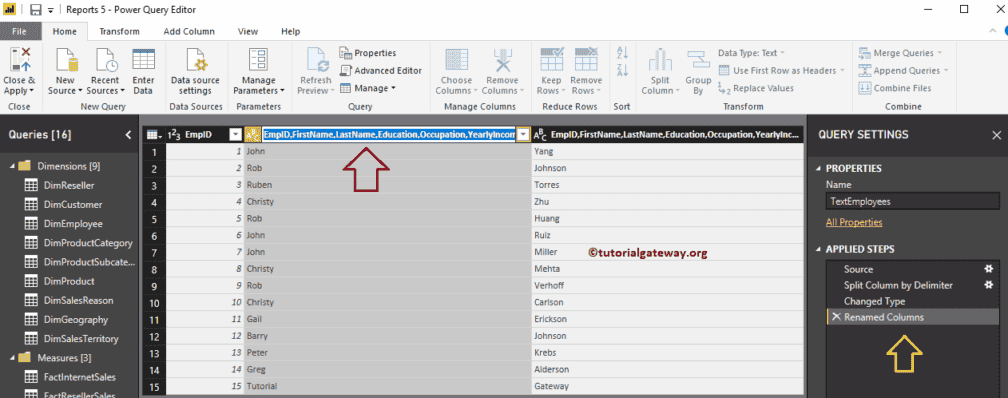
Alternatively, you can double-click on the column header.
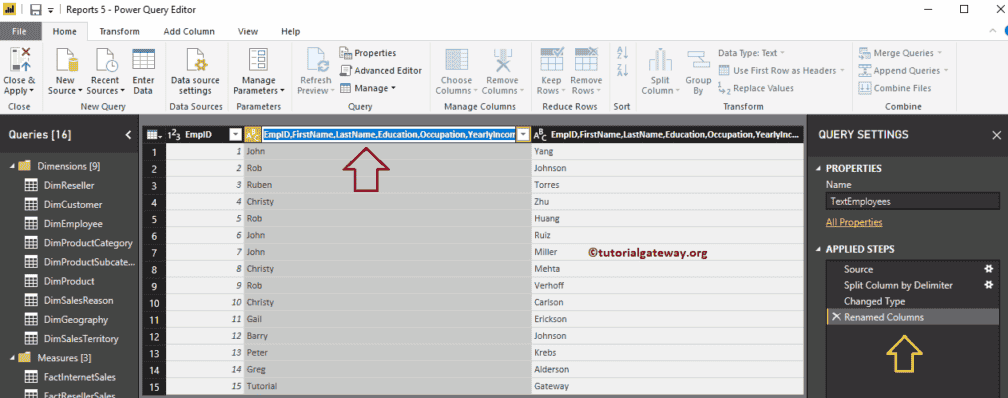
As you can see, we renamed it as the First Name
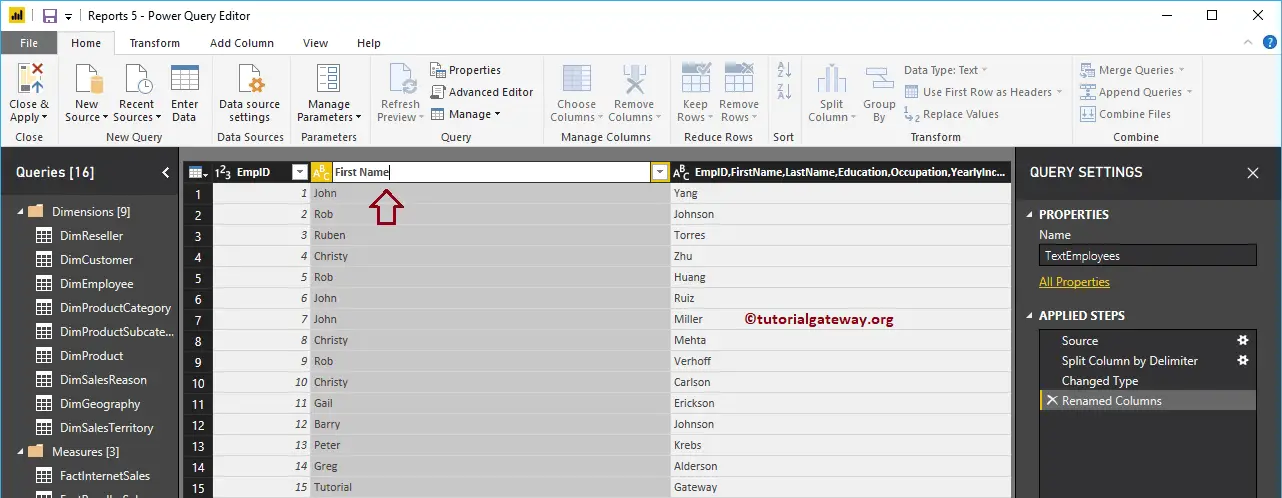
Similarly, we renamed the remaining columns
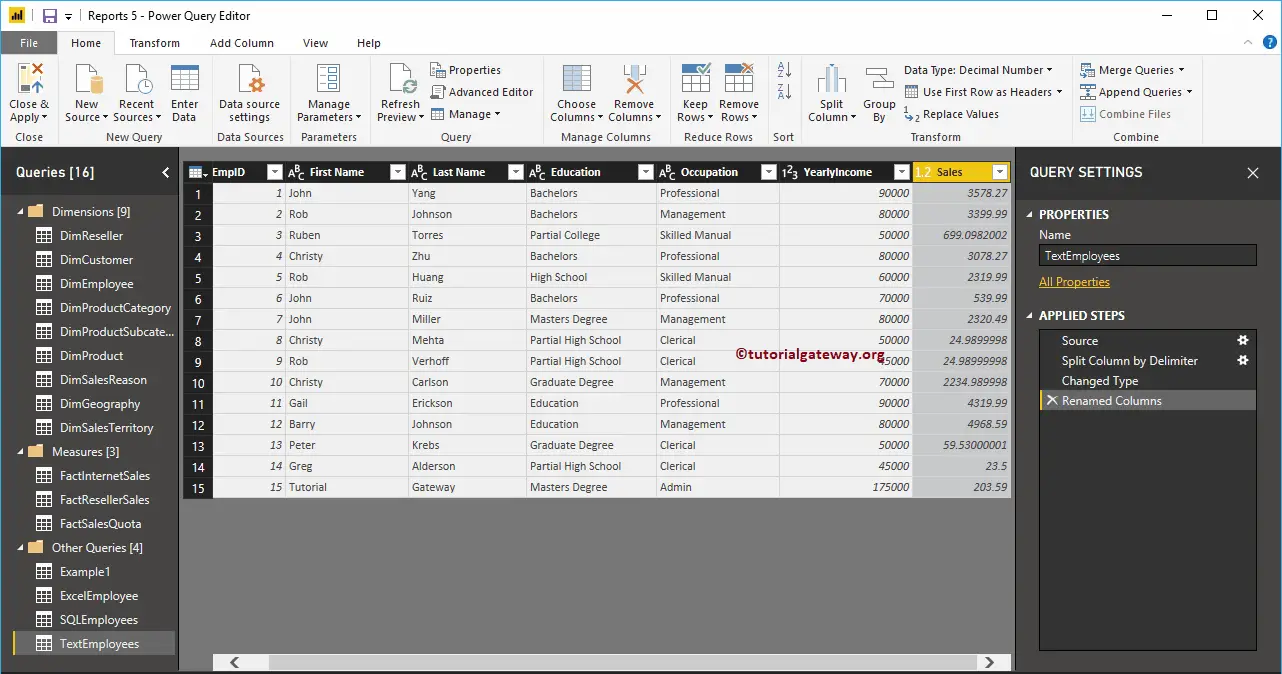
Whatever the changes you made won’t affect until you hit Apply. Let me hit the Close & Apply option under the Home tab.
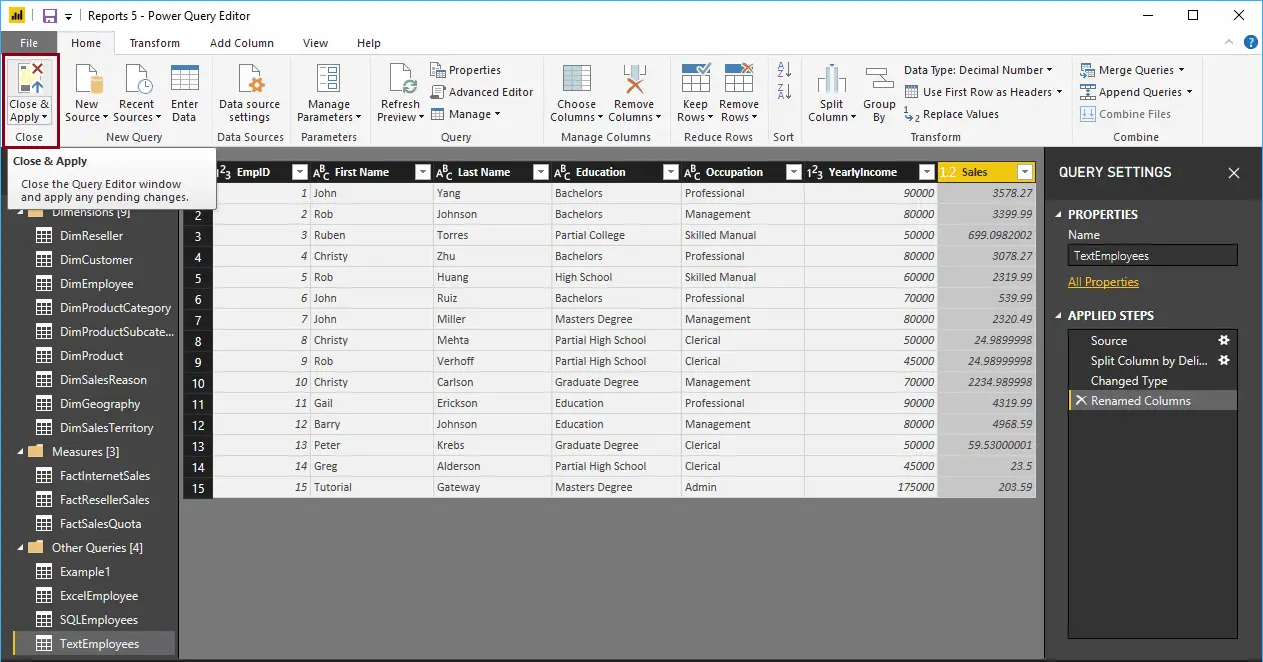
Please wait until the changed are applied
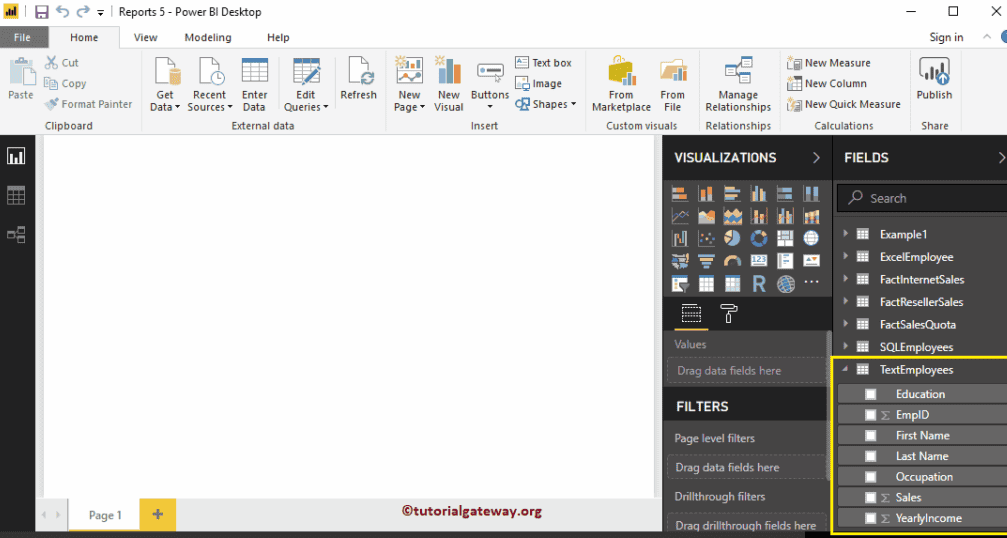
Now you can see the more meaningful names
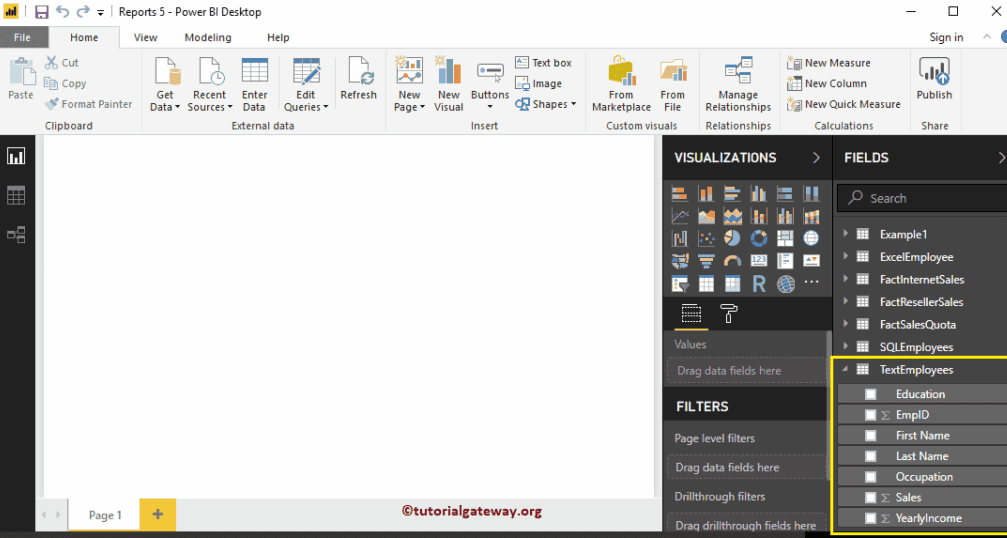
How to Rename Table Names in Power BI
Let me show you how to Rename Table Names in Power BI with an example. In general, when you load the data from a data source, you get the table names directly from the data source. While you are working with Transformations, you might need more meaningful names. In these situations, you can use the Power BI rename table names option.
How to Rename Table Names in Power BI
To demonstrate this Power BI Rename Table Names option, we are going to use the tables that we imported in Connect to SQL article.
To rename the table names, please click the Edit Queries option under the Home tab.
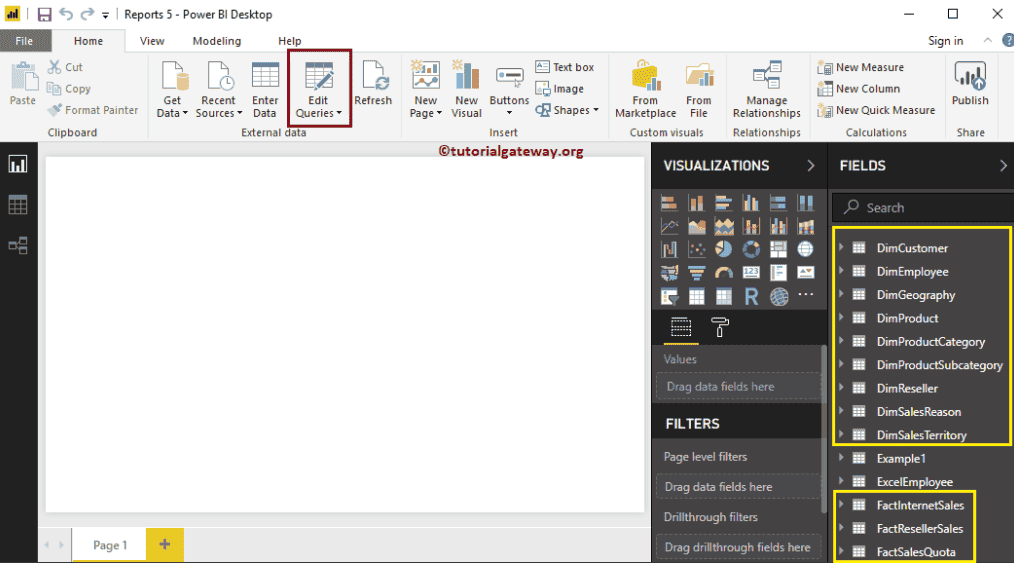
Clicking Edit Queries option will open a new window called Power BI Power Query Editor.
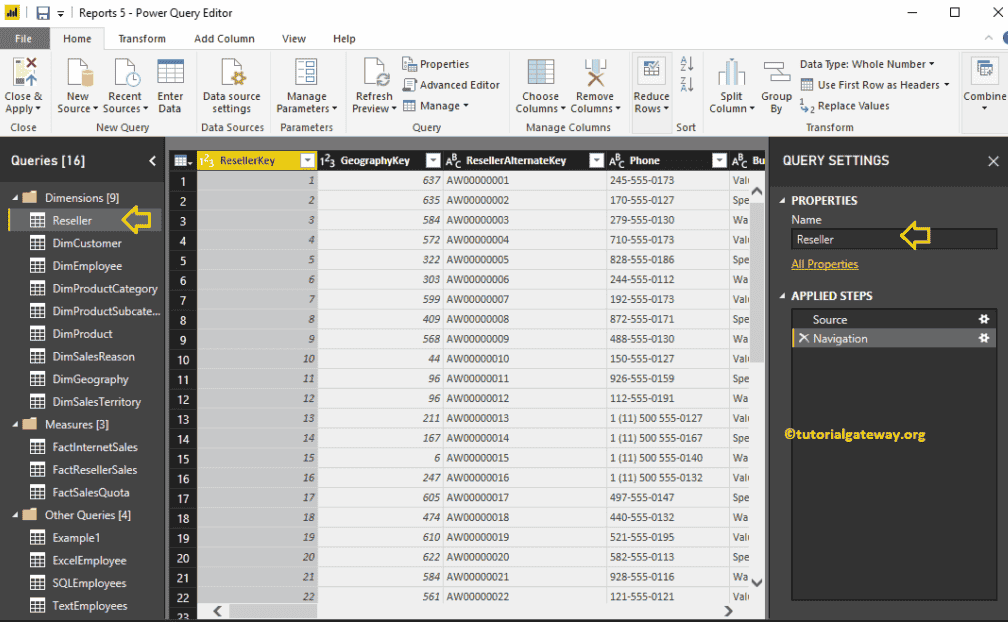
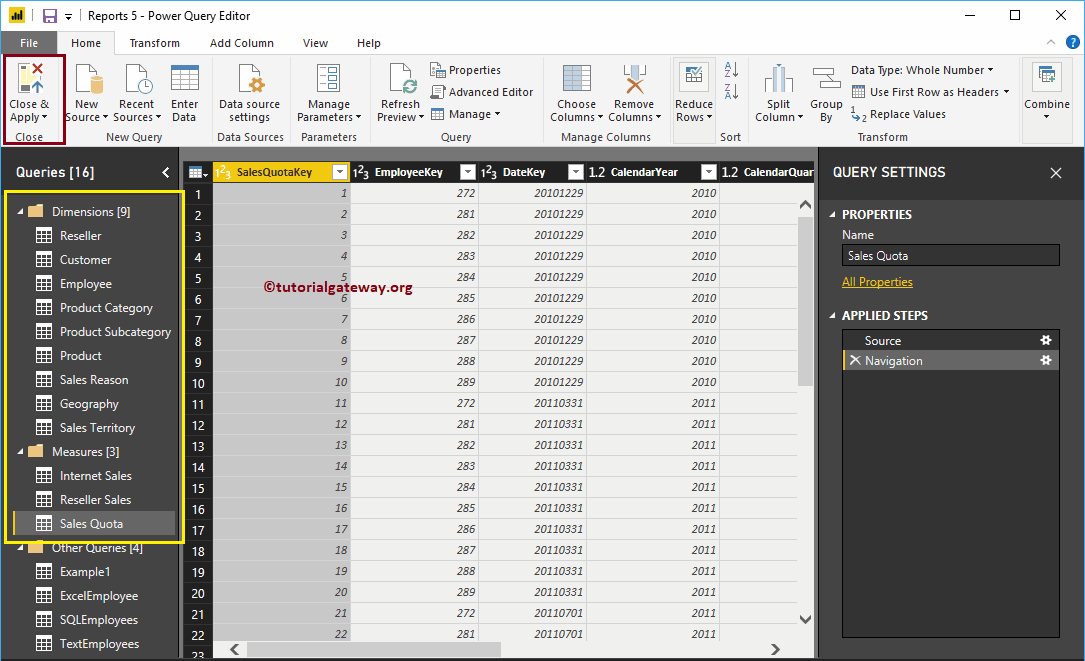
From the screenshot below, you can see, when you select the table. You can see a table name under the properties section. You can use this section to rename the table.
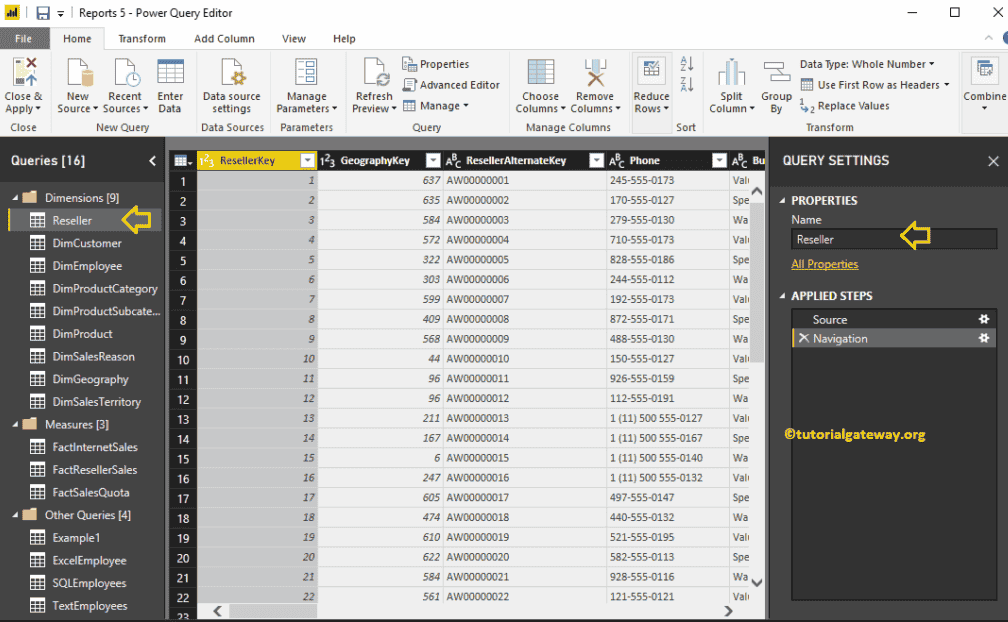
Using the Properties window, we renamed the DimReseller table name as Reseller
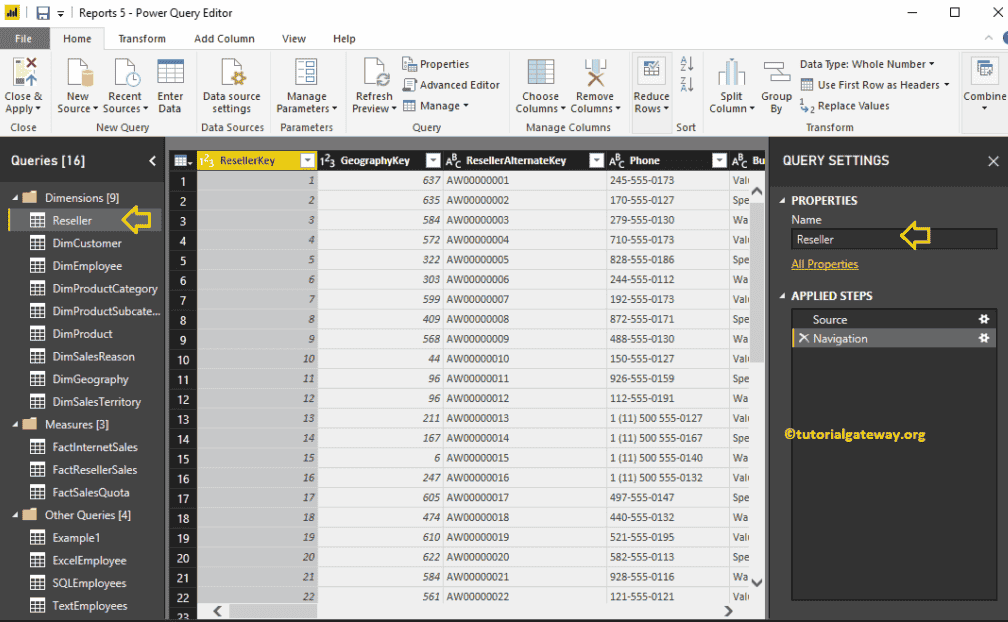
Now you can see the same
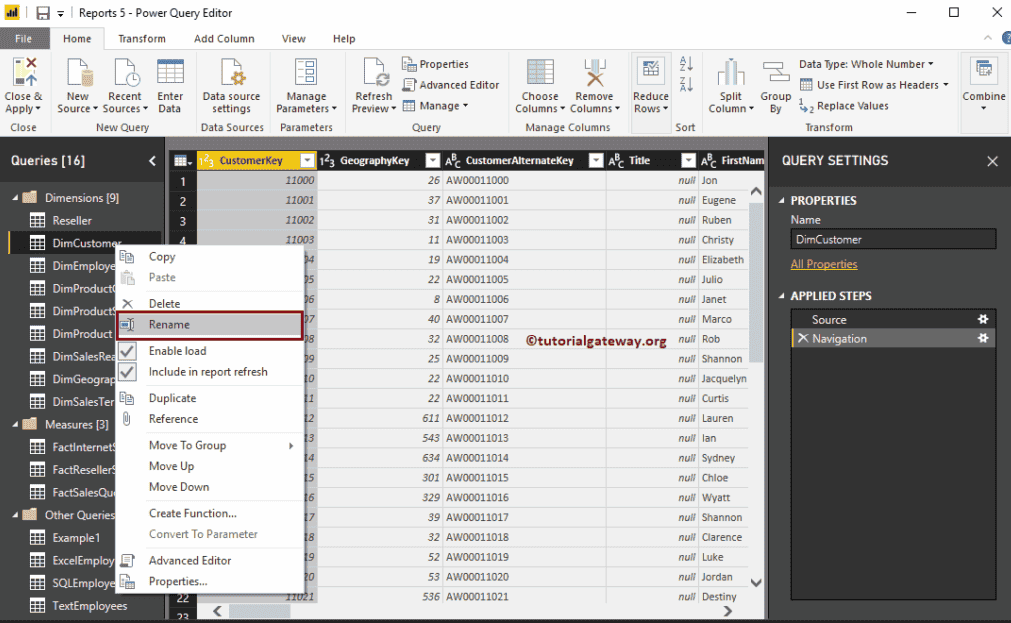
Alternatively, you can right-click on the table name and select the Rename option from the context menu.
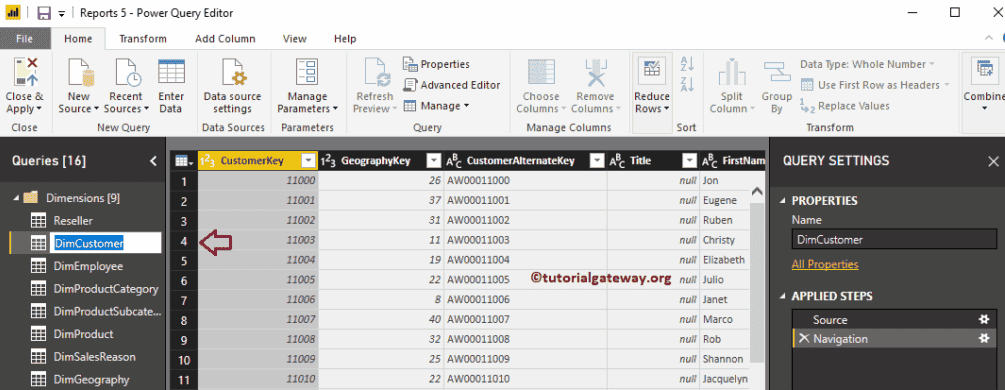
Let me rename this as a Customer
Now you can see that the table name has changed
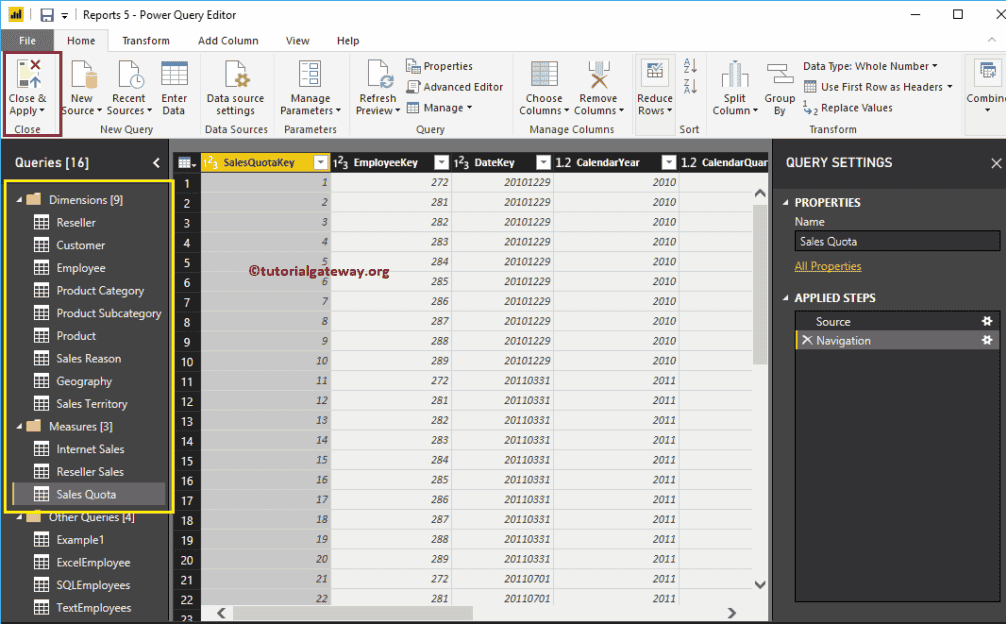
Similarly, we renamed the remaining tables. Next, hit the Close & Apply option under the Home tab to apply these changes.
Please wait until the changed are applied
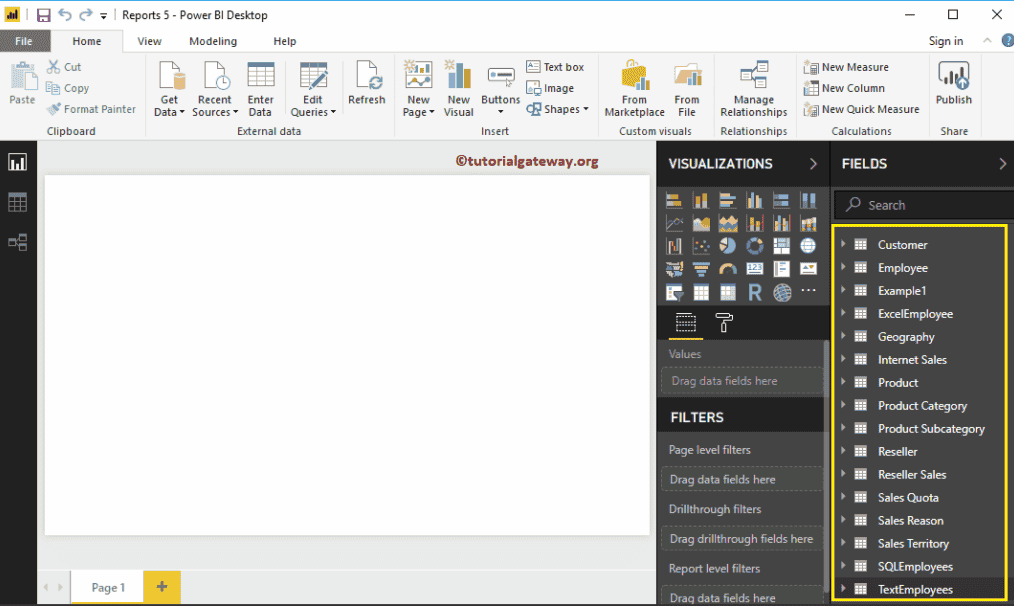
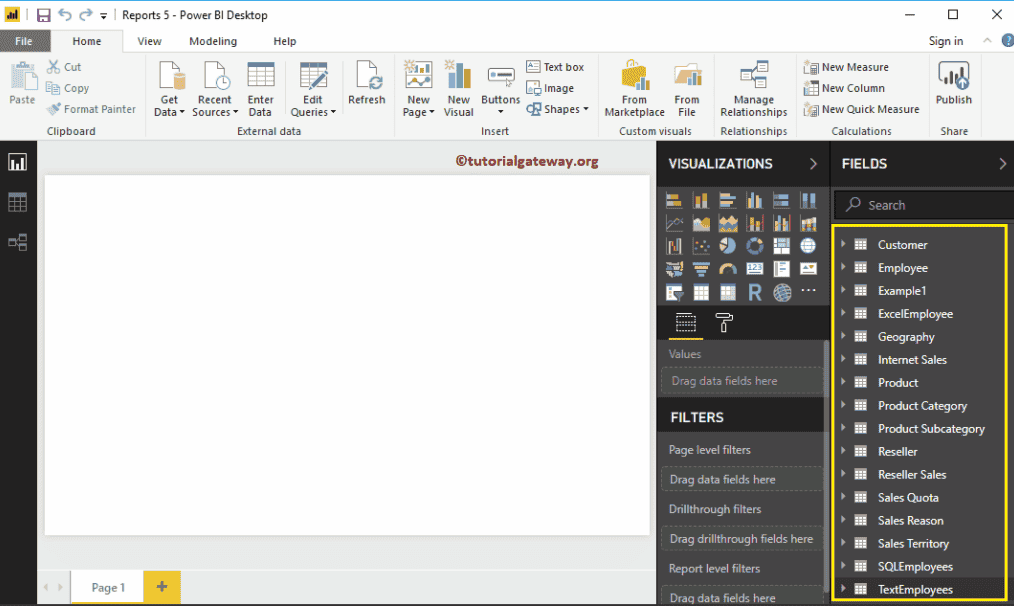
Now you can see the more meaningful table names.
How to Split Columns in Power BI
In real-time, you might get the data that has merged columns (one column with too much information). In that situation, you can use Power BI Split Columns option to split that column into multiple columns. This article shows you how to Split Columns in Power BI with example.
How to Split Columns in Power BI
To demonstrate this Power BI split columns option, we are going to use the Text Employee table that we imported in Enter Data article.
To split columns in an existing table, please click the Edit Queries option under the Home tab.
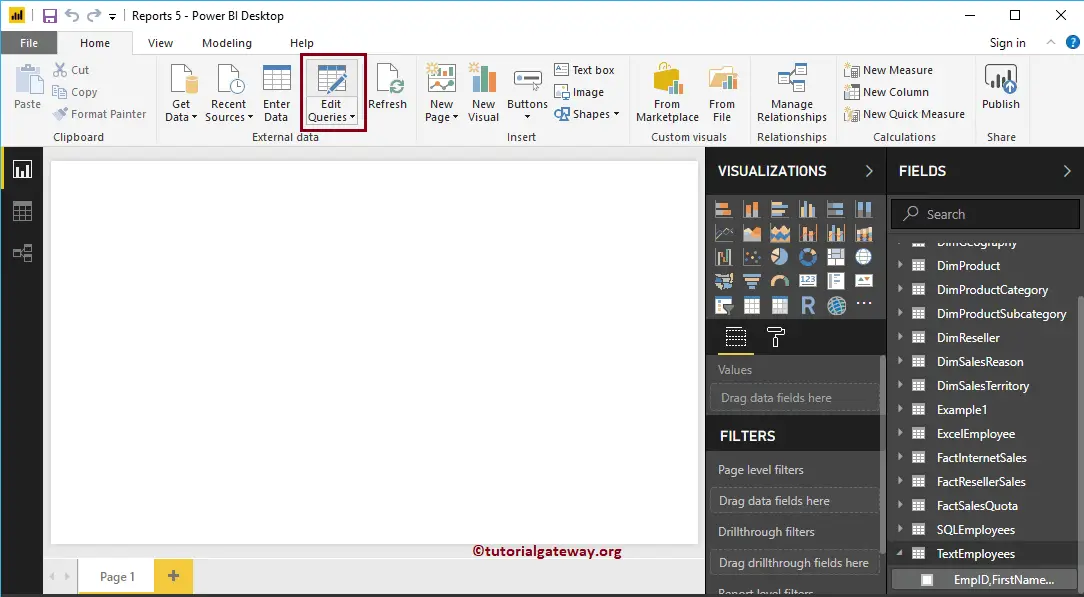
Clicking Edit Queries option opens a new window called Power Query Editor. From the screenshot below, you can see that the Power BI table has only one column.
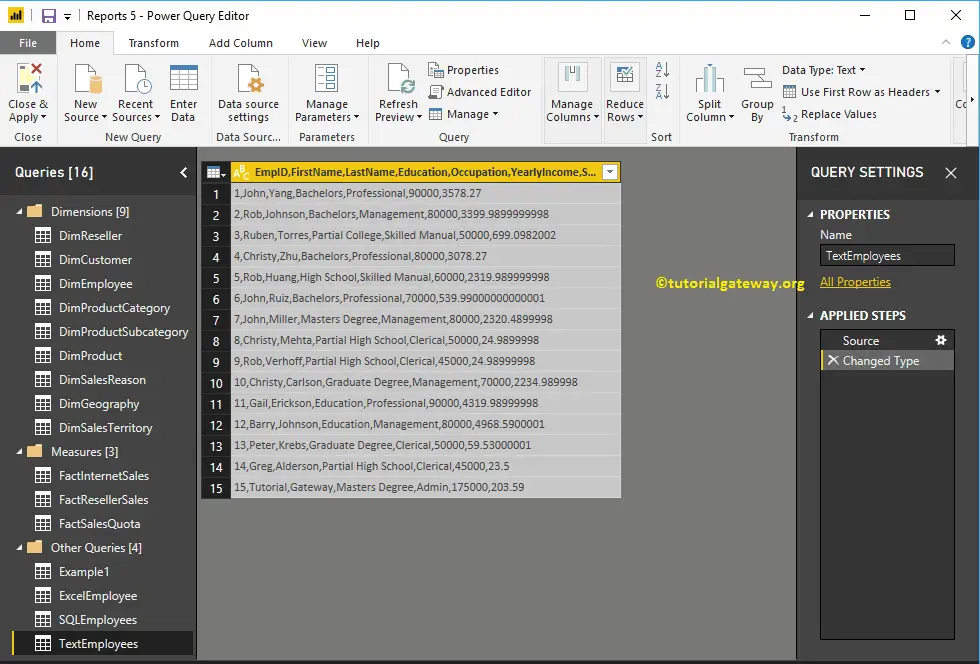
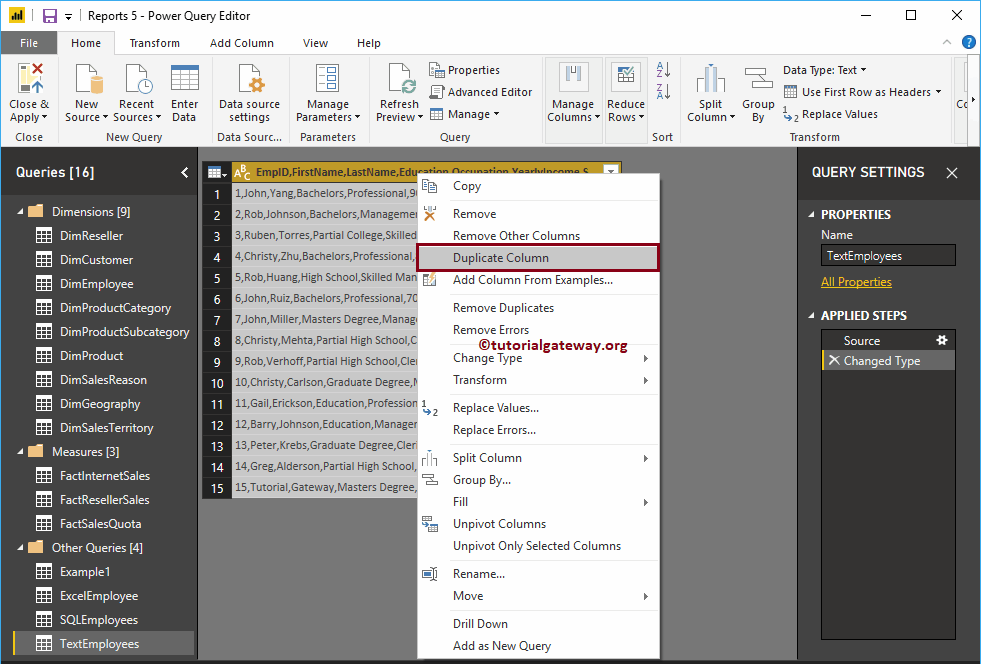
Before we start splitting the columns in Power BI, let me duplicate this column. To do so, right-click on the column name and select Duplicate Column option from the context menu.
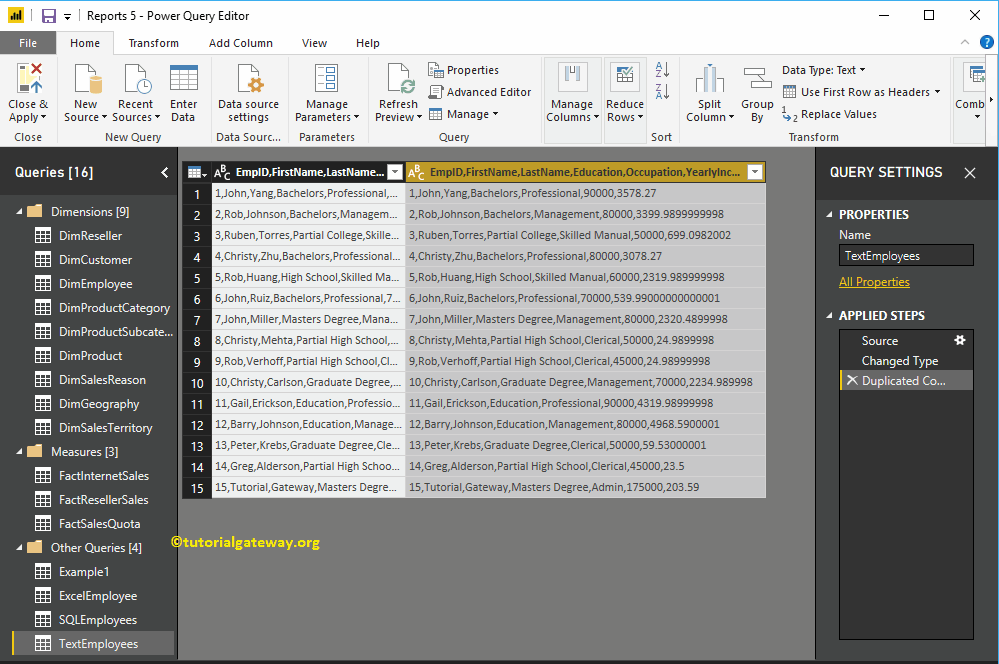
Now you can see the Duplicate column
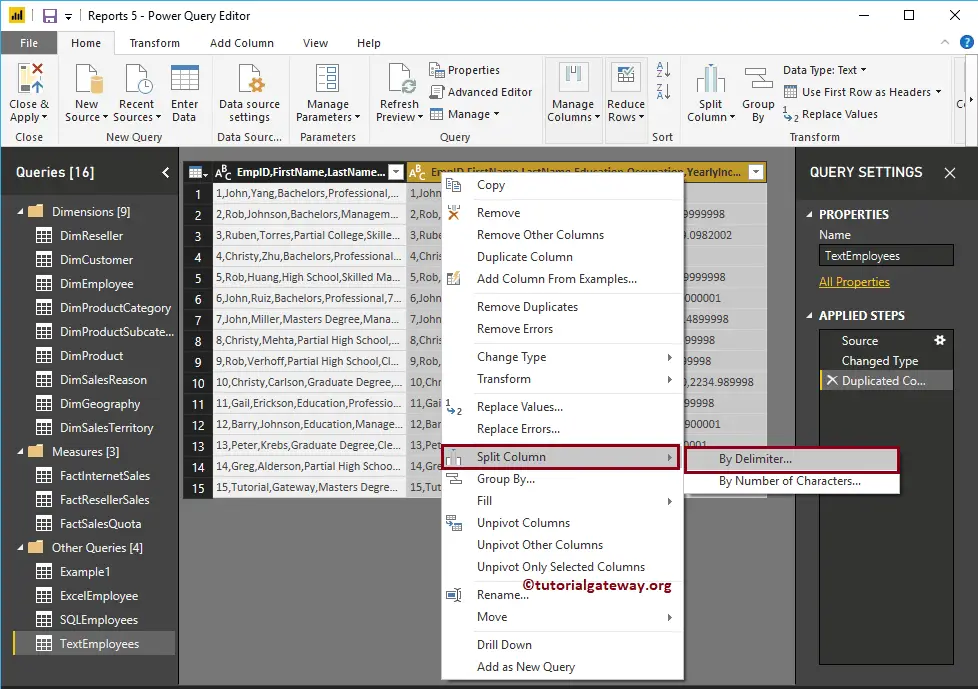
To split the columns in a Power BI table, right-click on the column that you want to split open the context menu. Please select the Split Columns and then select By Delimiter option.
Selecting the By Delimiter option opens the following window.
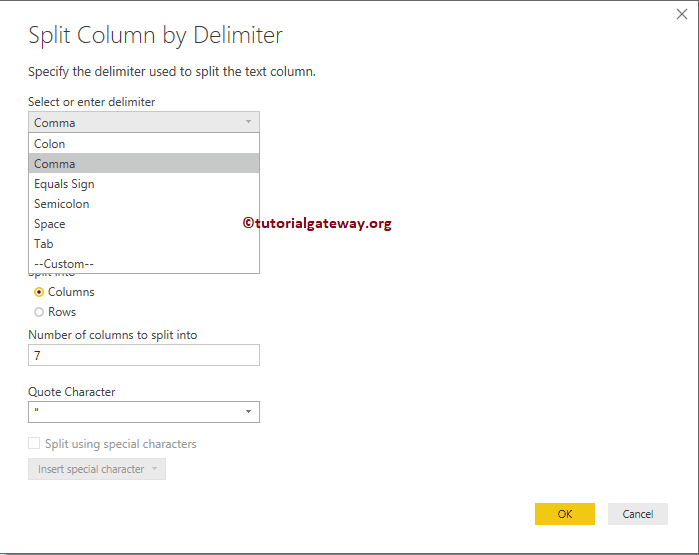
- Select or enter delimiter: From the drop-down list, please select the delimiter that you want to use as the split character. If it is not there in the list, then select the Custom option and specify that custom character.
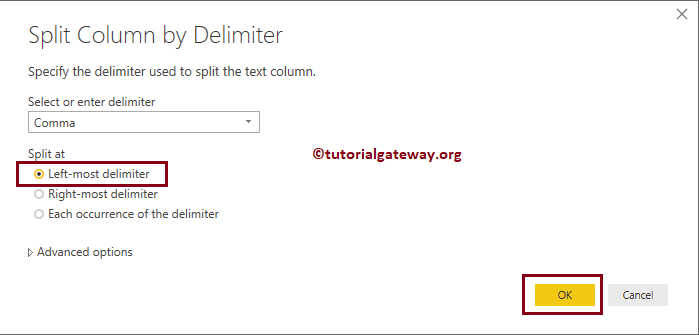
- Left most delimiter: This option split the leftmost string before the first delimiter.
- Right most delimiter: This option split the right-most string after the last delimiter.
- Each Occurrence of the delimiter: The text split at each occurrence of a delimiter.
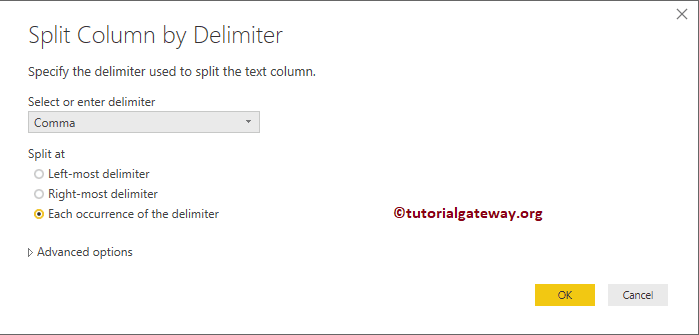
We are selecting Comma as the delimiter. Remember, under the Advanced section, you can specify the Number of Columns or Rows.
Let me select the Left Most delimiter option, and click OK
Now you can see that the Employee ID’s are separated from the original column and placed in the new column.
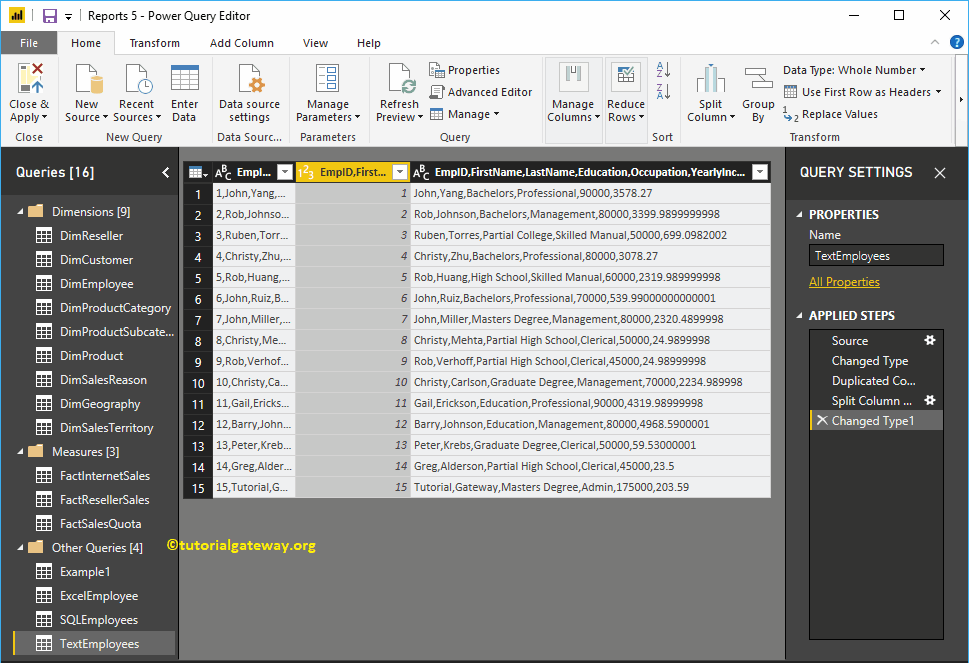
This time we select the Split at each occurrence of the delimiter option.
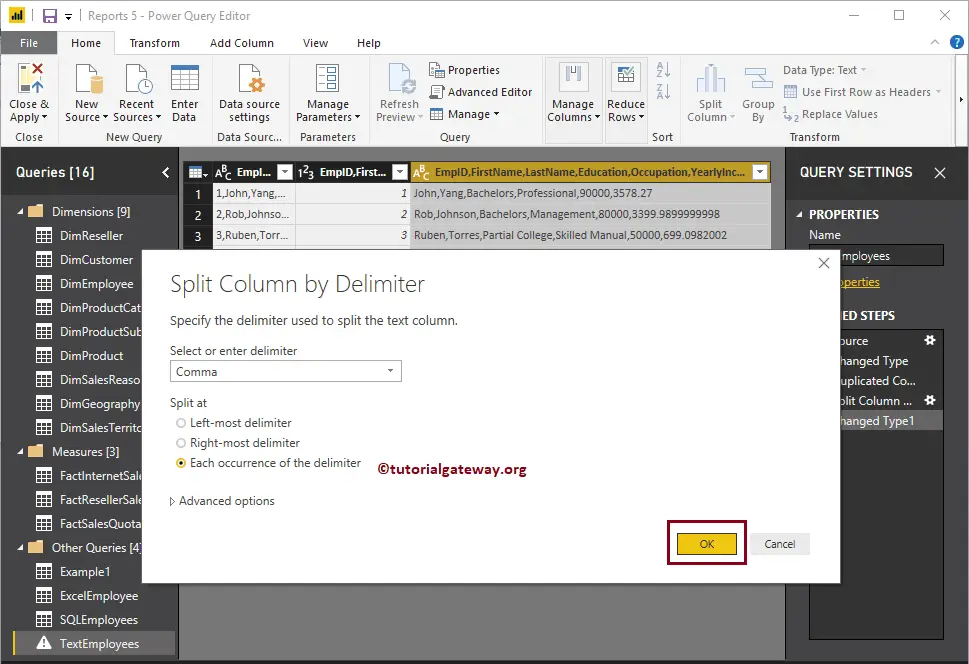
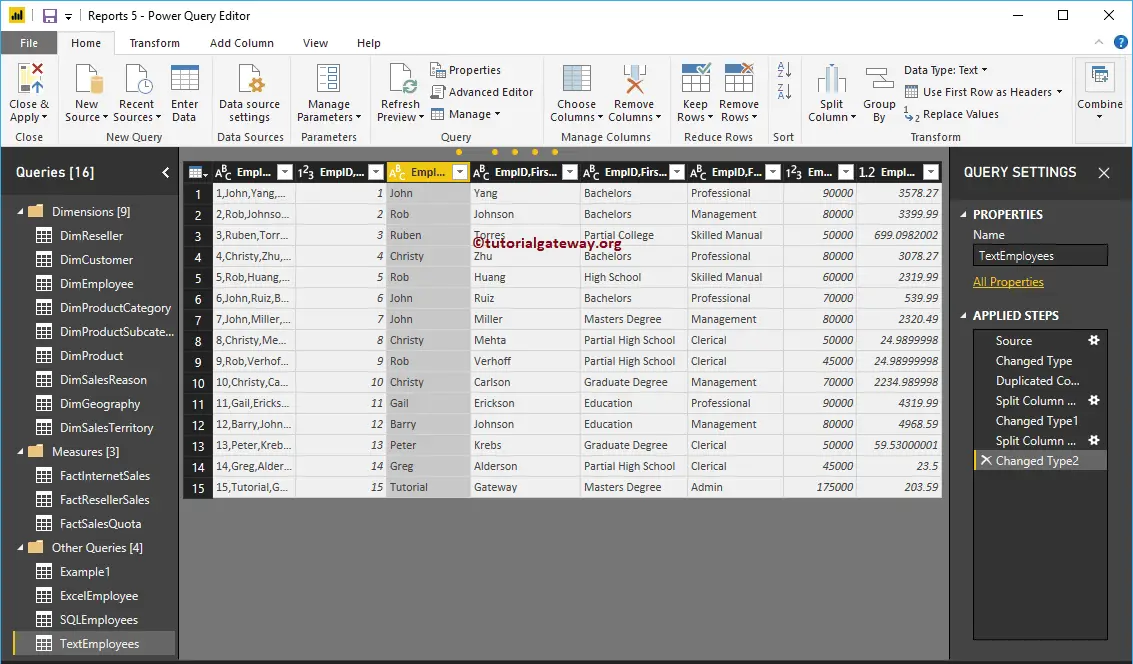
Now you can see, text at each occurrence of the comma is separated from the original column and placed in a new column.
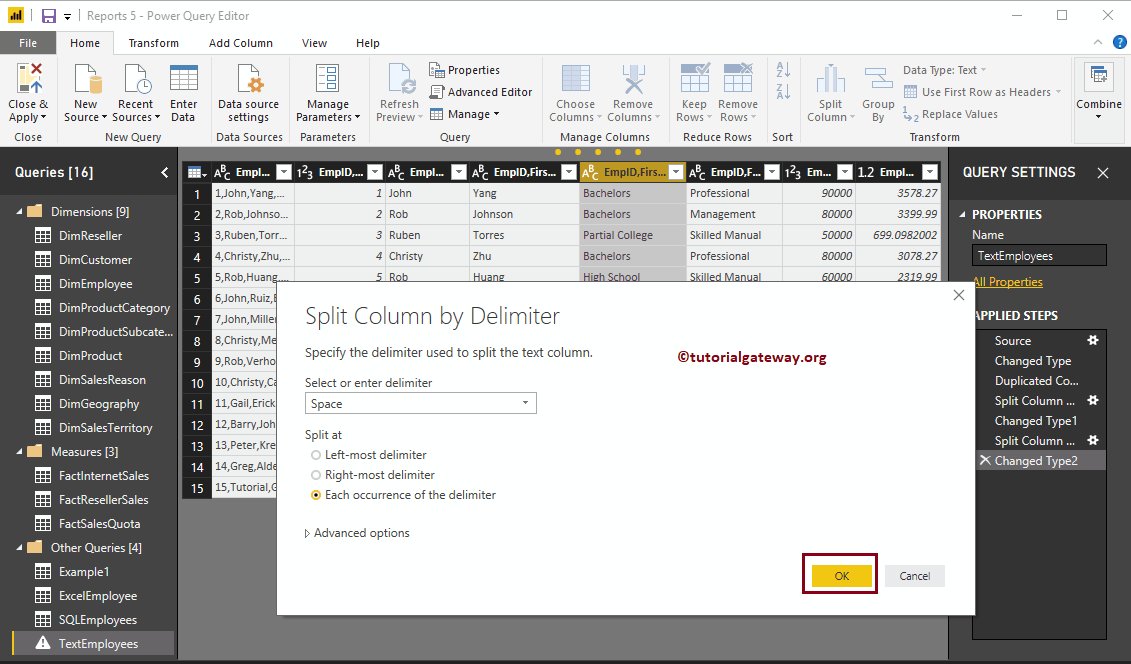
Let me try another delimiter. For the Power BI Split Columns demonstration, we are selecting the following column and split that column using the Space delimiter.
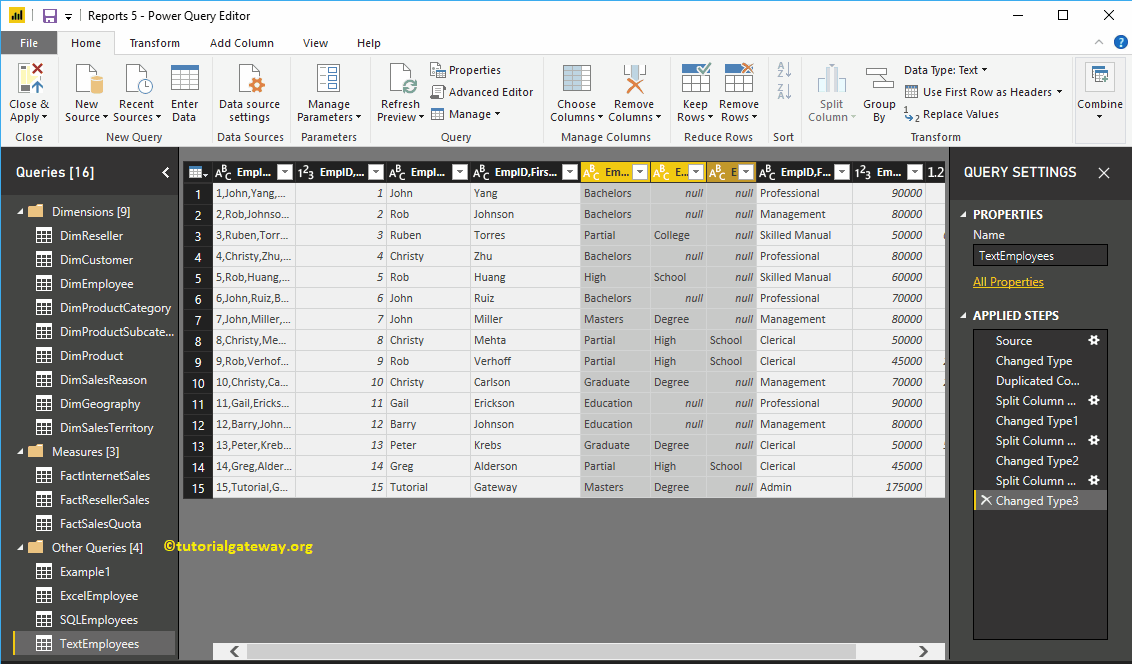
Now you can see the different columns that stored the split text at each occurrence of space.
Power BI Split Columns by Number of Characters
Right-click on the column that you want to split will open the context menu. Please select the Split Columns and then select the By Number of Characters option.
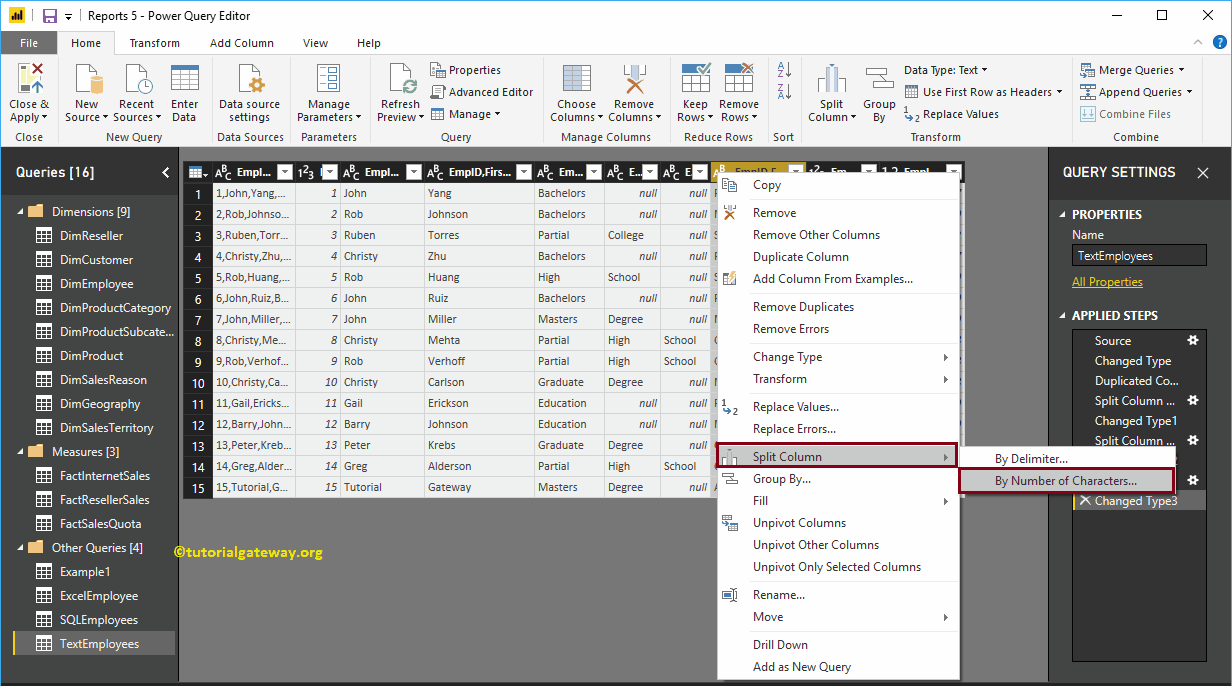
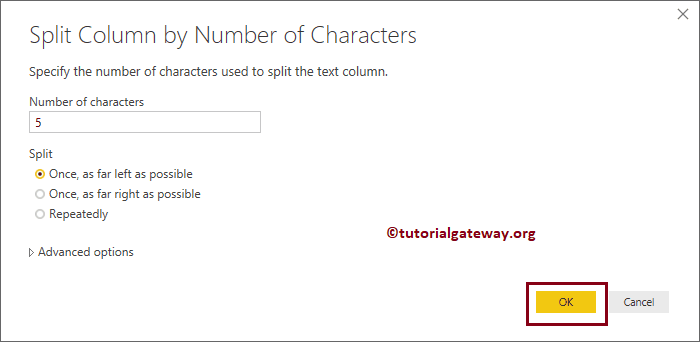
Selecting the By Number of Characters option opens the Split Column by Number of Characters window.
- Number of Characters: Please specify the number of characters used to split the column.
- Once, as far left as possible: This option split the leftmost string before the number of characters.
- Once, as far right as possible: This option split the right-most string after the number of characters.
- Repeatedly: The text split for every 5 characters.
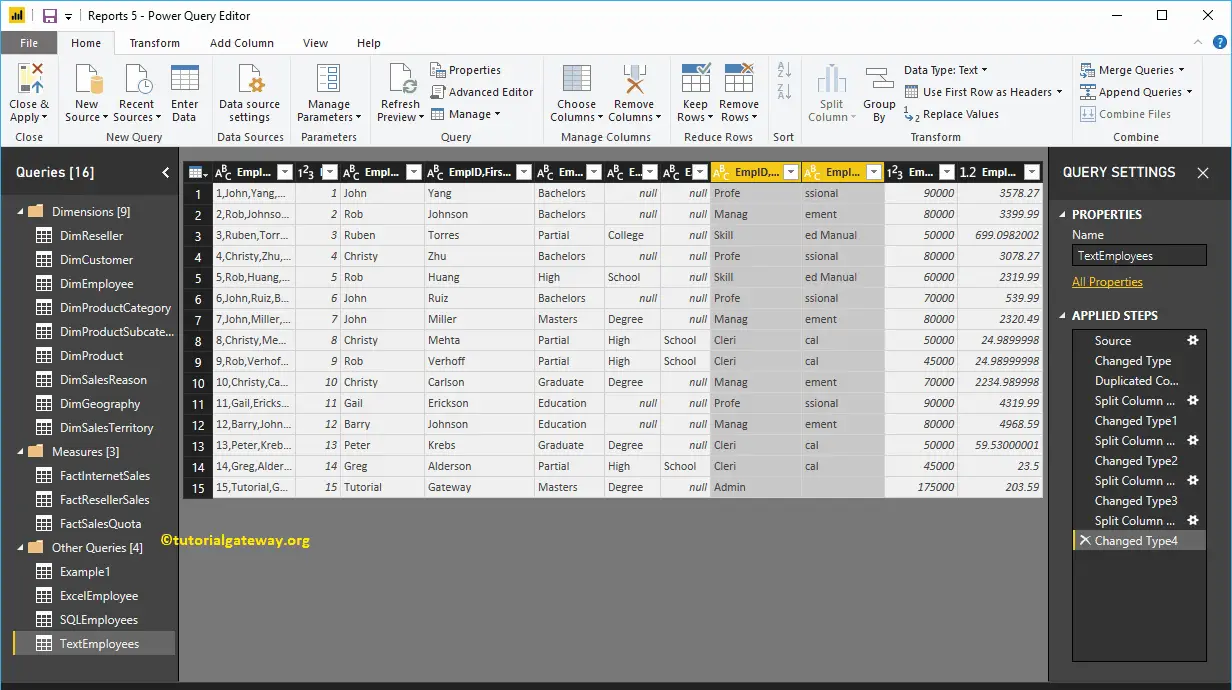
Now you can see the split columns in Power BI query editor
Whatever the changes you made (Split Columns in Power BI) won’t affect until you hit Apply. Let me hit the Close & Apply option under the Home tab.
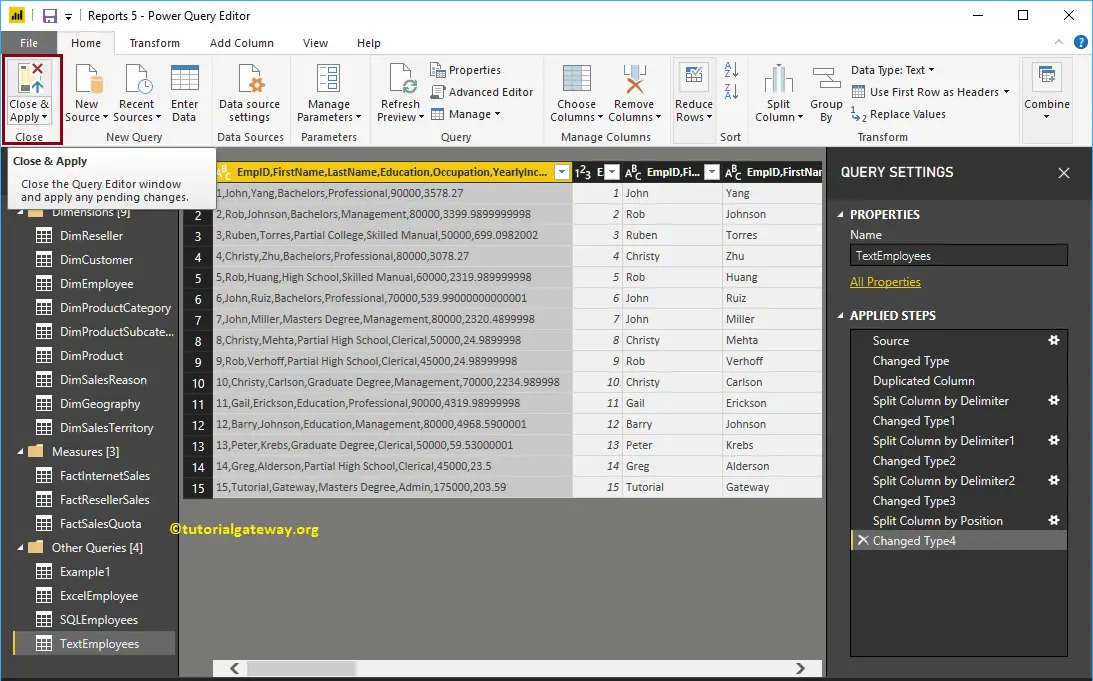
Now you can see 11 columns inside the Text Employees table.
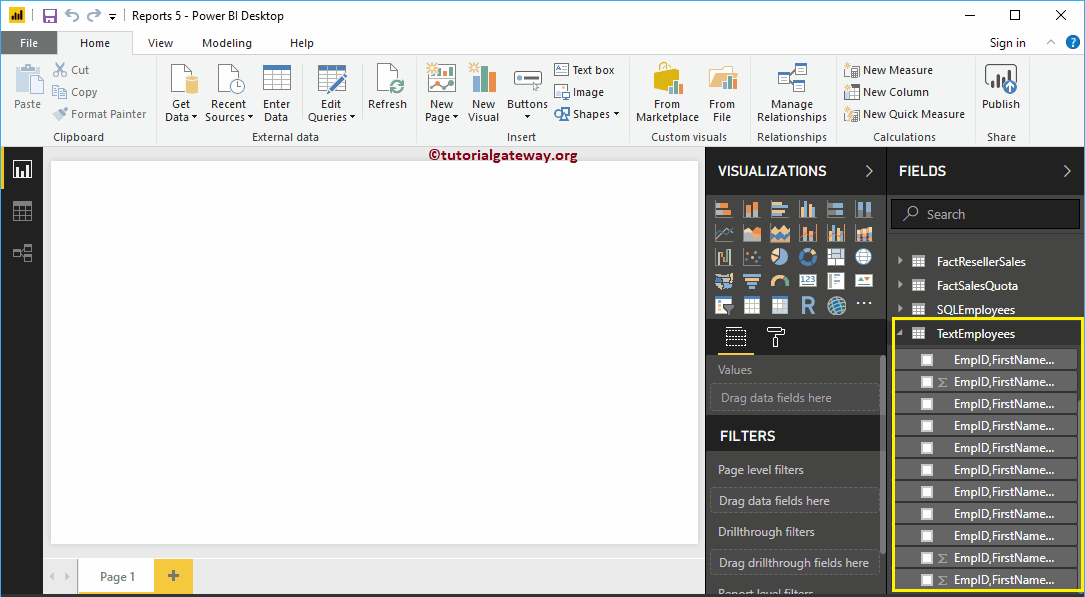
Unpivot Table in Power BI
Power BI Unpivot table option converts selected columns into rows. Let us see how to create an Unpivot table or how to convert the pivot table into the unpivot table in Power BI with an example.
How to create unpivot Table in Power BI
To create or convert pivot to unpivot table, please click the Edit Queries option under the Home tab.
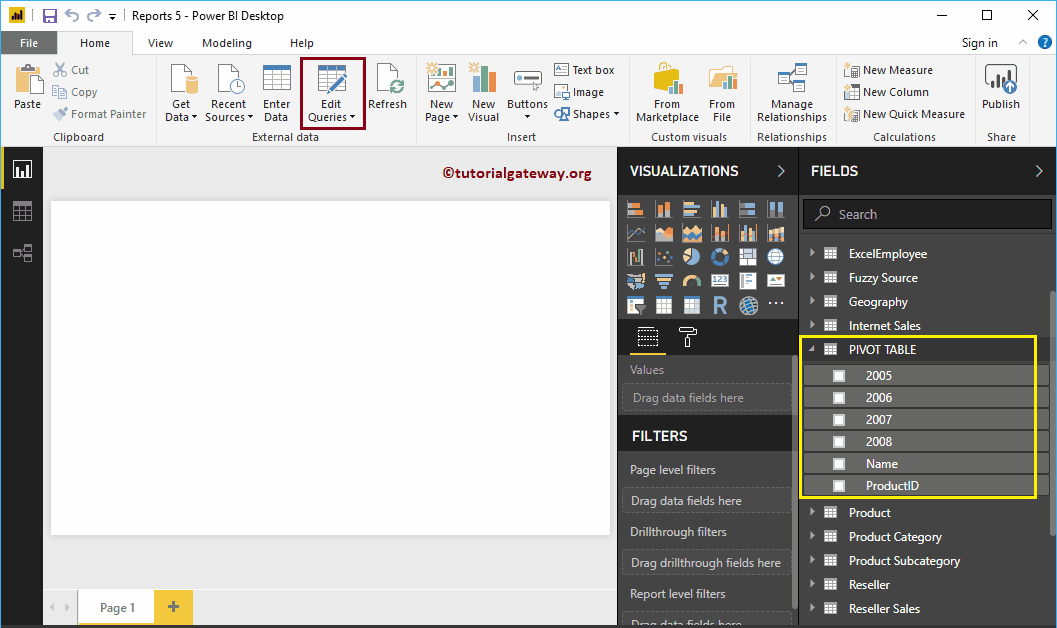
Clicking the Edit Queries option opens a new window called Power BI Power Query Editor.
In this Unpivot Table example, we are going to unpivot the columns 2005, 2006, 2006, and 2007.
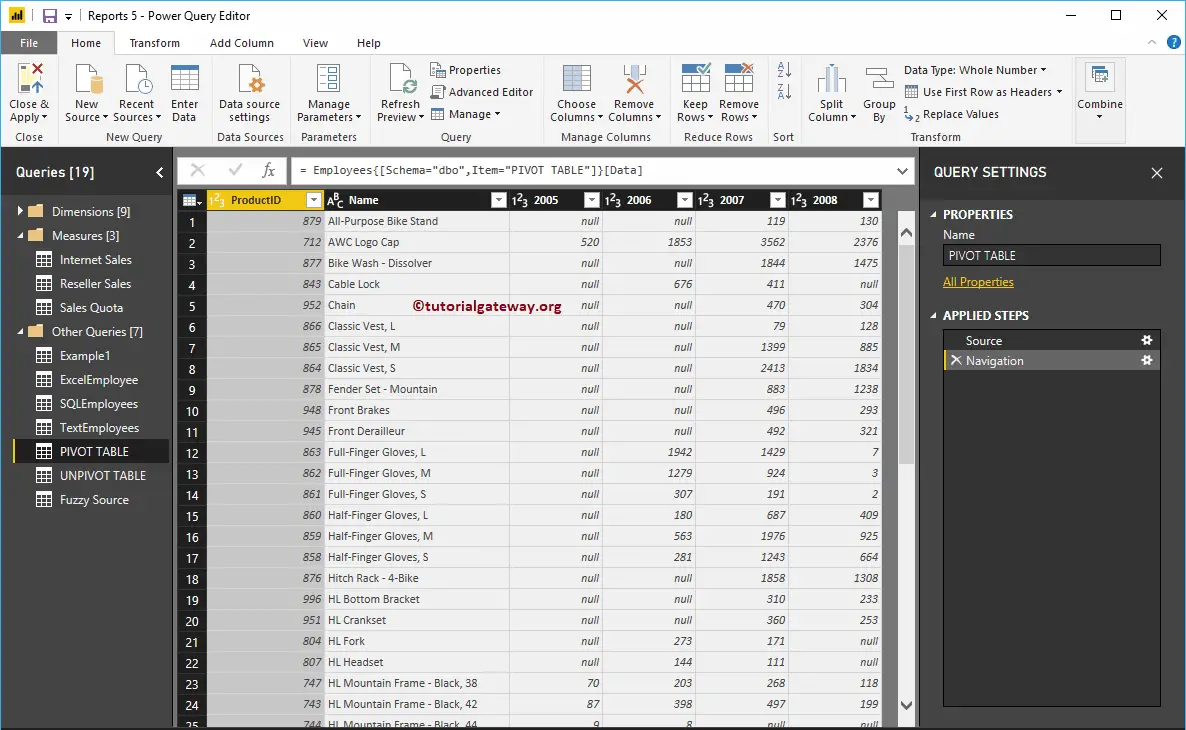
There are a couple of ways to unpivot table
The First approach to unpivot table in Power BI
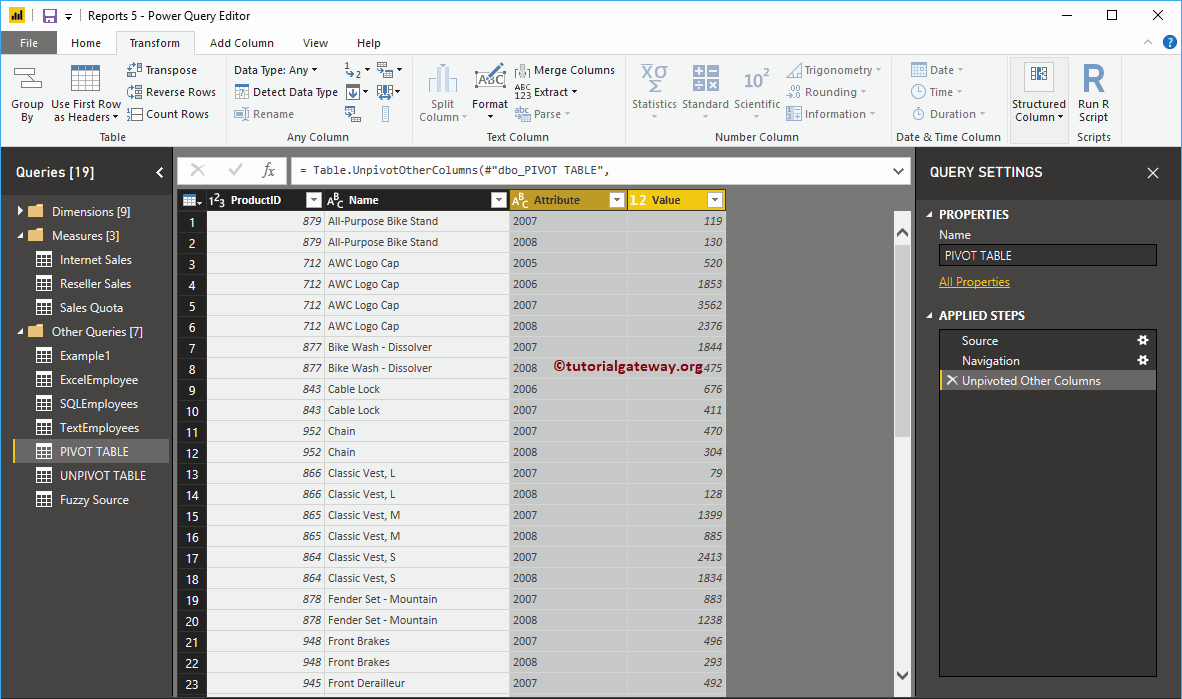
Please select the columns that you don’t want to unpivot, or you want to keep them unchanged will open the context menu. Select the Unpivot Other Columns option. This unpivots all the columns except the selected ones.
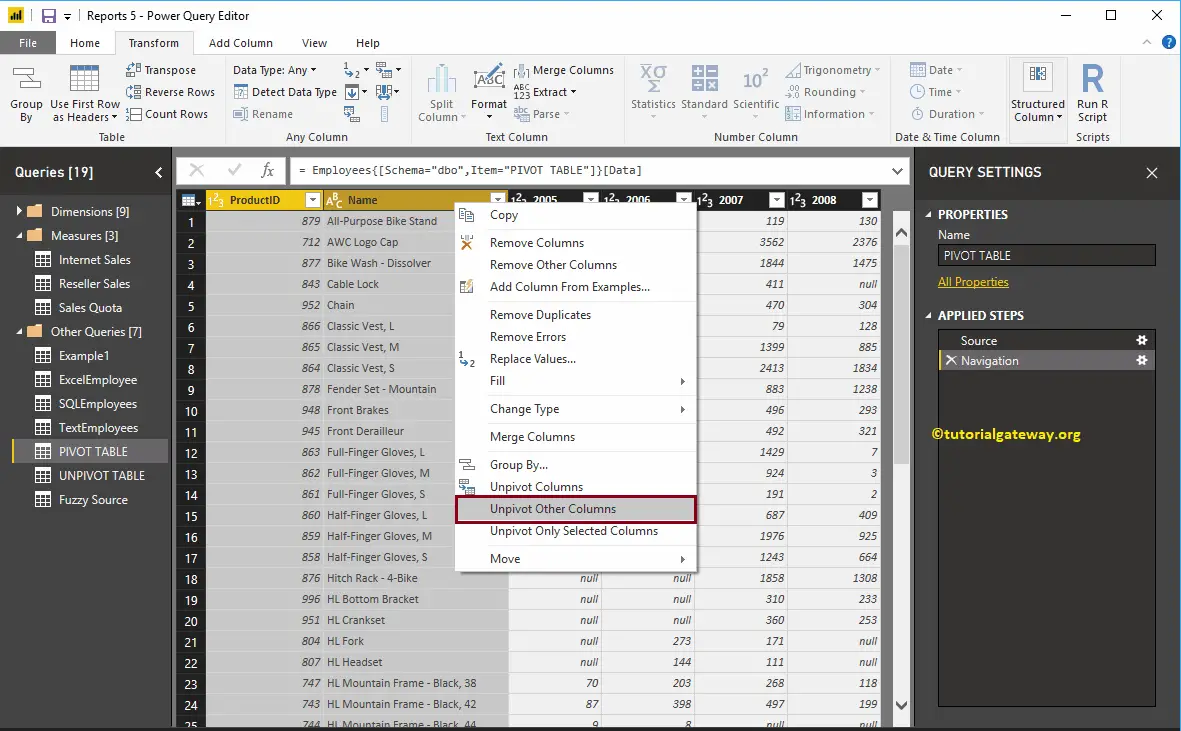
Now you can see the unpivoted table
The second approach to unpivot table in Power BI
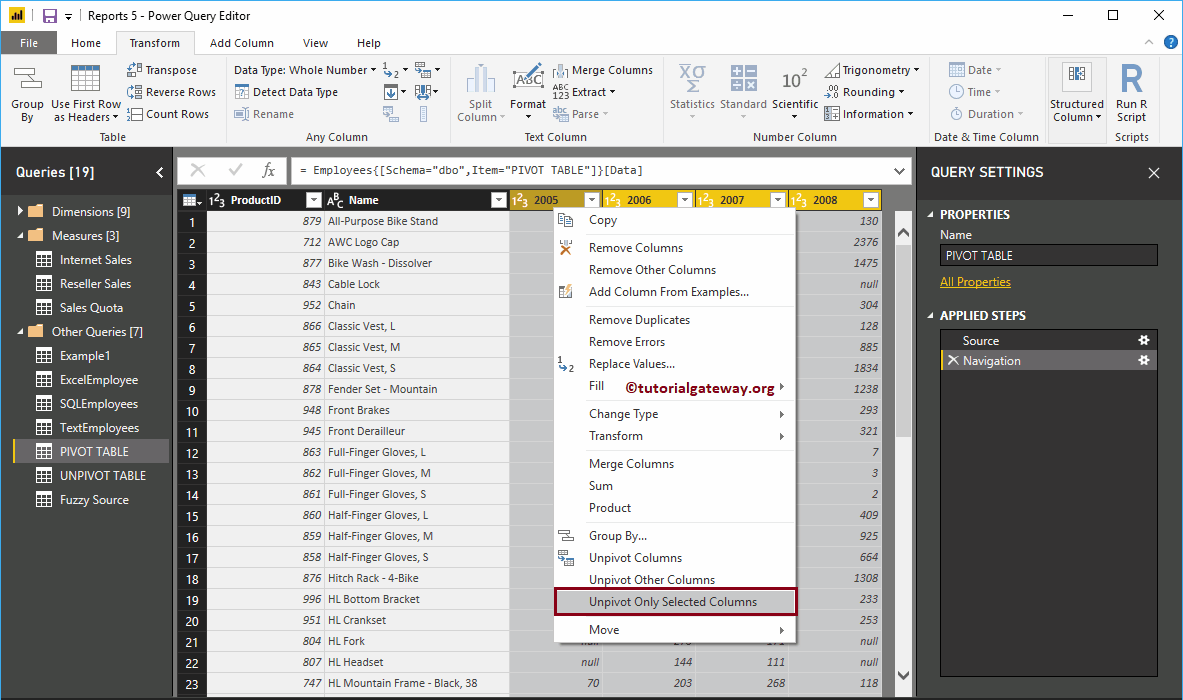
Please select the columns that you want to unpivot will open the context menu. Select Unpivot Only Selected Columns option. This unpivots all the selected columns.
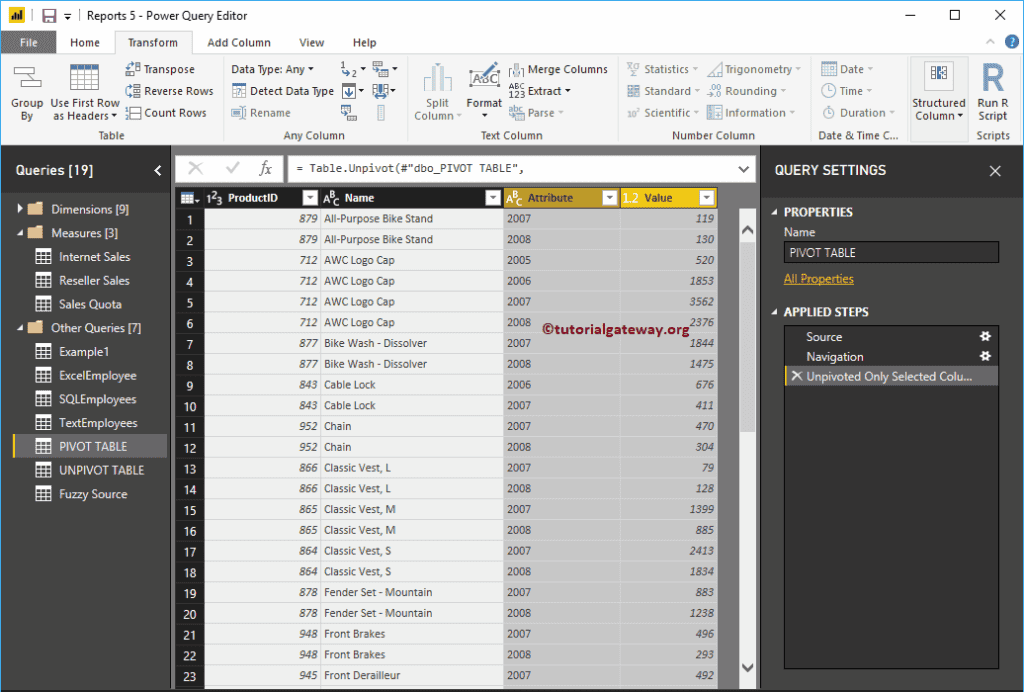
Now you can see the unpivoted table
The third approach to unpivot table in Power BI
In order to convert the pivot table into the unpivot table, go to Transform Tab. Under this tab, you can find the Unpivot Column button as shown below.
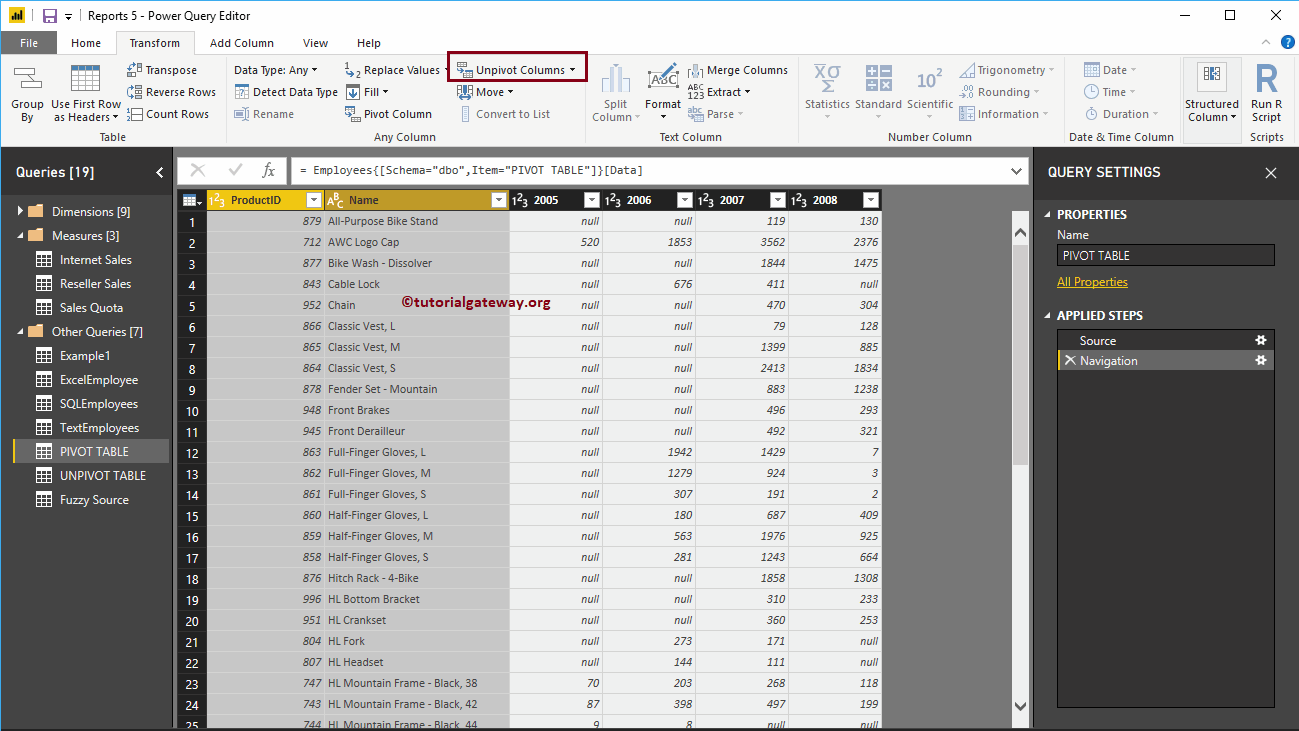
Use the drop-down list to unpivot the table. For the Unpivot Table demonstration purpose, we selected the Product ID, and Name columns, and then selected the Unpivot Other columns option.
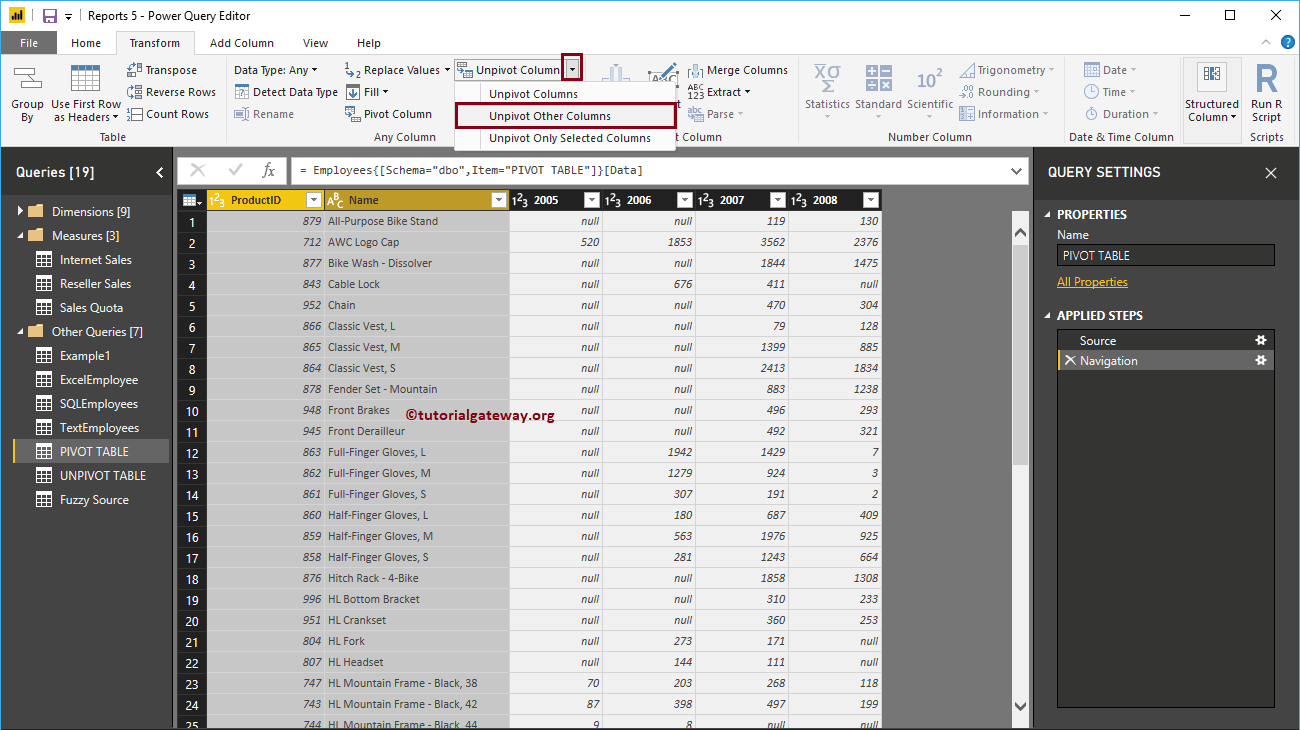
Now you can see the unpivoted table.
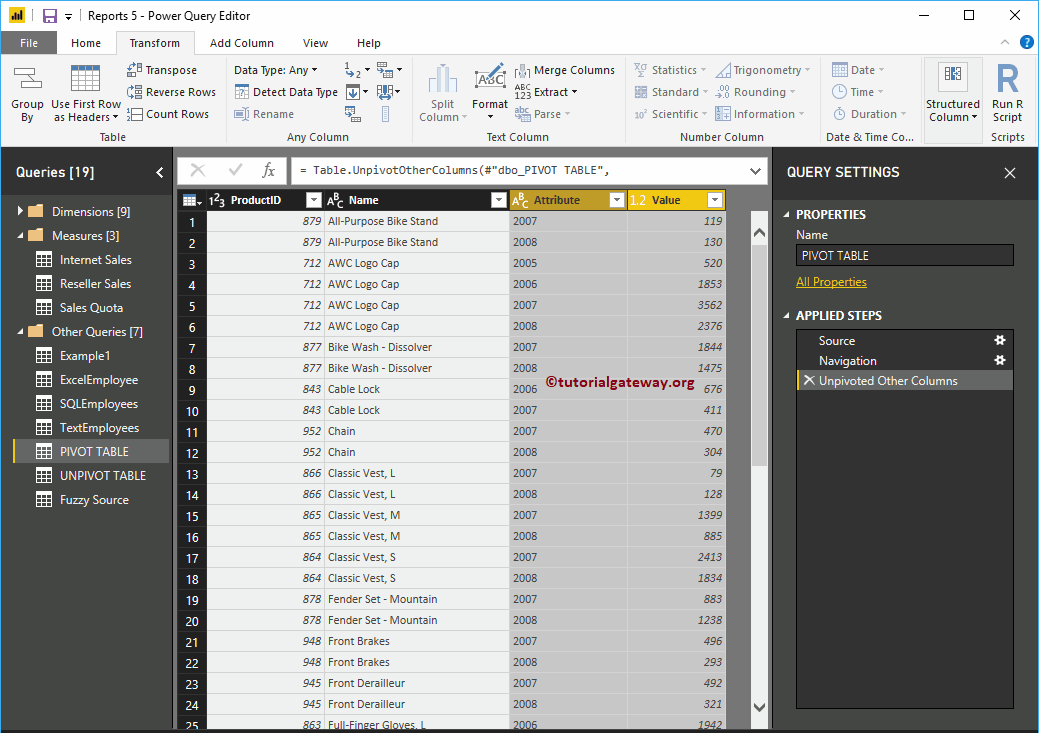
We renamed the columns to more meaningful ones. Next, hit the Close & Apply option under the Home tab to apply these changes.
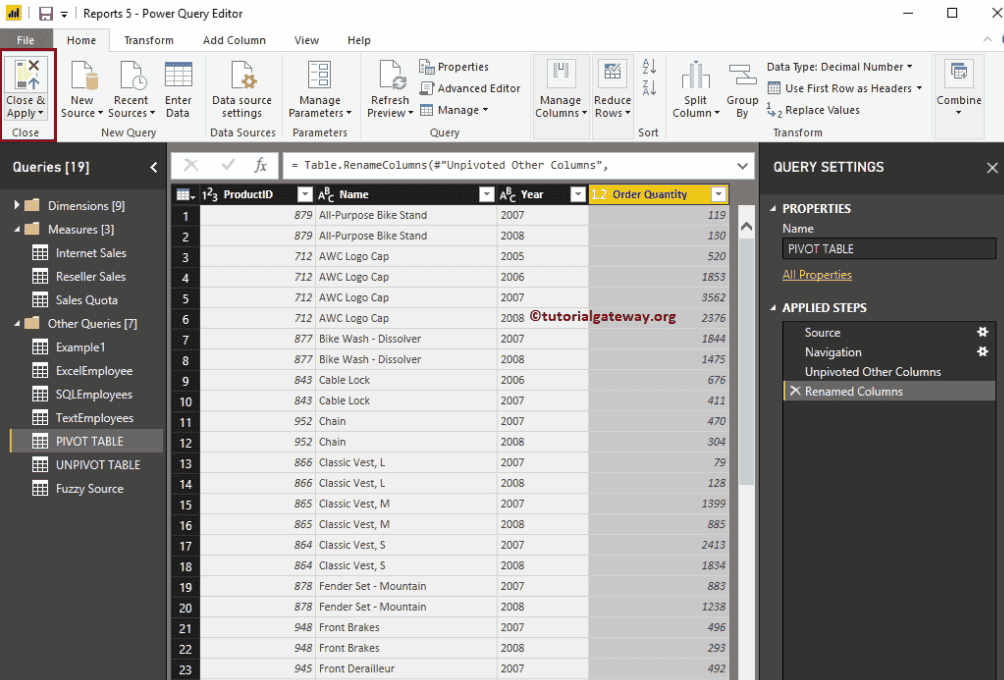
From the screenshot below, you can see the unpivot columns on the right side.
