Power BI Bins or buckets are useful to create a Range of data, similar to SQL Buckets. Let me show you how to create bins in Power BI with an example
For this Power BI bins demonstration, we are going to use the SQL Data Source that we created in our previous article. So, Please refer Connect to the SQL Server article to understand the Data Source.
Create Bins in Power BI
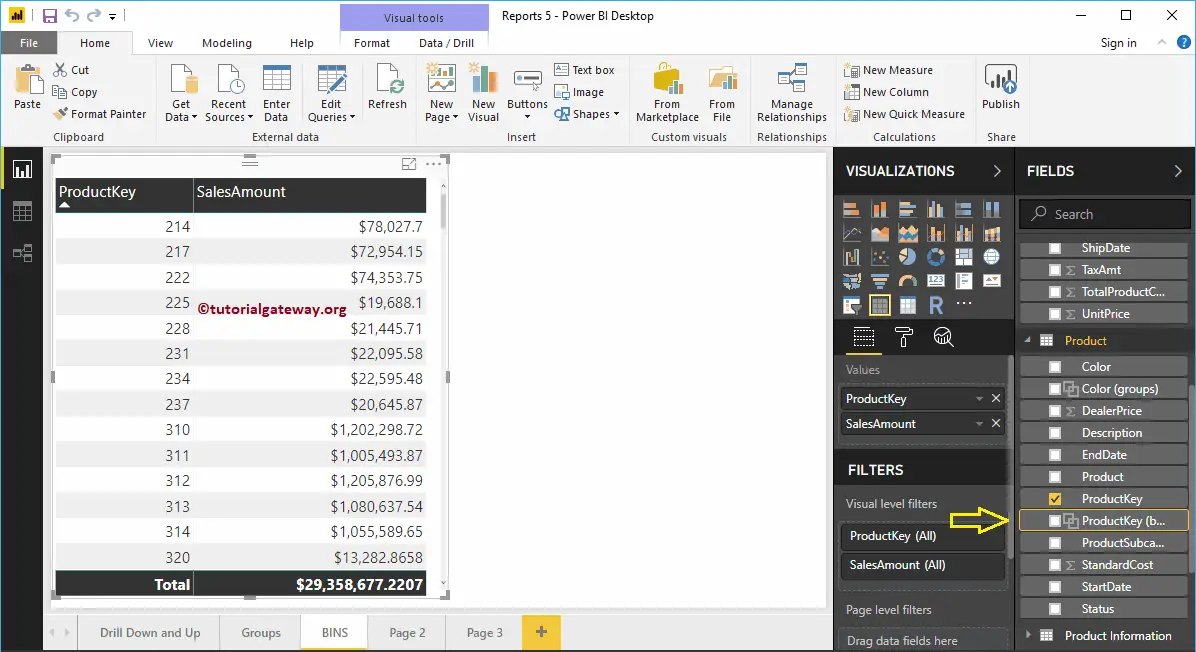
To visually demonstrate this Power BI bins, we will create a Table. As you can see from the screenshot below, we created a simple Table by dragging the Product Key and Sales Amount column.
NOTE: I suggest you refer to Create a Table and Format Table article to understand the steps involved in creating and formatting a Power BI Table.
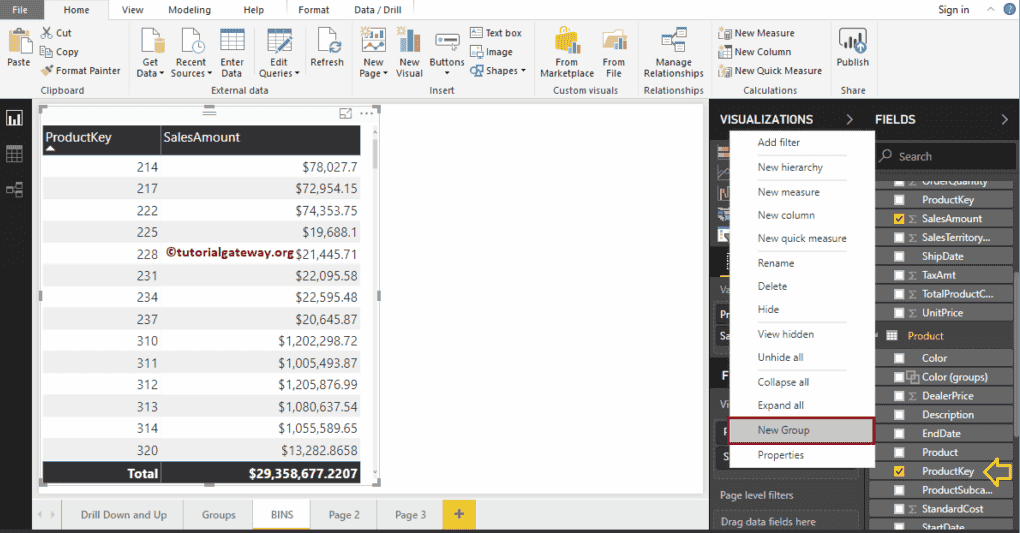
Please select the filed that you want to use as a bin, and right-click on it opens the context menu. Select the New Group option from the menu.

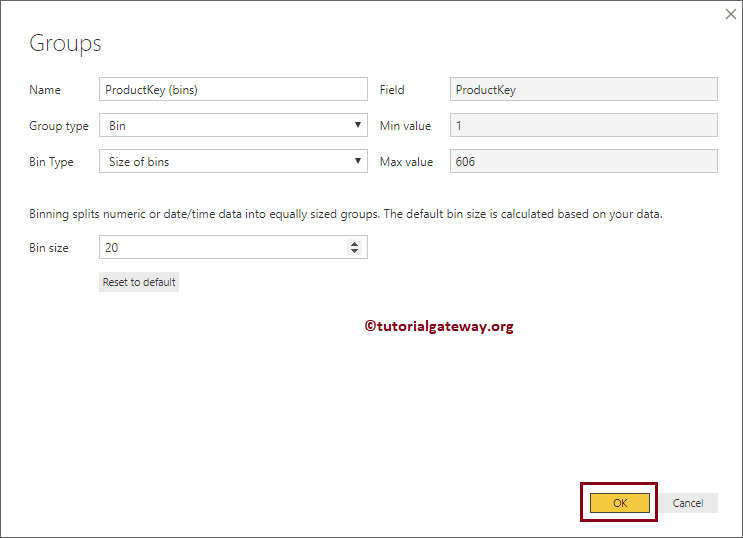
Clicking the New Group option opens the following window.
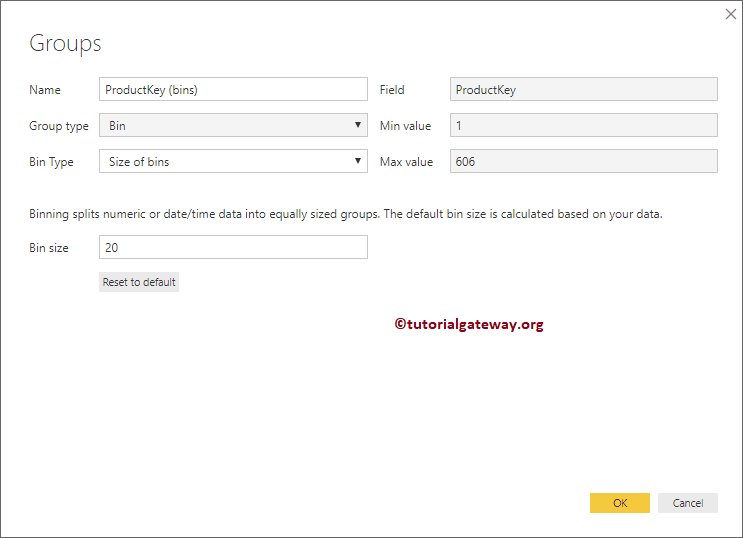
- Name: Specify the Power BI Bin name
- Field: Field or Column that you used for binning
- Group Type: List (group) or bin.
- Bin Type: There are two option such as Size of Bins or Number of Bins
- Min and Max Value: Minimum and maximum value present in the selected Fields. Here, it is the Product Key.
If you selected the Bin Type as Size of Bins, then you have to specify the Bin size (static Number)
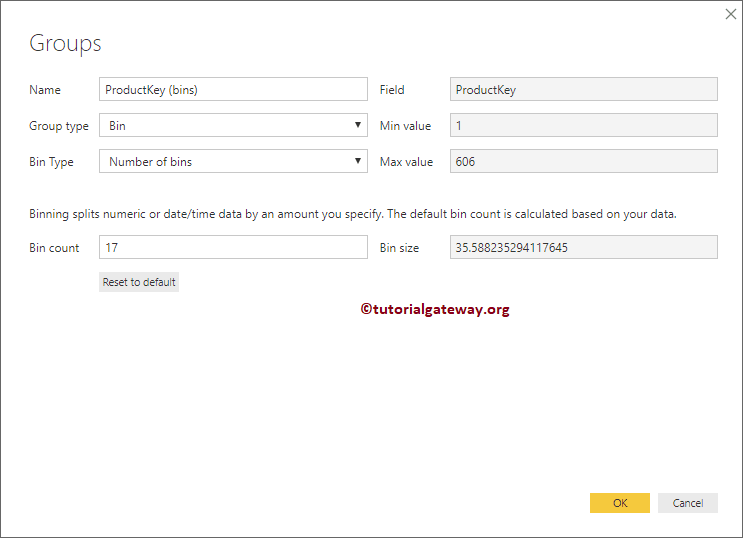
Alternatively, if you selected the Bin Type as Number of Bins, then you have to specify the Bin count. Here, Bin size depends upon the Bin count.
Let me select the Bin size as 20 and click OK. It means each bucket size is 20

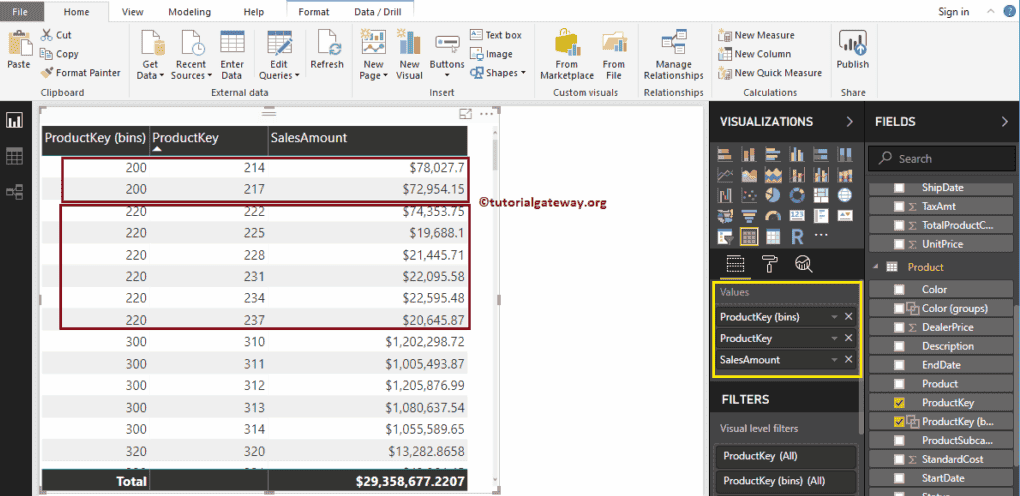
Now you can see the newly created bin under the Product table.
Let me add that bin to this table. From the below screenshot, you can see that the product Key value is 220 for the keys between 220 to 240
Edit Power BI Bins
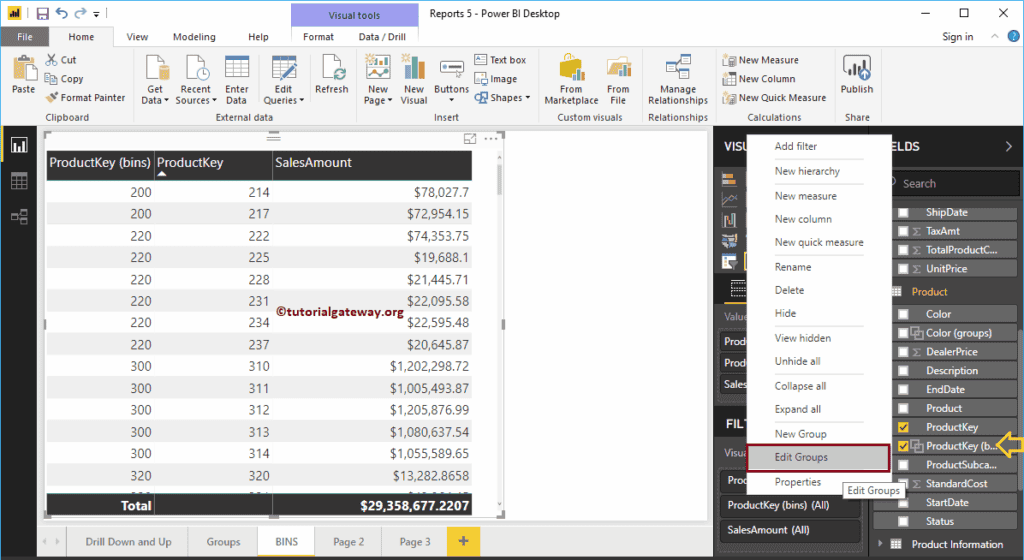
Please select the bin that you want to edit, and right-click on it opens the context menu. Select the Edit Groups option from it
Clicking the Edit Groups option opens the following window. Use this window to change as per your requirement.
Delete Bins in Power BI
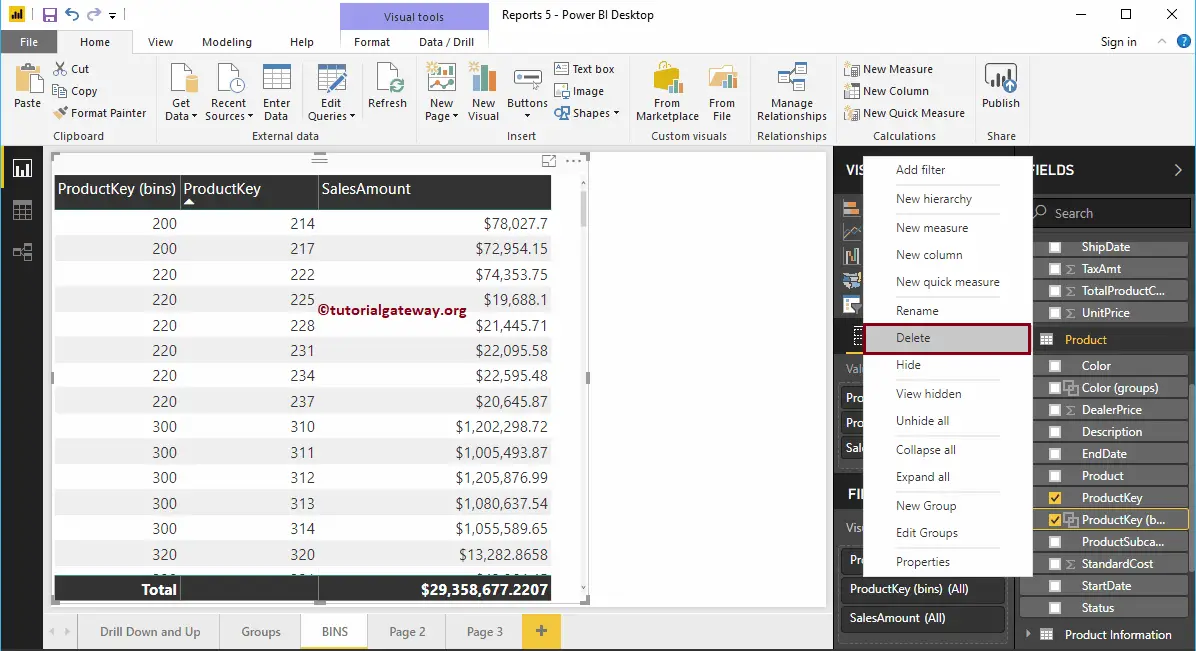
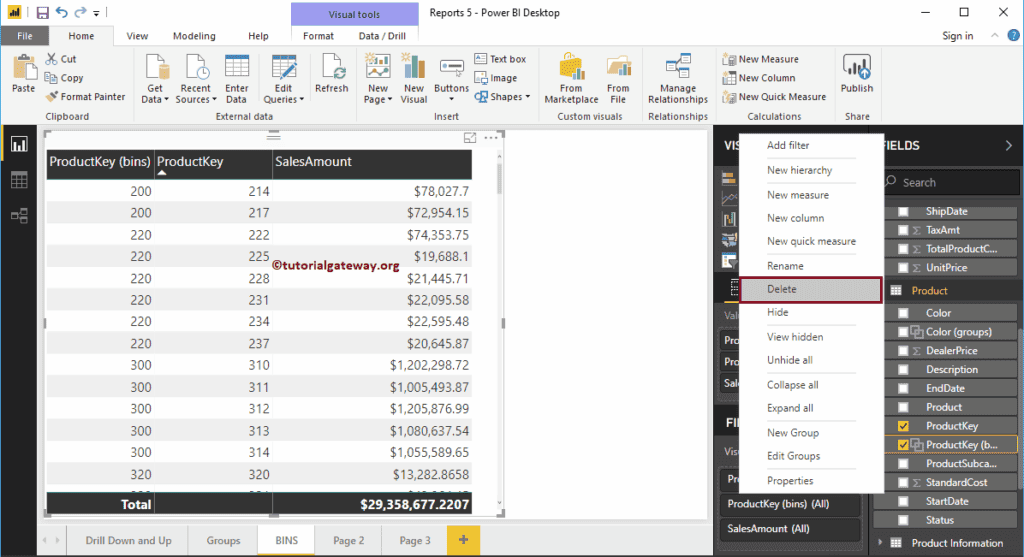
Please select the bin that you want to delete, and right-click on it opens the context menu. Select the Delete option form it
Click the Delete button to confirm the delete operation.
Create Bins in Power BI Example 2
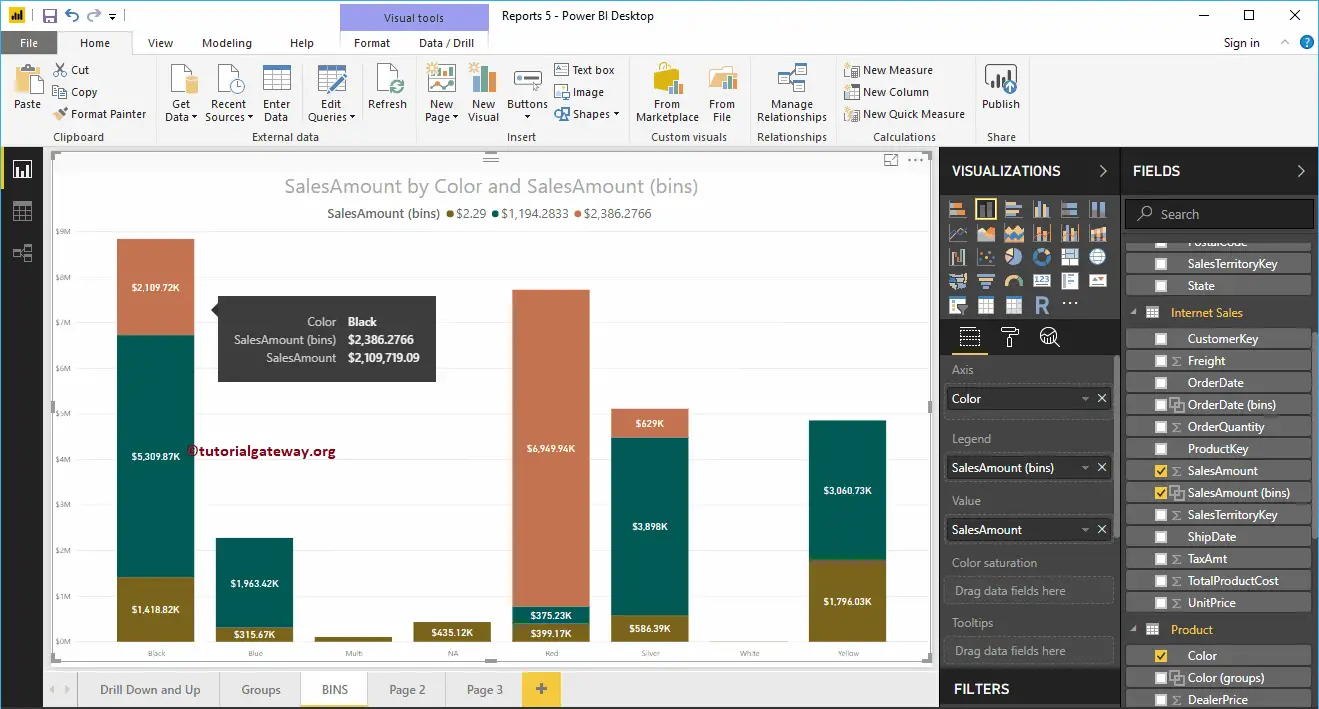
To demonstrate the Bins, we created a Column chart that shows Color wise sales. This time we create a bin on Sales Amount
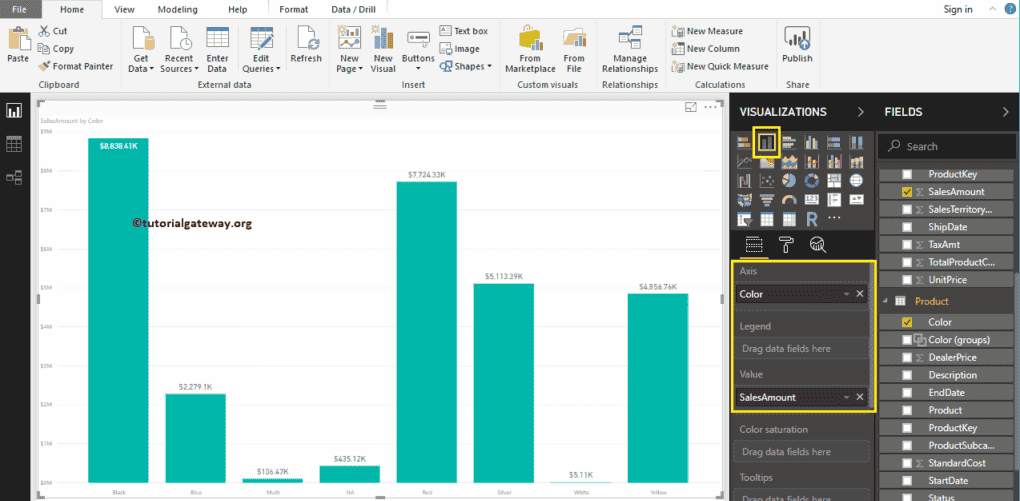
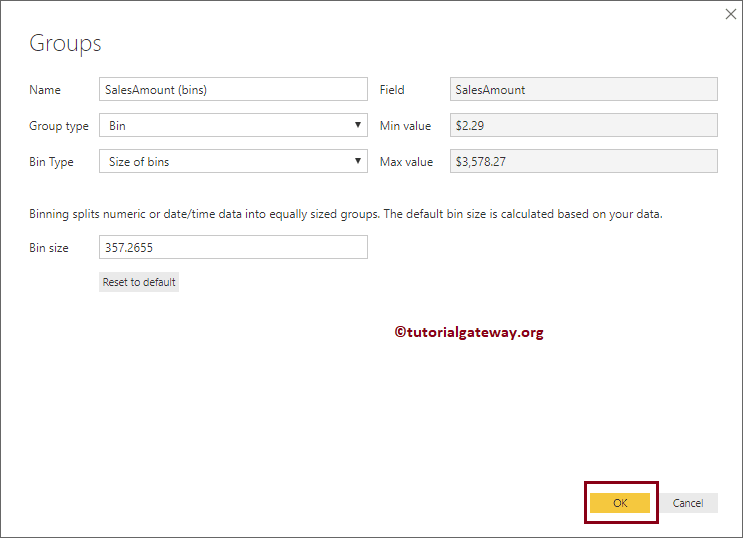
Right-click on the Sales Amount, and select the New Group option from the context menu. As you can see from the below screenshot, we defined the Power BI Bin size as the 357.2655
Let me add this new Sales Amount bin to the Column chart legend section.
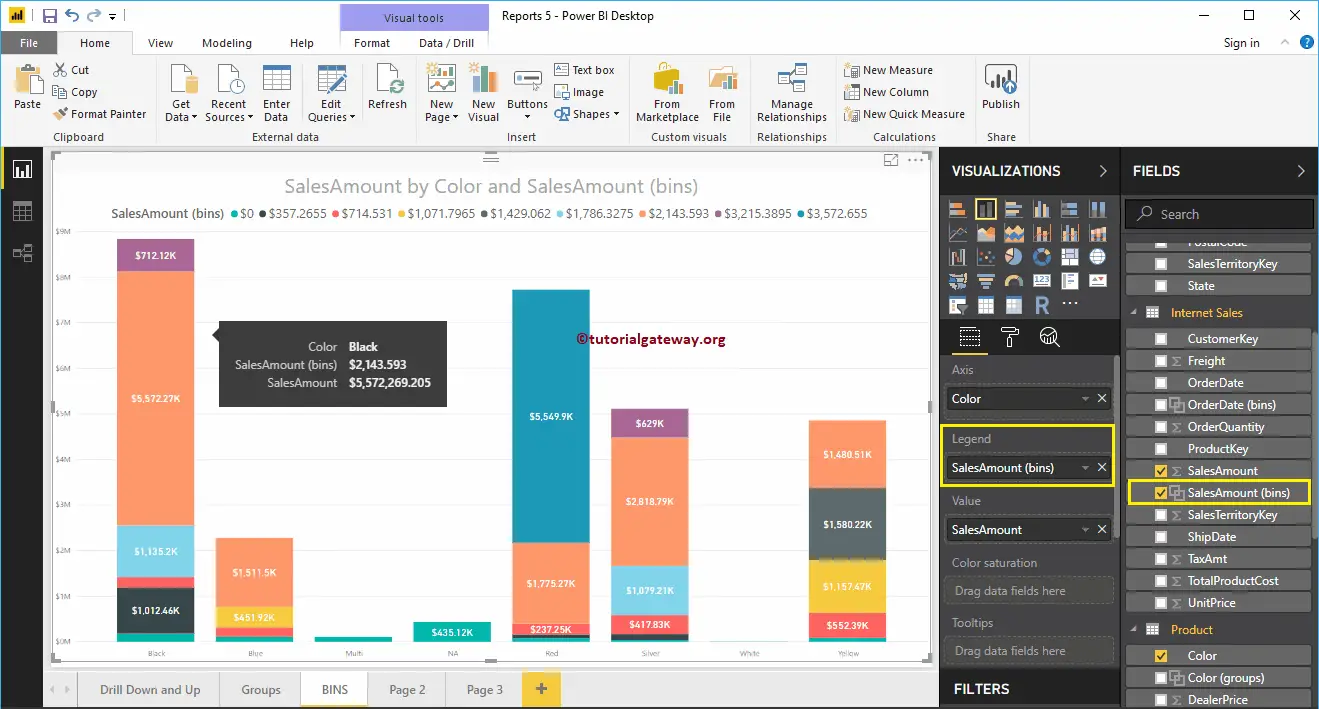
Let me Edit the Power BI Bin, and change the Bin type to Number of Bins, and Bin count to 3
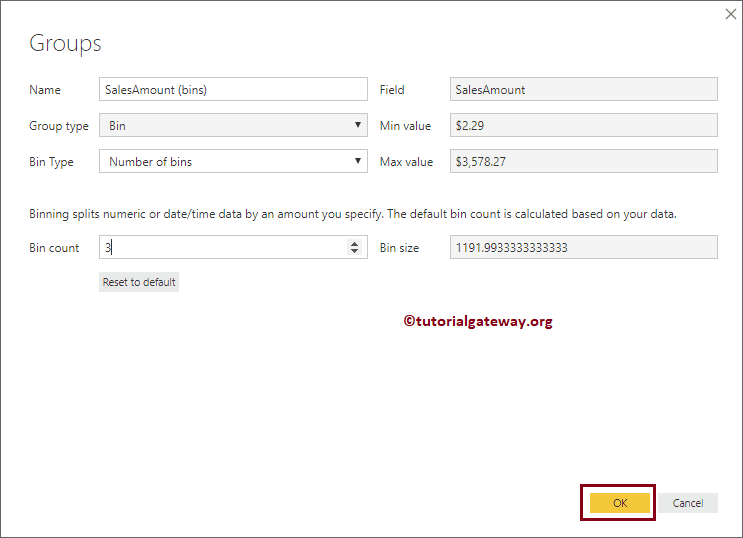
Now you can see, each bar in the column chart divided by a bin of count 3.