Users Online
· Members Online: 0
· Total Members: 207
· Newest Member: najman444
Forum Threads
Latest Articles
Articles Hierarchy
Skill 1.5: Monitor VMs
Skill 1.5: Monitor VMs
Monitoring an Azure VM involves collecting and analyzing metrics as well as collecting log data from system log files and from applications running within the VM. You can configure an email alert to an administrator that’s triggered when certain criteria involving these metrics is met. With monitoring, you gain insight into the status of your VMs, their resource utilization, their operational health, and diagnostic details that can help you troubleshoot problems.
This skill covers how to:
![]() Configure monitoring and diagnostics for a new VM
Configure monitoring and diagnostics for a new VM
![]() Configure monitoring and diagnostics for an existing VM
Configure monitoring and diagnostics for an existing VM
![]() Configure alerts
Configure alerts
![]() Monitor metrics
Monitor metrics
When you provision a VM, by default you install the Azure Virtual Machine Agent, which installs and manages extensions running within your VM. Both Windows and Linux VMs collect the following metrics at the host level. In other words, no extension needs to be installed to collect them out of the box:
![]() Disk read, disk write (in terms of KB/s or MB/s)
Disk read, disk write (in terms of KB/s or MB/s)
![]() CPU percentage
CPU percentage
![]() Network in, network out (in terms of KB/s or MB/s)
Network in, network out (in terms of KB/s or MB/s)
Another set of metrics is collected from within the guest operating system by an Azure Diagnostics extension. On Windows guest operating system VMs, the Azure Virtual Machine Agent installs the IaaSDiagnostics extension for collecting monitoring and diagnostic data. On Linux VMs, the Microsoft.Insights.VMDiagnosticsSettings extension provides the same capabilities.
You can enable diagnostics, and when you do, the appropriate diagnostic extension is installed and used to collect additional metrics.
The metrics collected differs for Windows and Linux VMS. For Linux VMs, the metrics data collection includes data from the following groups of performance counter data:
![]() CPU
CPU
![]() Disk
Disk
![]() Memory
Memory
![]() Network
Network
![]() Packets
Packets
![]() Page
Page
![]() Swap
Swap
For Windows VMs, the metrics data collection includes data from the following groups of performance counter data:
![]() CPU
CPU
![]() Disk
Disk
![]() Memory
Memory
![]() Network
Network
![]() ASP.NET
ASP.NET
![]() SQL Server
SQL Server
The metrics are stored in Azure Storage Tables, which you can view using the Azure Storage tool of your choice, or visualize the data in chart form using the Azure Portal. By default, all of the above metrics are collected every minute as a new row in the table.
For Windows VMs, metric data is written to the WADPerformanceCountersTable, with aggregates of these performance counter metrics aggregated to the minute or to the hour written to tables that start with the name WADMetricsPT1M for by minute and WADMetricsPT1H for by hour.
In addition to metrics, system logs are also collected. For Linux VM’s, the Syslog is collected into the LinuxsyslogVer2v0 table. For Windows VMs, all event log entries for the three event logs (application, security and system logs) are written to the WADWindowsEventLogsTable, where the log is indicated by the Channels column in the table, which will have the value System, Security, or Application to indicate the log source.
Windows VMs can collect other types of logs. Diagnostic infrastructure logs (events generated by the Azure Diagnostic Agent, such as issues collecting metrics) are written to the WADDiagnosticInfrastructureLogsTable, and application logs (the trace output from your .NET application running in the VM) are stored in the WADLogsTable. Windows VMs can also collect Event Tracing for Windows Events. These events are collected into the WADETWEventTable.
The Table 1-2 summarizes the Azure Storage tables used for Linux and Windows VMs.
TABLE 1-2 Storage Tables used for VM logs and diagnostics.
|
Linux |
Windows |
|
LinuxCpuVer2v0 |
WADMetricsPT1M* |
|
LinuxDiskVer2v0 |
WADMetricsPT1H* |
|
LinuxMemoryVer2v0 |
WADPerformanceCountersTable |
|
LinuxsyslogVer2v0 |
WADWindowsEventLogsTable |
|
|
WADDiagnosticInfrastructureLogsTable |
|
|
WADLogsTable |
|
|
WADETWEventTable |
*If IIS is installed within the VM, IIS logs can also be collected. The IIS logs (requests and failed request traces) are different from the others in that they are written as blobs to Azure Storage under the wad-iis-logfiles container.
*Windows VMs can be enabled to collect minidumps or full crash dumps for a configured process. The dump file is stored in an Azure Storage container whose name you specify.
One final form of diagnostics that is supported by both Windows and Linux VMs is boot diagnostics. Boot diagnostics captures the serial console output (for Linux VMs) and screenshots (for both Windows and Linux VMs) of the machine running on a host to help diagnose startup issues. The log file and bitmap (*.bmp) screenshots for a VM with the name vmname are stored in Azure Storage container named with the prefix bootdiagnostics-vmname.
Configure monitoring and diagnostics for a new VM
You can enable monitoring and diagnostics when deploying a VM. To configure monitoring diagnostics using the portal, complete the following steps:
-
Navigate to the portal accessed via https://manage.windowsazure.com.
-
Select New on the command bar.
-
Within the Marketplace list, select the Compute option.
-
On the Compute blade, select the image for the version of Windows Server or Linux you want for your VM
-
On the Basics blade, provide a name for your VM.
-
Select the VM disk type, which is either a VM disk type of SSD that will use Premium Storage or a type of HDD that will use Standard Storage.
-
Provide a user name and password (or SSH public key), and choose the subscription, resource group, and location into which you want to deploy.
-
Select OK.
-
On the Choose a size blade, select the desired tier and size for your VM.
-
Choose select.
-
On the Settings blade, under the Monitoring header, enable Boot diagnostics by setting the toggle to Enabled.
-
Similarly, enable diagnostics by setting the Guest OS diagnostics toggle to Enabled.
-
Optionally, configure the name of the new Storage Account to use to store the diagnostics or choose an existing Storage Account (Figure 1-29).
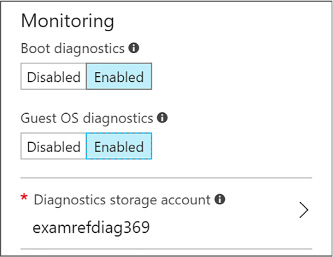
FIGURE 1-29 Monitoring are of the Settings blade
-
Select OK.
-
On the Purchase blade, review the summary and select Purchase to deploy the VM.
Configure monitoring and diagnostics for an existing VM
To enable and configure monitoring and diagnostics for an existing VM, complete the following steps:
-
Navigate to the blade for your VM in the Azure Portal.
-
From the menu, scroll down to the Monitoring section (Figure 1-30) and select Diagnostic settings.
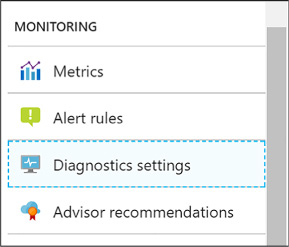
FIGURE 1-30 The Monitoring section
-
For Linux VMs, enable diagnostics by setting the Status toggle to On and selecting Save in the command bar (Figure 1-31).
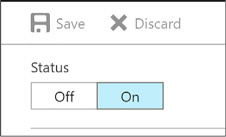
FIGURE 1-31 Linux VM toggling enable diagnostics
-
For Windows VMs, you have more granular options:
-
On the Overview tab, select Enable guest-level monitoring (Figure 1-32).
-

FIGURE 1-32 Selecting the Enable Guest-Level Monitoring button
-
-
To adjust the Performance Counters collected, select the Performance Counters tab, then select either Basic (to view a summarized list of counters) or Custom (to view the complete list of available counters). When using the Custom view, you can also set the sample rate, which defaults to every minute. Select the desired counters by checking the box next to each (Figure 1-33).
-
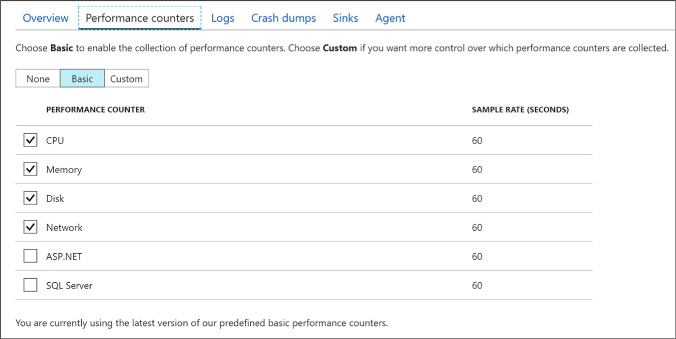
FIGURE 1-33 Performance Counters
-
-
To adjust the collected Event Logs, IIS Logs, and Application Logs, select the Logs tab. For Event Logs, select the Basic toggle to collect the default set of Event Logs or select Custom to specify specific event logs and levels to collect. For IIS Logs, select the desired logs and specify the path the Azure Storage container name in which to store them. For Application Logs, select the Enabled toggle and then select the desired Log level. For Event Tracing for Windows events, set the toggle to Enabled and configure the desired event sources by entering a provider class and log level. Configure the event manifests by entering the manifest GUID and log level (Figure 1-34).
-
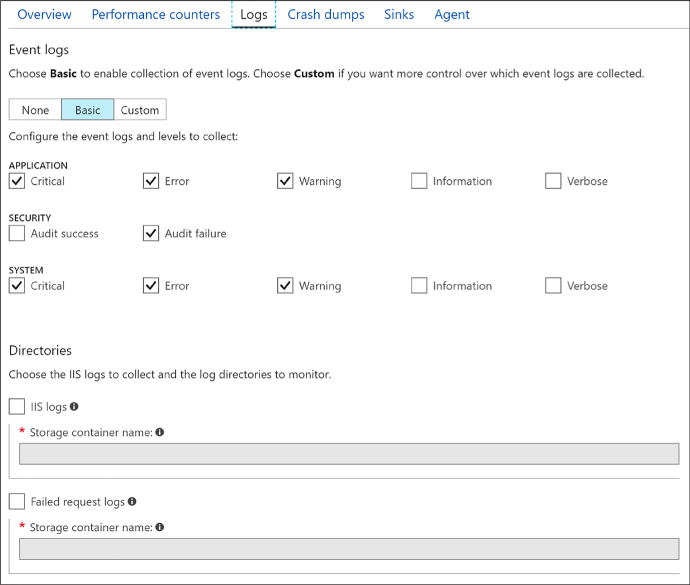
FIGURE 1-34 Configuring Logs for VM
-
-
To enable a collection of crash dumps, select the Crash Dumps tab and then set the toggle to Enabled. Enter the name of the process to monitor and select Add. Enter the name of the Azure Storage container to use in storing the dump, and select whether to capture a full dump or a minidump (Figure 1-35).
-
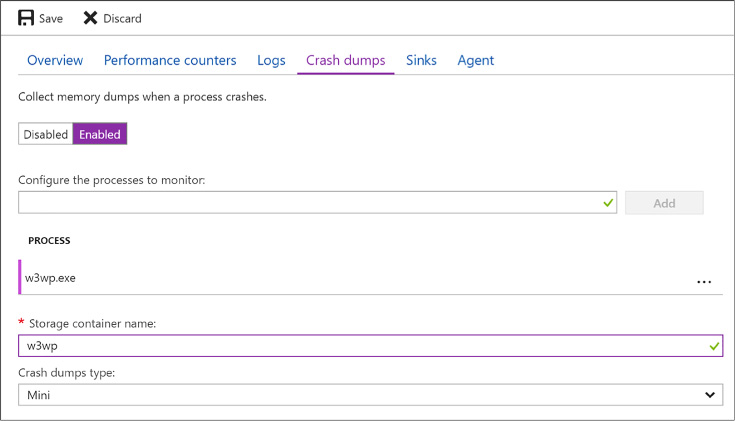
FIGURE 1-35 Configuring crash dumps for the w3wp.exe process
-
-
To enable the collection diagnostic infrastructure logs, select the Agent tab. Under the Diagnostic infrastructure logs, set the toggle to Enabled and set the desired log level (Figure 1-36).
-
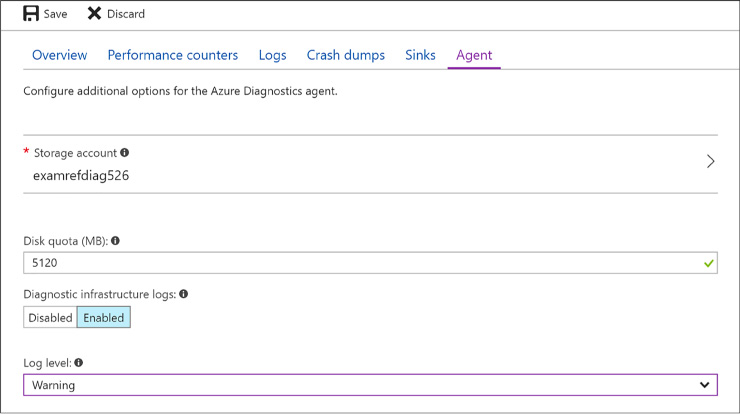
FIGURE 1-36 Changing log levels using the Agent tab
-
Select Save in the command bar to apply the new settings.
Configure alerts
After your VM is configured to collect metrics, you can configure alert rules that can send an email, invoke a Webhook, run an Azure Automation runbook, or run a Logic App when certain conditions relative to a metric are met. Additionally, you can configure alert rules on logs that can trigger an email, an SMS message, or a Webhook when a particular log event is encountered.
Configuring alerts
To configure alerts using the portal, complete the following steps:
-
Navigate to the blade for your VM in the Azure Portal.
-
In the Menu, scroll down to the Monitoring group and select Alert rules.
-
On the Alert Rules blade, select Add metric alert to specify an alert rule that triggers based upon a metric. Provide a name for the rule, select the metric source, specify the condition, and then select the desired action to take when the condition is met.
-
Select Add Activity Log Alert to specify an alert rule that triggers based upon an event appearing in the activity log. Provide a name for the rule, specify the criteria that described the desired event, provide an action group name and short name, and then select the desired action to take when the event is matched.
-
Click OK to create the new rule.
Monitor metrics
You can assess the status and health of your VM by viewing its metrics in the portal, by querying table storage for diagnostic logs, or by downloading IIS logs from Azure Storage.
Monitoring metrics
Using the portal you can drill into charts and change the metrics displayed in detail by completing the following steps:
-
Navigate to the blade for your VM in the Portal.
-
From the menu, scroll down to the Monitoring group and select Metrics.
-
Select from the desired metrics from the list of available host and guest OS metrics.
-
The charts will update to display the desired metrics (Figure 1-37).
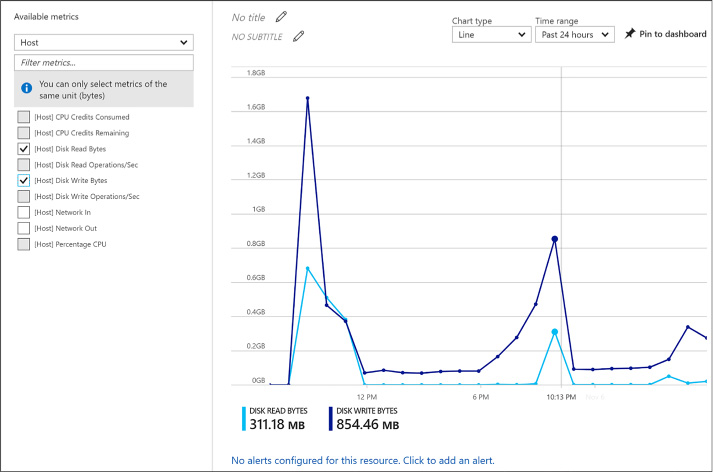
FIGURE 1-37 Selecting Disk Read Bytes and Disk Write Bytes metrics
-
Use the Chart type drop down to change the visualization used and the Time range drop down to adjust the time period over which the metric is displayed (Figure 1-38).

FIGURE 1-38 The Line Chart Type
Viewing event logs, diagnostic infrastructure logs, and application logs
You can view Windows event logs, the diagnostic infrastructure logs, and application logs by querying their respective tables (WADWindowsEventLogsTable, WADDiagnosticInfrastructureLogsTable, WADLogsTable) in Table storage using the tool of your choice. The following steps demonstrate how to do this using Visual Studio.
-
Launch Visual Studio.
-
On the View menu, click Server Explorer.
-
Expand the node labeled Azure. If prompted to do so, log in with your organizational account or the Microsoft account that is associated with the website you want to manage.
-
Expand Storage.
-
Expand the storage account containing the logs.
-
Expand Tables.
-
Right-click the table you want to query and select View Table to display its contents.
Viewing IIS logs
IIS logs can be retrieved from Blob storage using the tool of your choice. The following steps show how to do this using Visual Studio.
-
Launch Visual Studio.
-
On the View menu, click Server Explorer.
-
Expand the node labeled Azure. If prompted to do so, log in with your organizational account or the Microsoft account that is associated with the website you want to manage.
-
Expand Storage.
-
Expand Blobs.
-
Right-click wad-iis-logs and select View Blob Container to display its contents. Each log is listed, so double-click a log to download and open it.
Viewing boot diagnostics
The collected boot diagnostic logs or screenshot can be viewed using the Azure Portal.
-
Navigate to the blade for your VM in the Azure Portal.
-
From the menu, scroll down to then Support + Troubleshooting section and select Boot diagnostics.
-
For Linux VM’s the log will be displayed by default. From the command bar, use the Log button to download the log file or the Screenshot button to download the latest screenshot bitmap. For Windows VM’s, the latest screenshot will be displayed. Use the Screenshot button in the command bar to download a copy of the screenshot.

