Power BI Slicer is commonly used to add filters to the canvas or to display filters on the report canvas. Let me show you how to Create a Slicer in Power BI with an example.
For this Power BI Slicer demonstration, we are going to use the SQL Data Source that we created in our previous article. So, Please refer to Connect Power BI to SQL Server article to understand the Power BI Data Source.
How to Create a Power BI Slicer
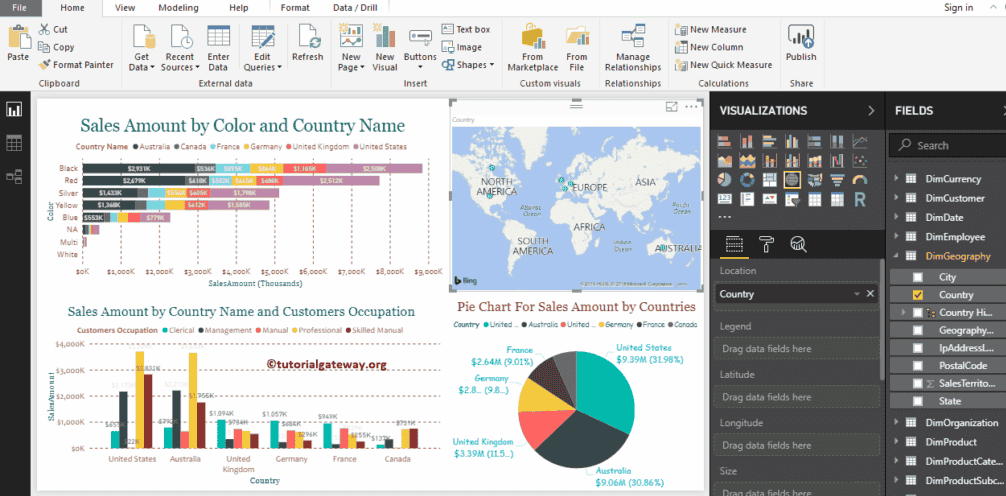
We are going to use this page to demonstrate the steps involved in creating a Power BI Slicer. This page contains Stacked Bar Chart, Clustered Column Chart, and Pie Chart.
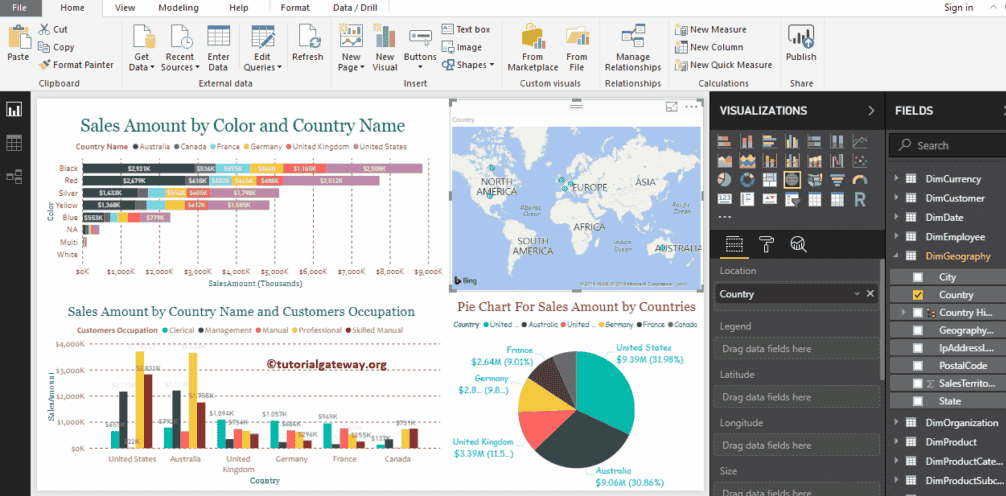
To create a Slicer in Power BI, first Drag and Drop the fields that you want to use as a filter to the Canvas region.
In this example, we want to use Country as the Filter for this report. So, let me drag the Country from the Geography table to the Canvas. It will automatically create a Map for you.
Click on the Slicer under the Visualization section. It will convert a Map into Slicer. From the screenshot below, you can see the list of countries.
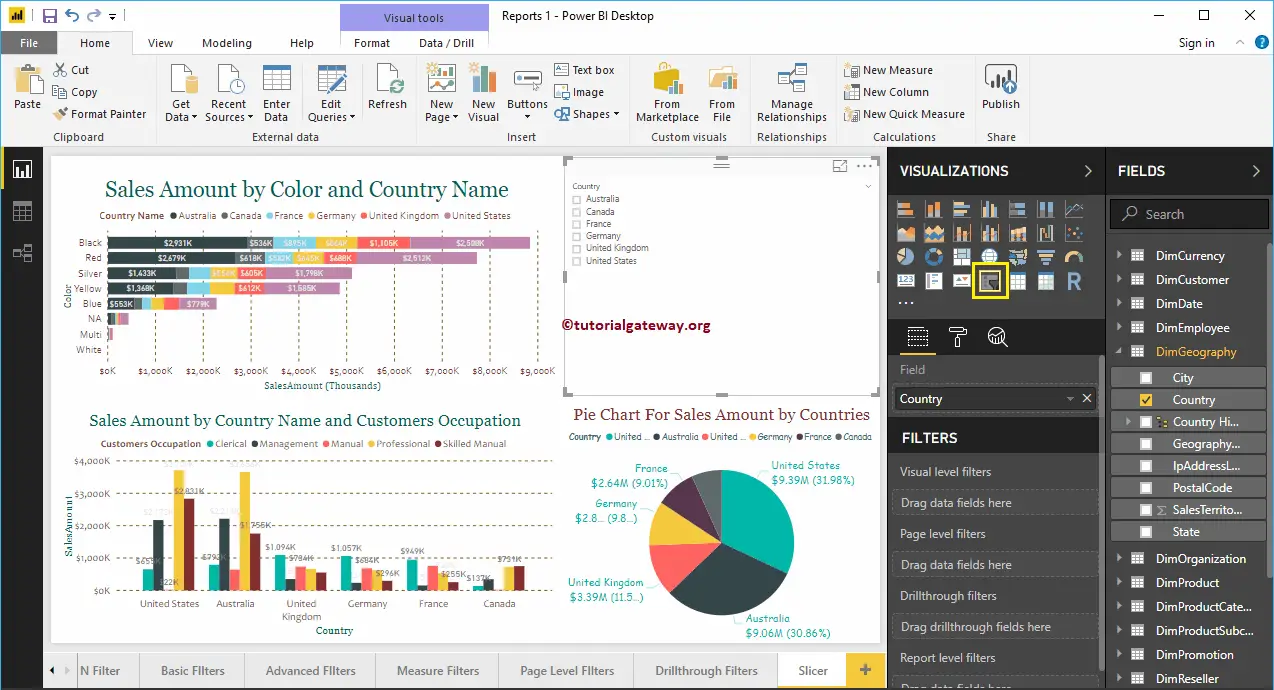
Create a Power Bi Slicer Approach 2
First, click on the Slicer under the Visualization section. It automatically creates a Slicer with dummy data, as shown below.
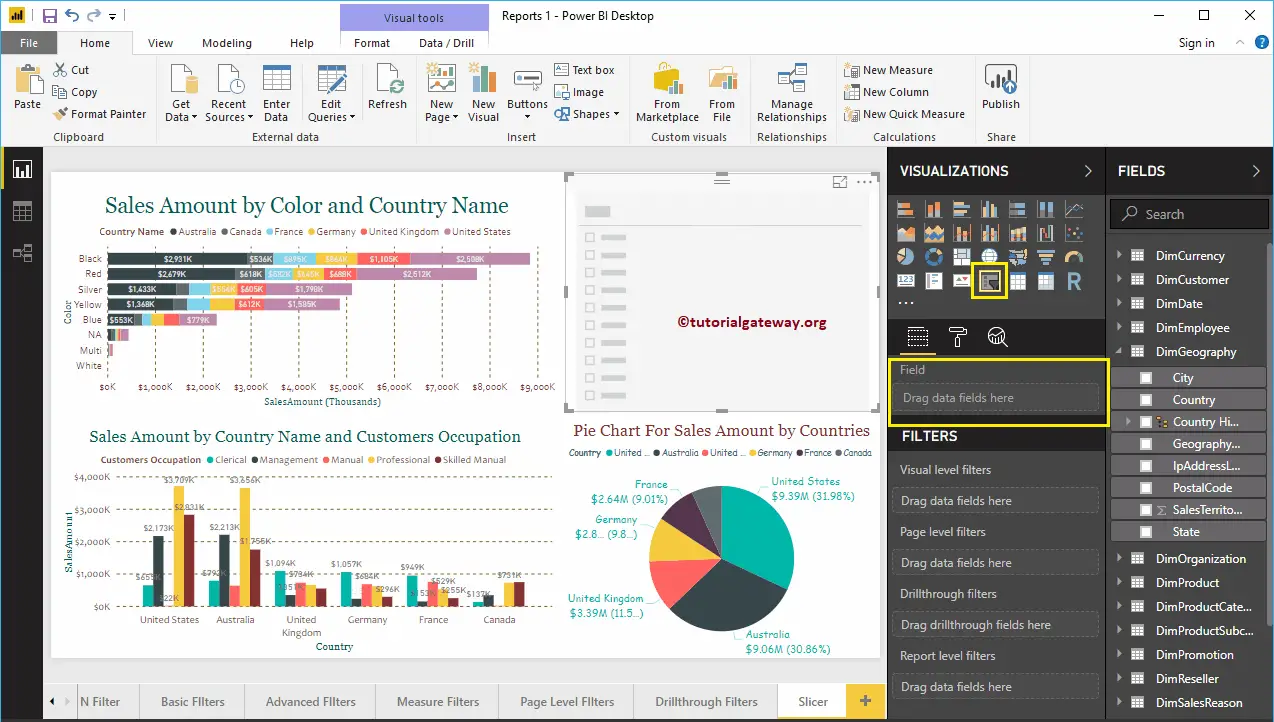
In order to add data to a Slicer, please drag and drop the filter field to the Fields section. Let me add Country to the Fields section.
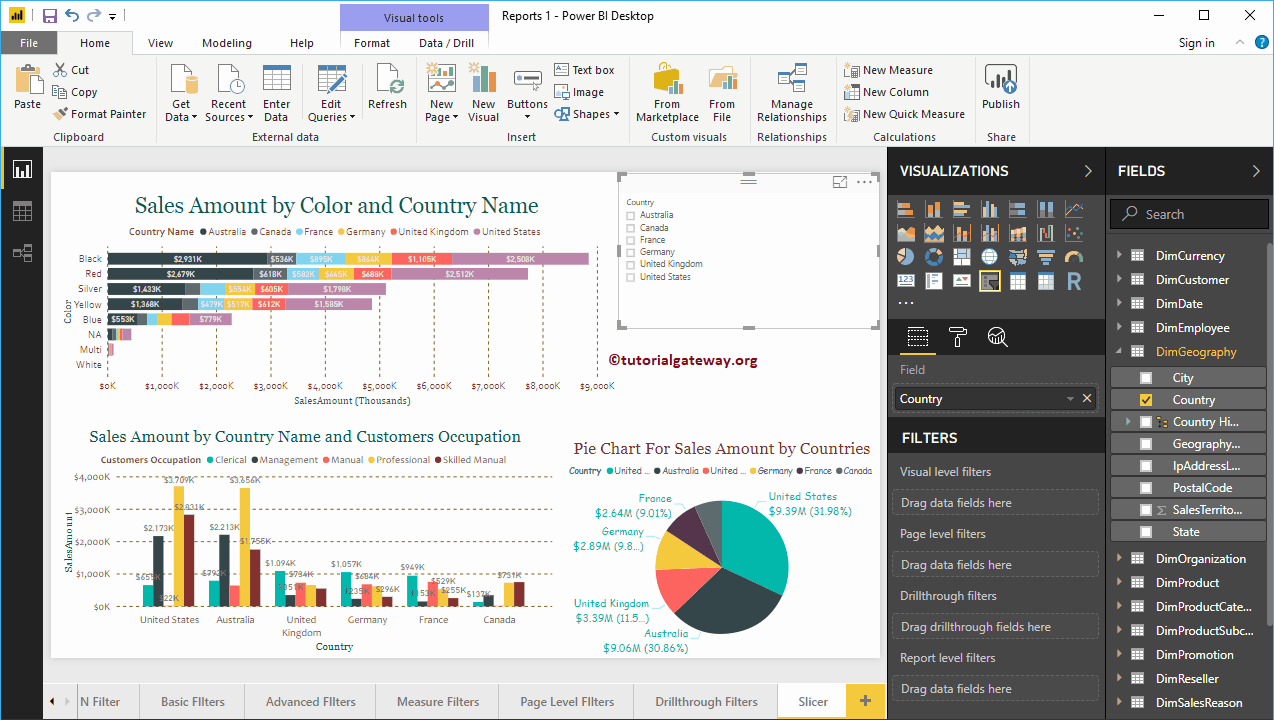
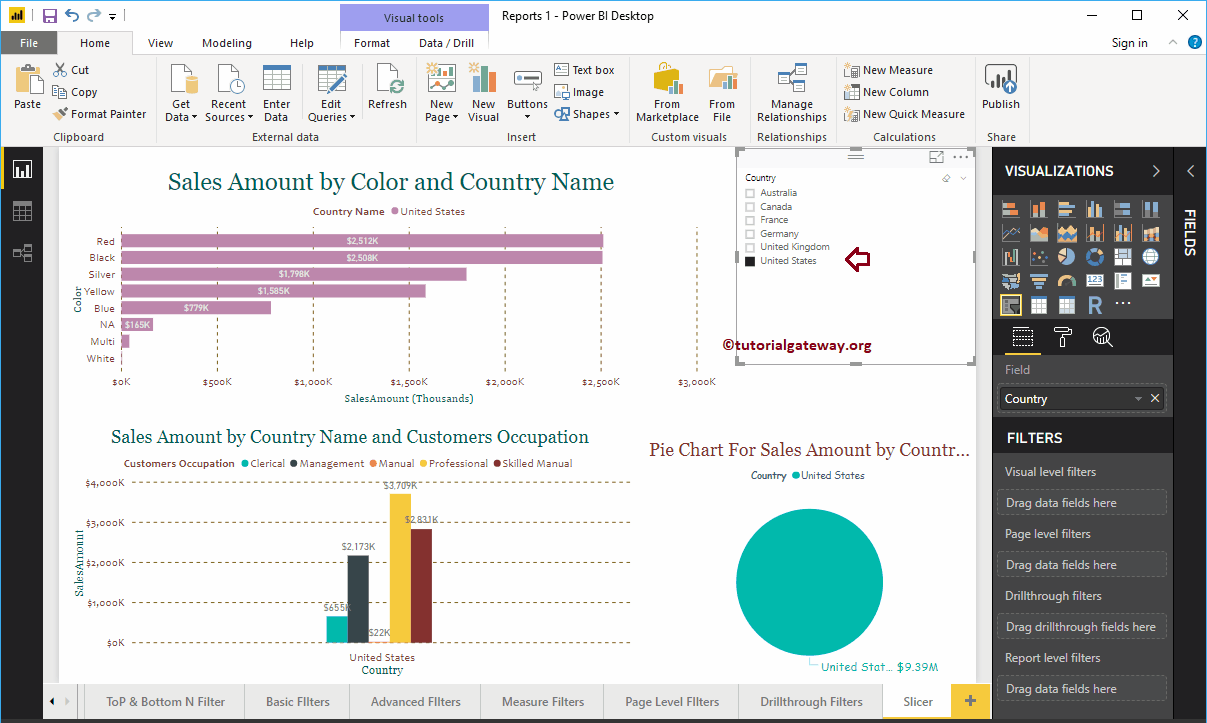
For the demo purpose, let me select the United States. From the screenshot below, you can see that the Stacked Column chart, Pie Chart, and Clustered Column charts are displaying the Sales for the united states.
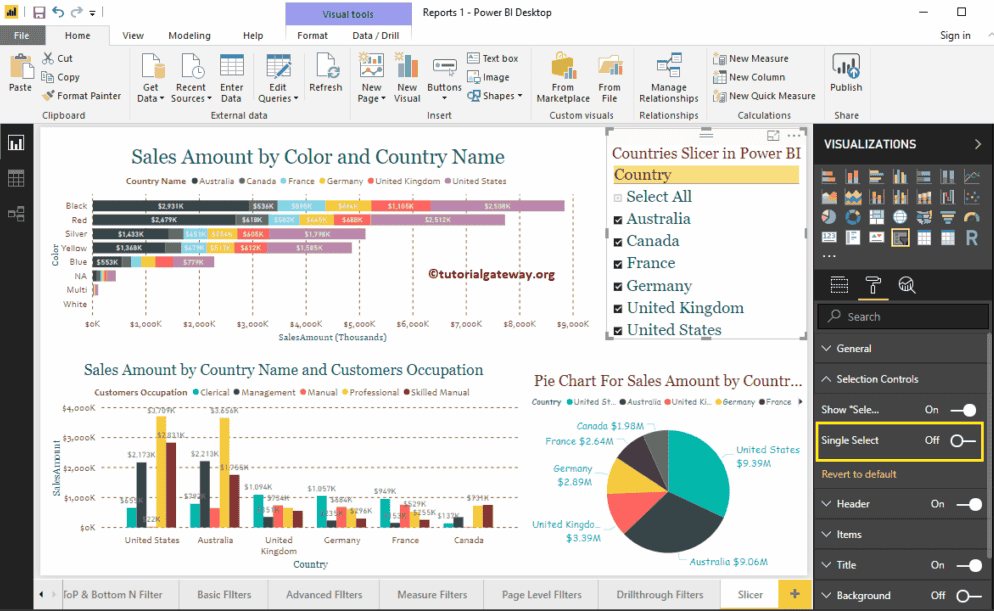
TIP: By default, you can only select One field (Country) at a time. For multiple select, you have to toggle Single Select option from On to Off in the format section.
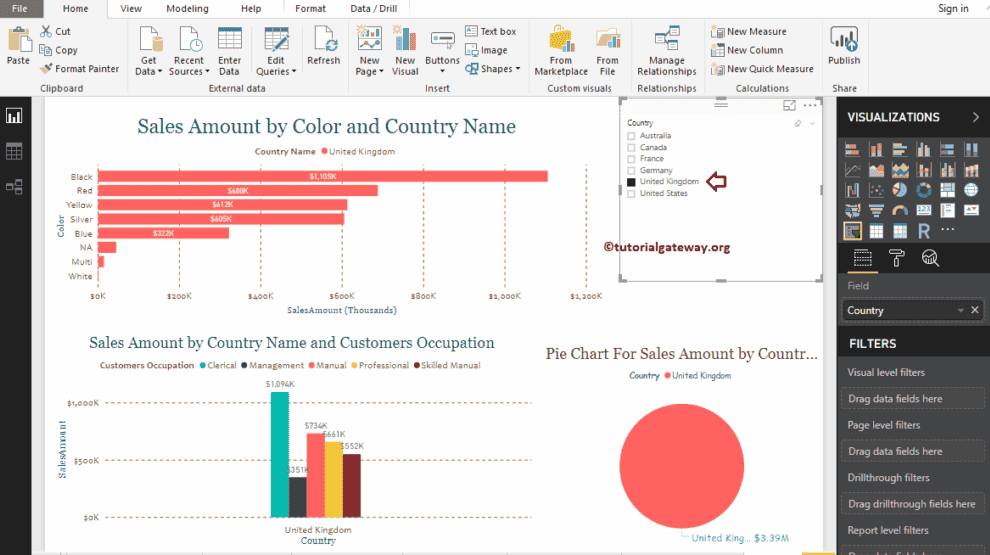
This time we selected the United Kingdom. From the screenshot below, you can see that the filter applied on all charts.
How to Format Power BI Slicer
Please click on the Format button to see the list of formatting options that are available for this Power BI Slicer.
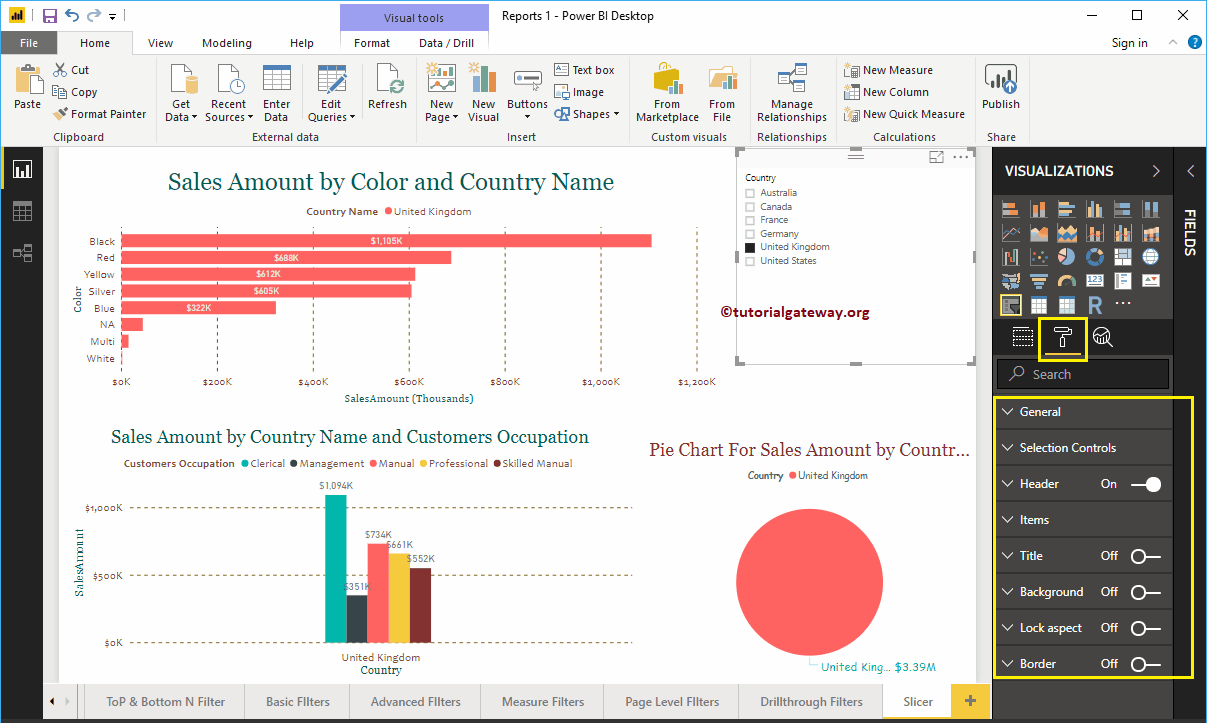
Format Power BI Slicer General Settings
Use this General Section to Change the Outline Weight, Outline Color, X, Y position, Width, and height of a slicer
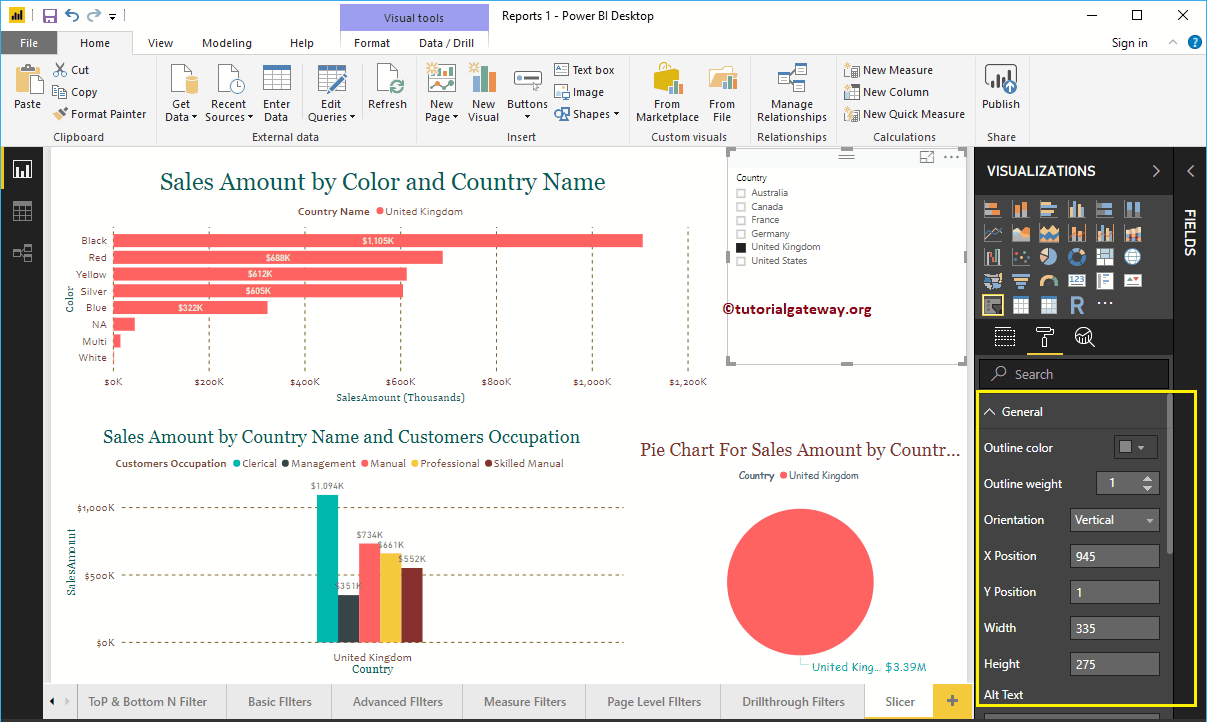
Format Header of a Slicer in Power BI
As you can see from the screenshot below, we added Background Color, Outline to bottom. Next, we changed the text size to 20, and Font family to Georgia.
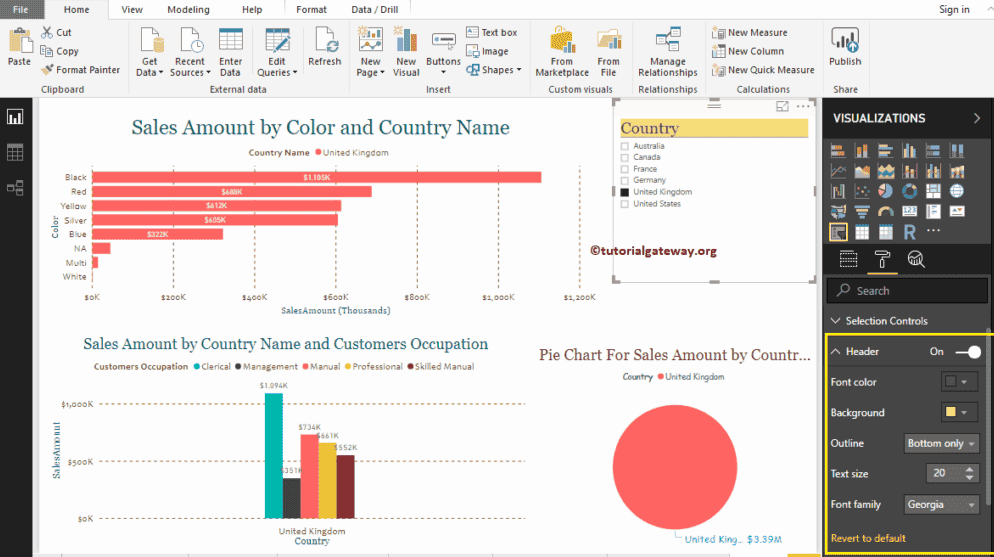
Format Power BI Slicer Items
We changed the Items (Countries) font color to Green, text size to 20, and Font family to Georgia.
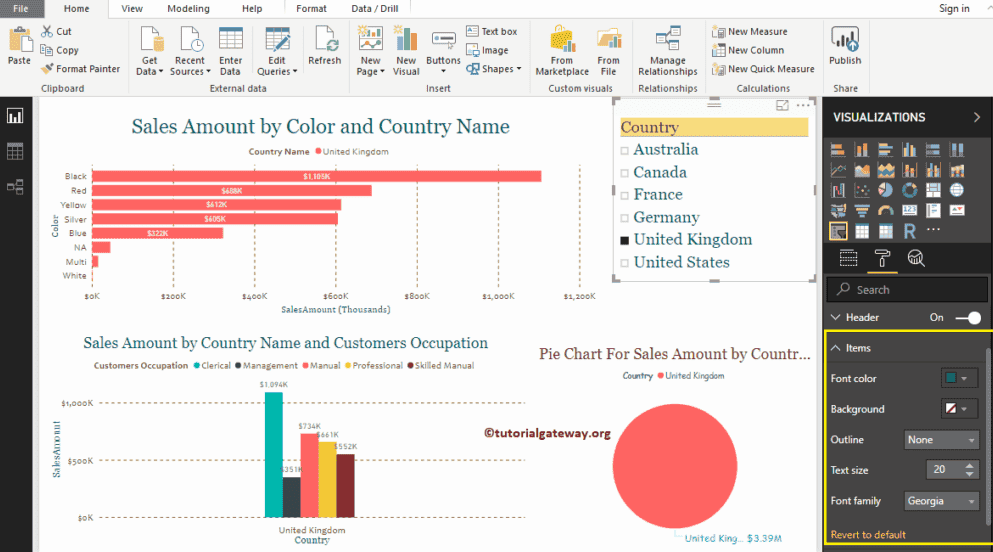
Format Slicer Title
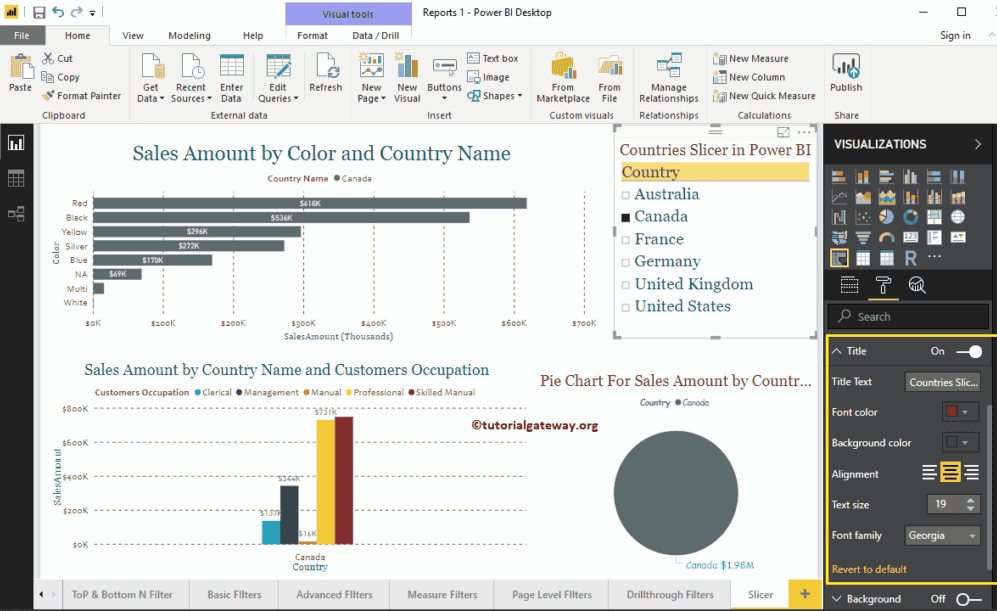
By toggling the Title option from Off to On, you can add a title to the Slicer.
From the screenshot below, you can see we added the Title Text as Countries Slicer in Power BI. Next, change the Font Color to Red, Title Alignment to center, Font Family to Georgia, and Text Size to 19.
Format Power BI Slicer Background Color and Borders
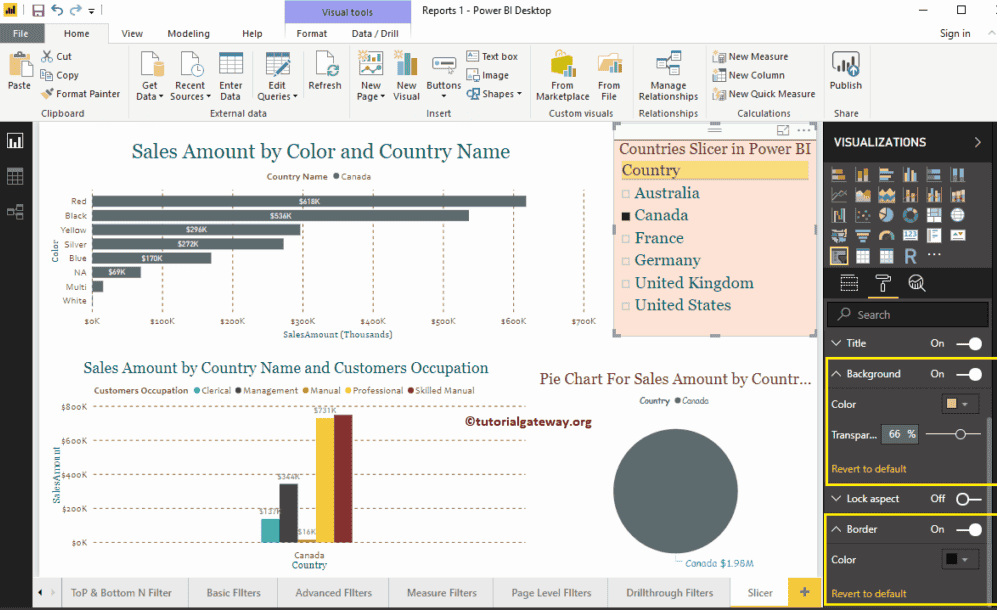
You can add the Background color to a slicer by toggling Background option to On. For the demonstration purpose, we added a random color with 66% transparency.
Similarly, you can add Borders to a slicer by toggling the Border option from Off to On.
Format Slicer Selection Control
The selection controls section helps you to format the Power BI slicer selection control. This section has two properties:
- Show Select All: It adds Select All option to the Slicer.
- Single Select: It restricts the slicer selection to one item at a time.
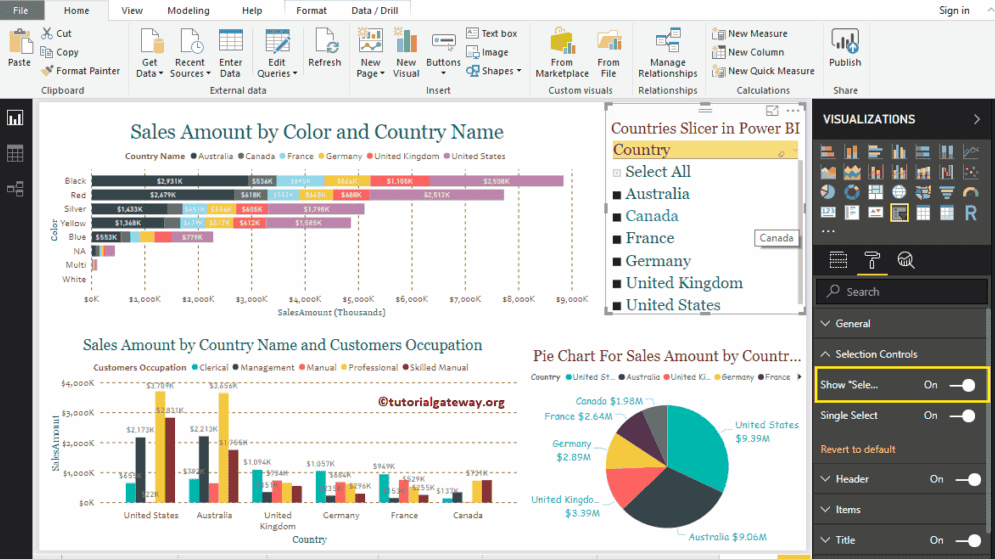
Let me toggle the Show Select All option from Off to On. Now, you can see Select All under the Country Slicer
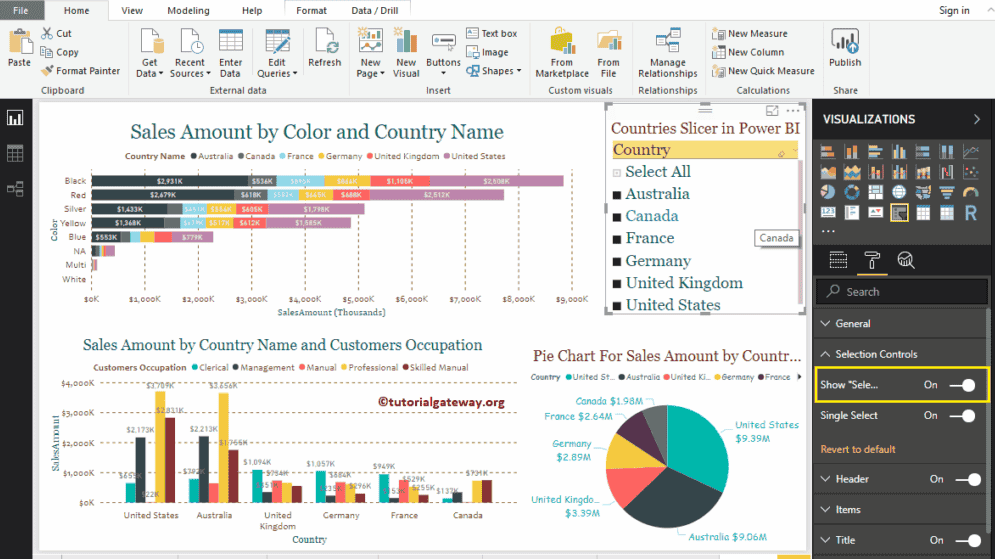
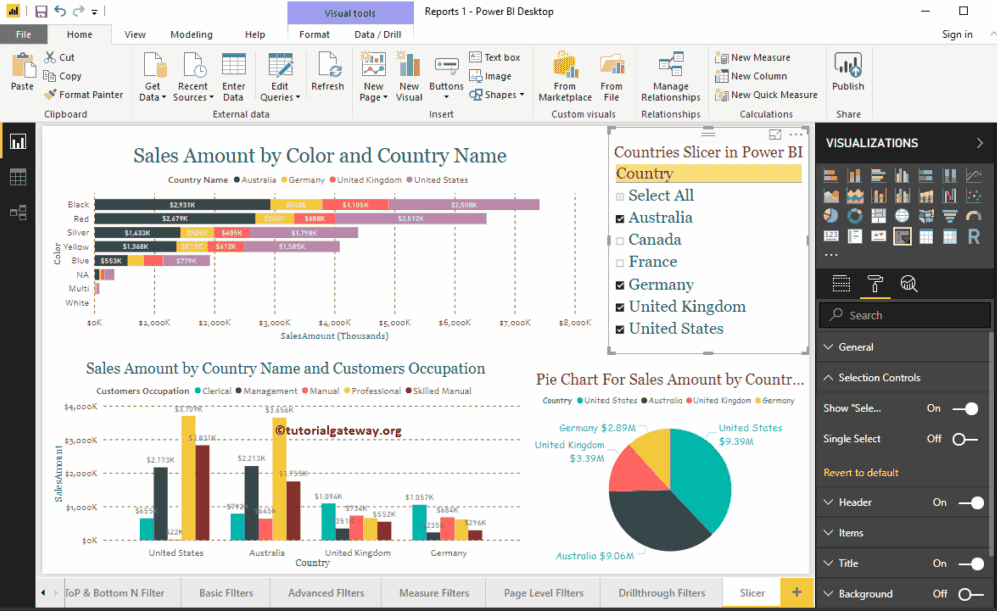
By toggling Single Select option from On to Off, you can enable the slicer to select multiple fields.
Let me select Australia, Germany, the United Kingdom, and the United States.
Power BI Basic Filters
Power BI Filters are useful to restrict the data as per the requirements. For example, using Power BI basic filters, we can exclude a product from the display, or we can display top/bottom 10 performing records. Let me show you how to create Power BI basic filters with example.
How to use Power BI Basic Filters
To demonstrate the Basic Filters in Power BI, we are going to use the Clustered Column Chart that we created in our earlier post. As you can see from the screenshot Power BI below, we used the Country Name as the Axis field, Occupation as Legend field, and Sales amount as the Value field.
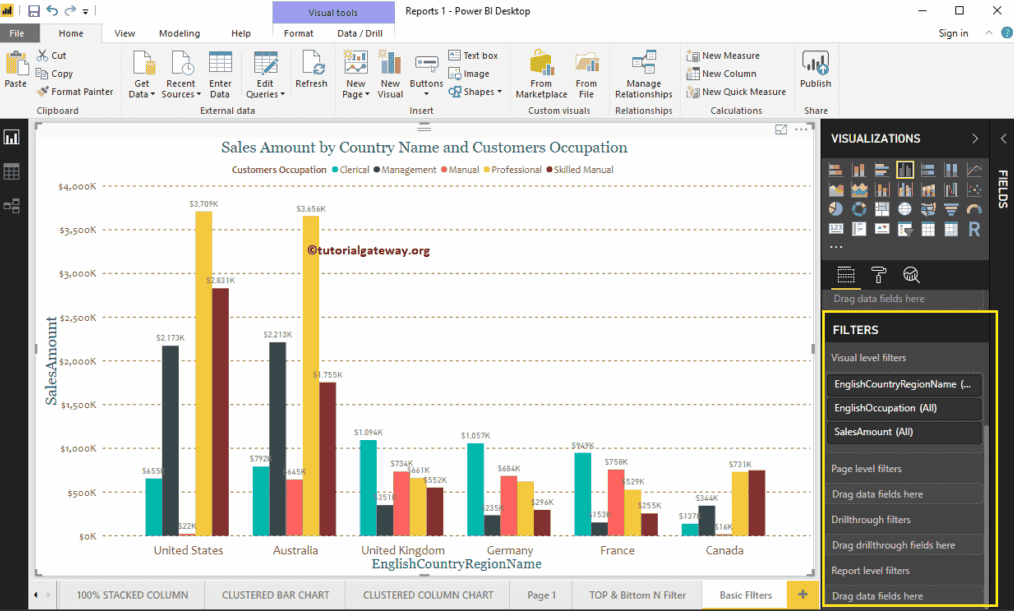
Under the Filters section, you can see the list of filters that are available in Power BI
- Visual Level Filters: It includes Filters on Dimension, Filters on Measures, Basic Filters, Advanced Filters, and Top N filters
- Page-Level Filters: These Page Level Filters apply to all the visuals present in the current page.
- Drill through Filters: This Drill through Filters helps you to drill through the particular region, or particular category, etc.
- Report Level Filters: These Report Level Filters apply to all the pages that are present in the current Report.
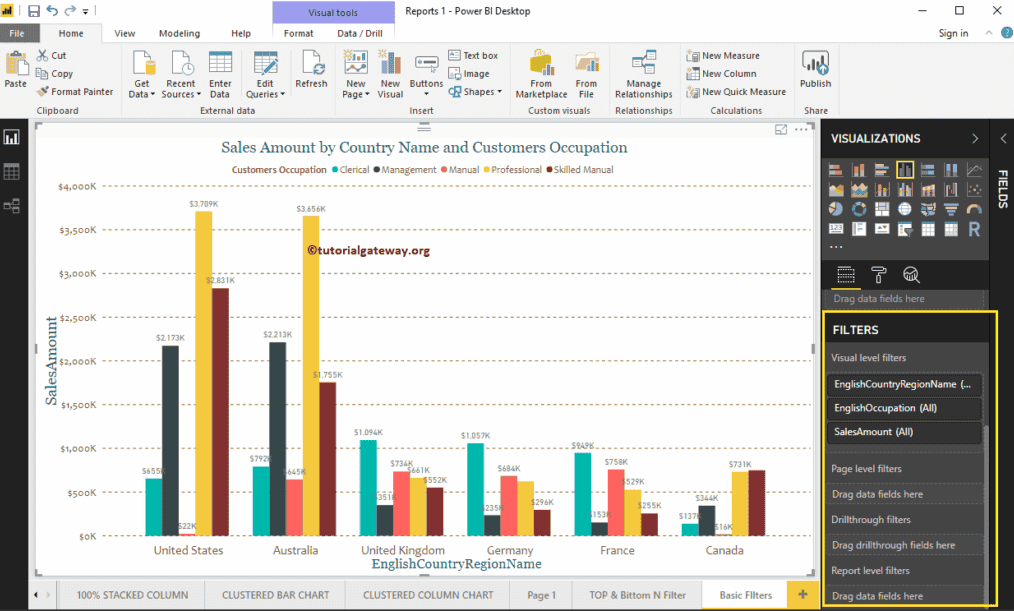
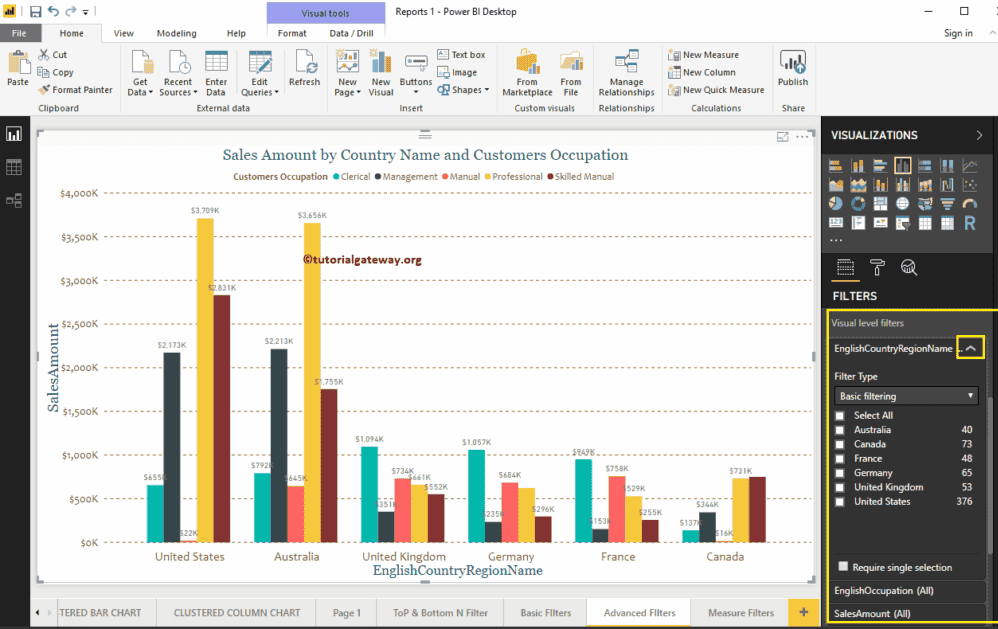
Let me expand the English Country Region Name (in Short Country) to see the filter types.
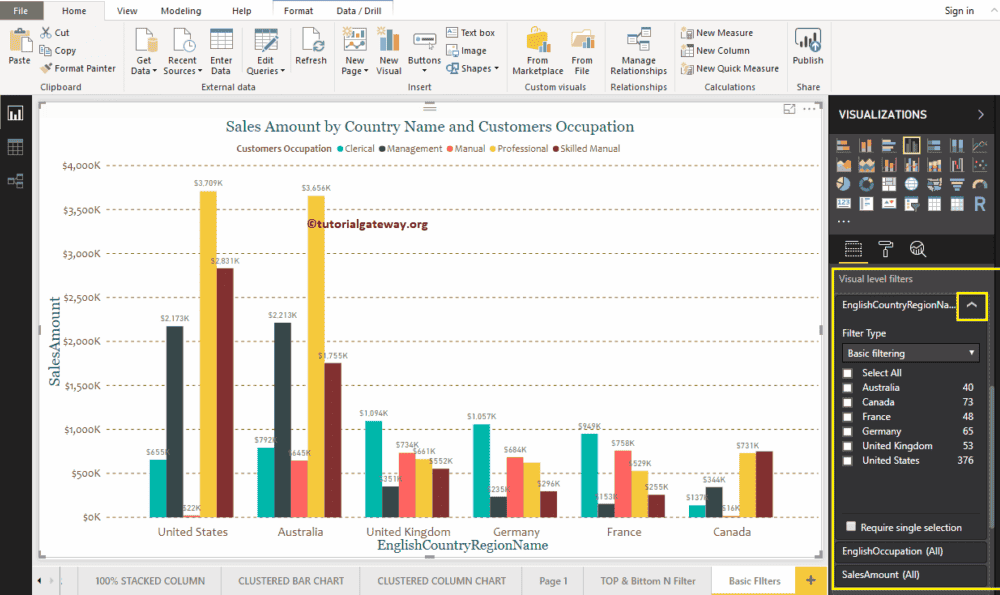
Use the drop-down list to see the list of Power BI filter types available for dimension.
- Advanced Filtering: This option helps you to use more advanced options like starts with, ends with, contains, etc.
- Power BI Basic Filters: It used to perform basic operations.
- Top N: Use this to find the top 10 records or bottom 10 records.
In this example, we want to discuss the Power BI basic filters so, let me select the same.
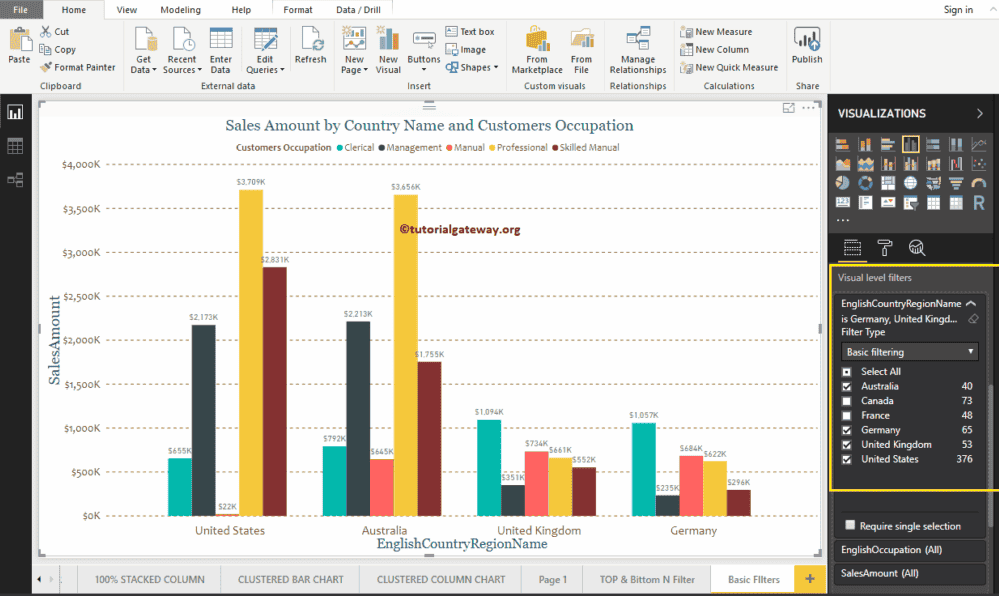
Selecting Basic Filters in Power BI display the rows that are available for this column. You can use the checkboxes to select One, None (or All)
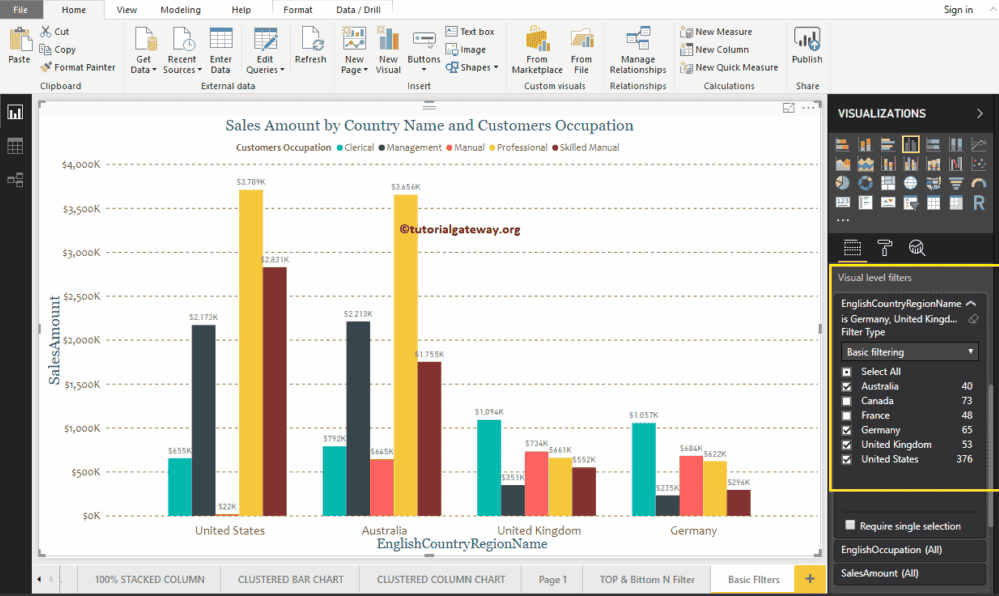
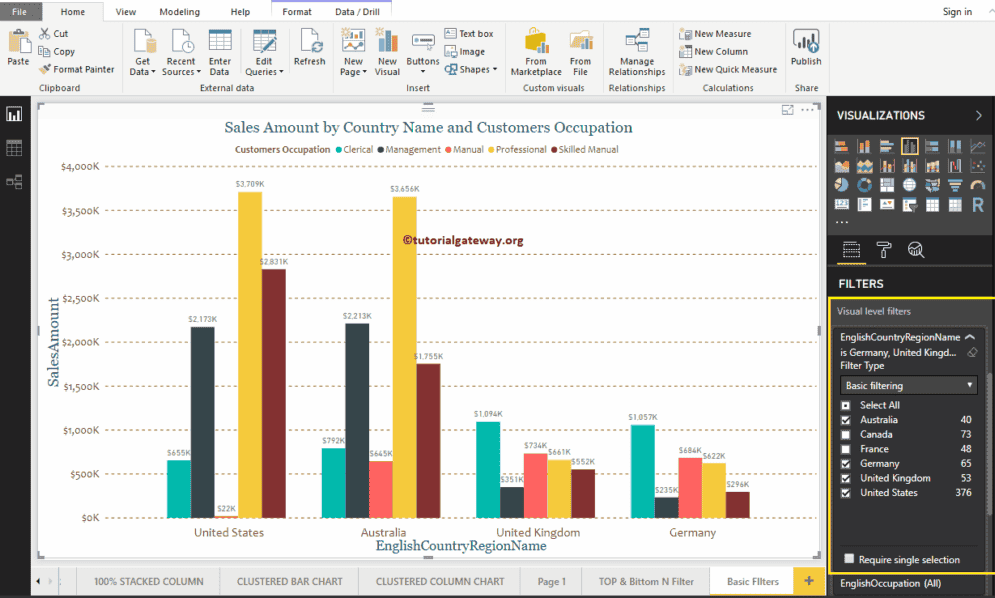
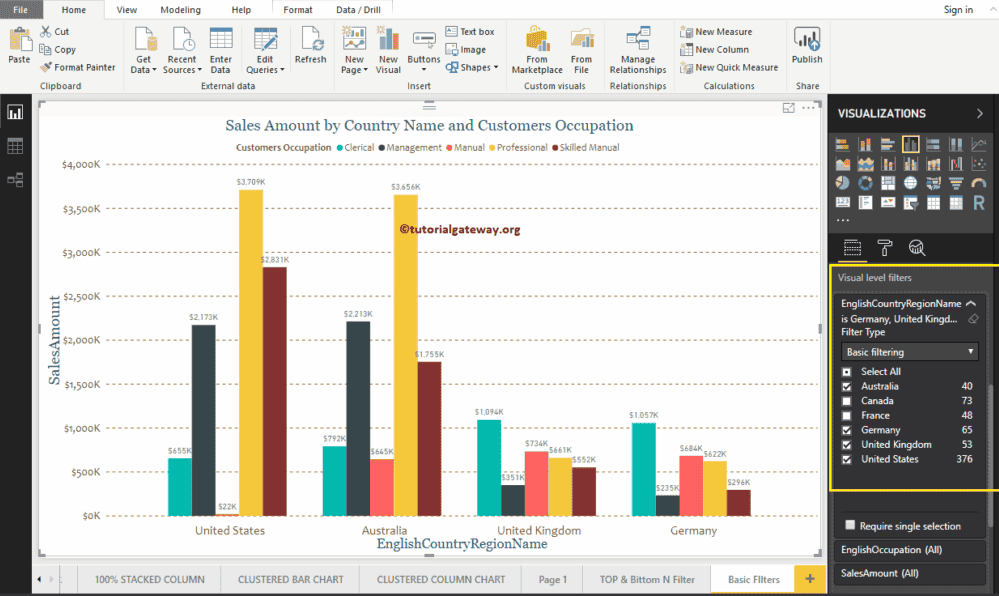
Let me select Australia, Germany, the United Kingdom, and the United States. From the screenshot below, you can see that the clustered column chart is displaying the column that belongs to sleeted countries.
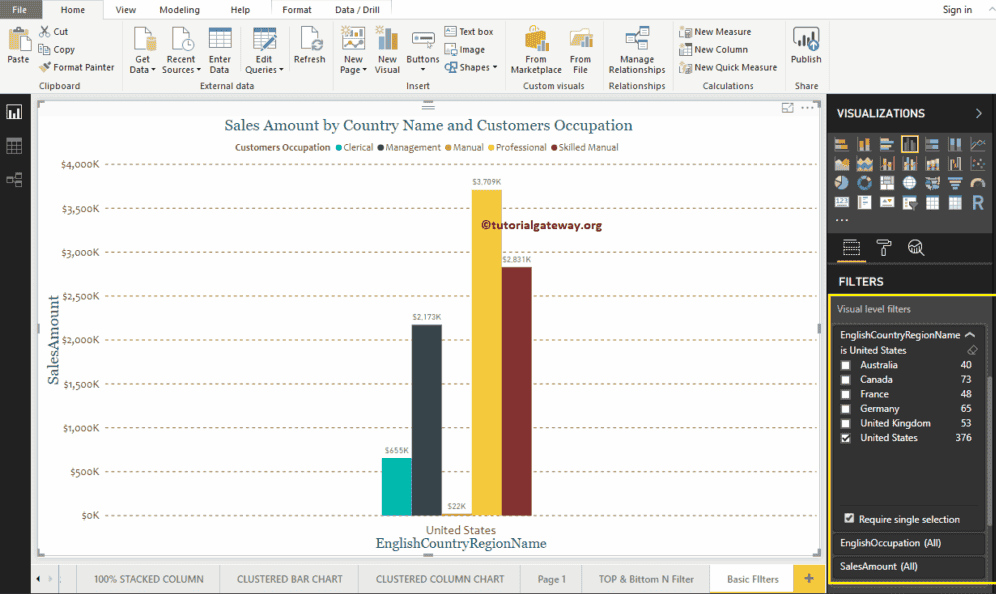
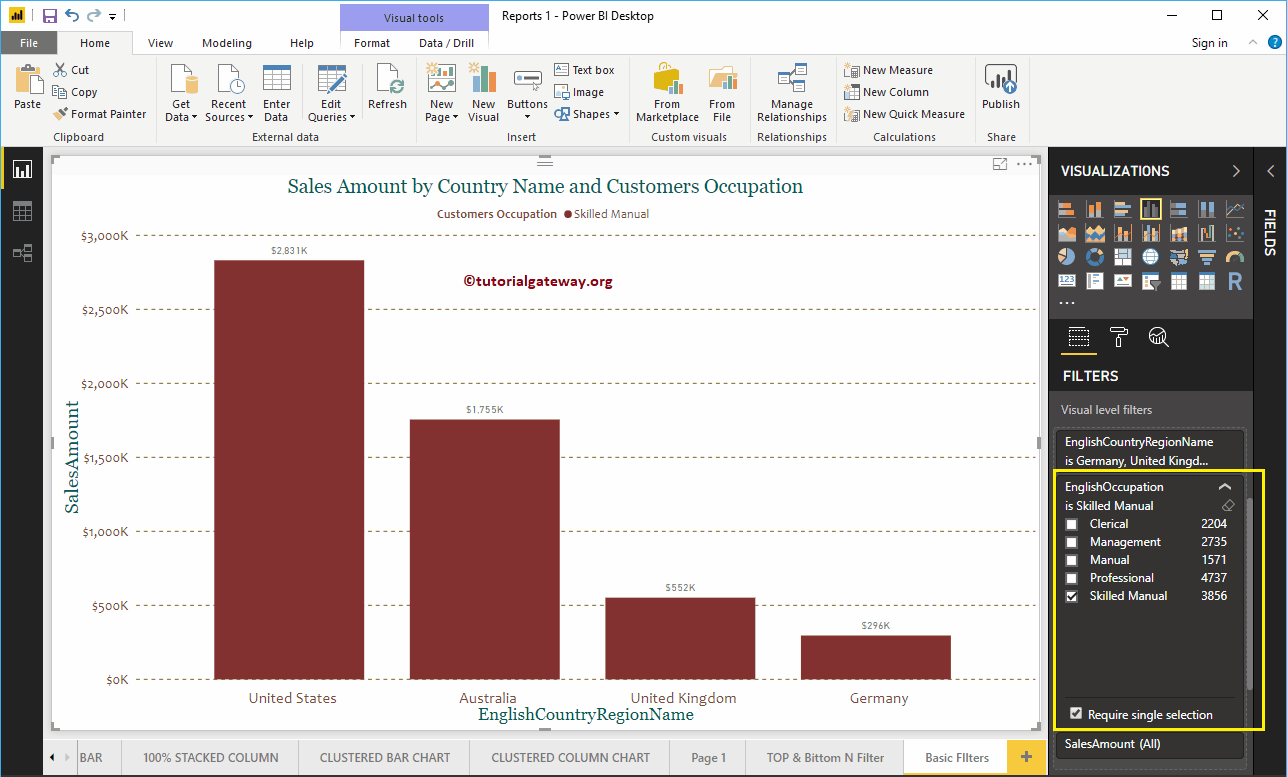
Required Single Selection: It restricts us to select one field at a time. I mean, now you can select only one country name at a time.
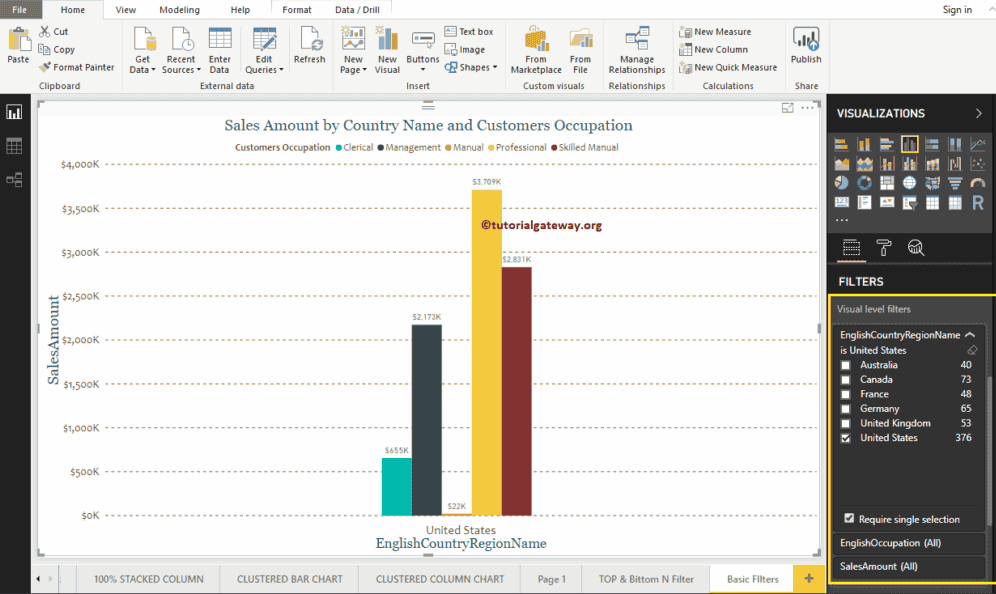
As you can see, we selected the United States.
By unchecking the Required Single Selection property, you can select multiple fields.
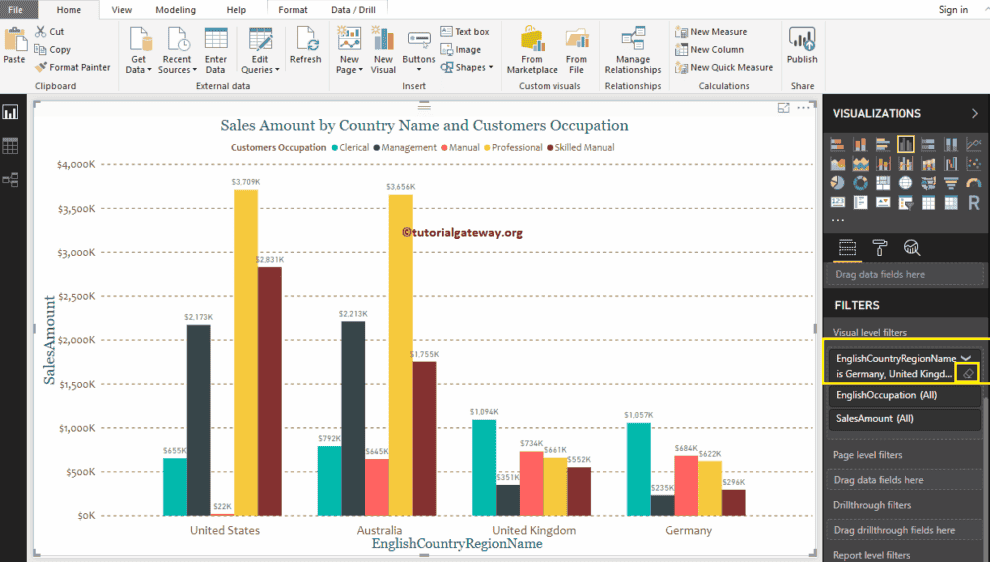
By clicking that little tiny clear filter button helps you remove the existing filters.
Power BI basic Filters on Multiple dimensions
Let me expand the English Occupation column to apply filters on Occupation.
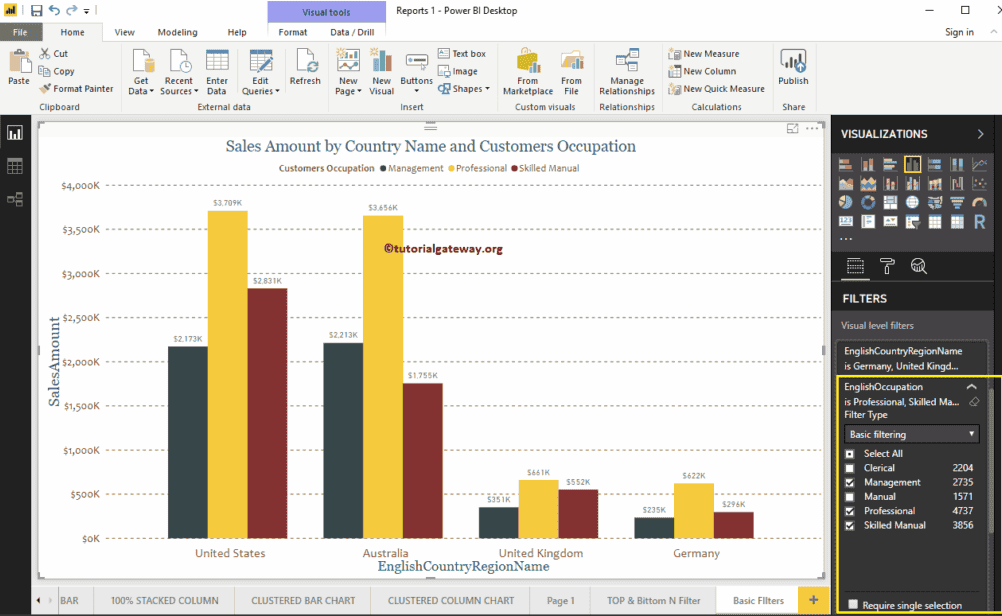
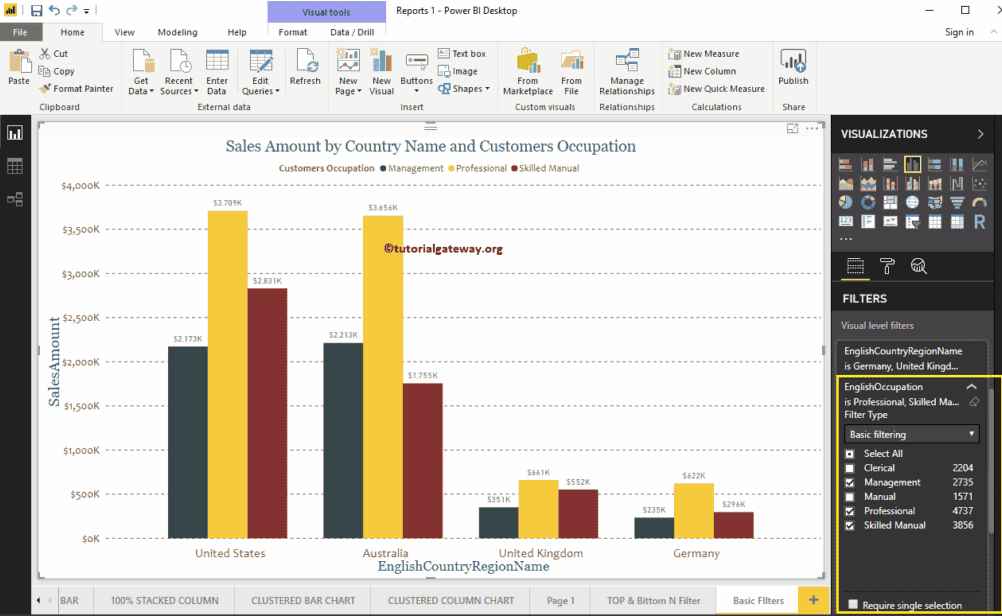
Let me select the Management, Professional, and Skilled Manual fields as the basic filtering values. As you can see from the screenshot below, it is displaying 4 countries that we selected in Countries Filters and Three occupations that we selected now.
This time, we are selecting a single field, i.e., Skilled Manual.
Delete Power BI Filters
Click on the tiny little Clear filter button to delete existing filters. For the demo purpose, let me delete the filter on the Occupation field.
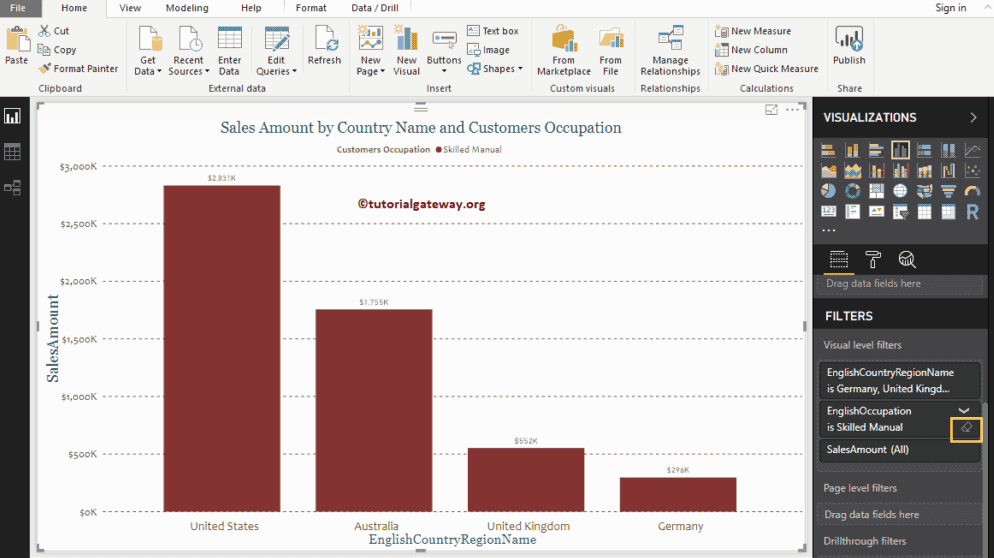
You can see that the Occupation field has no Filters
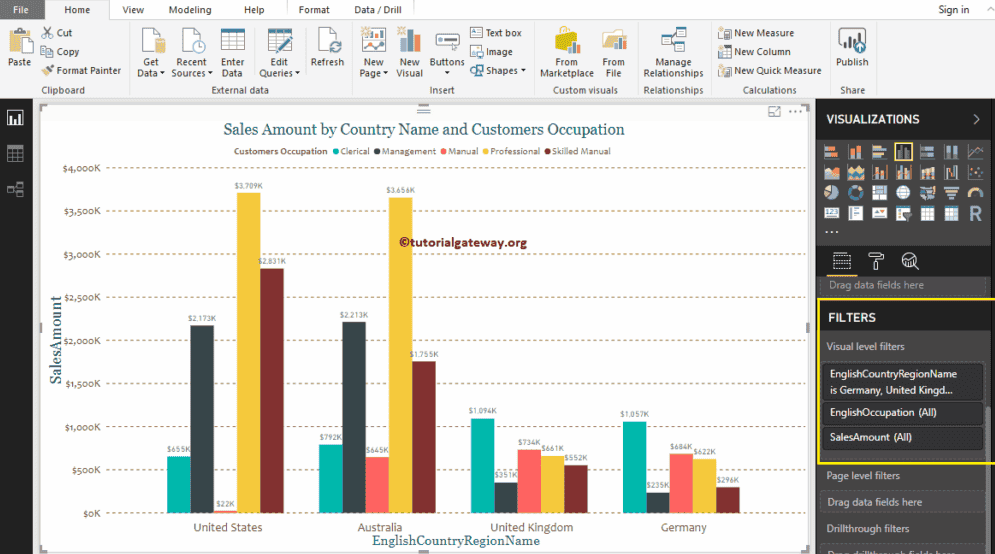
Let me remove the filters on the Country
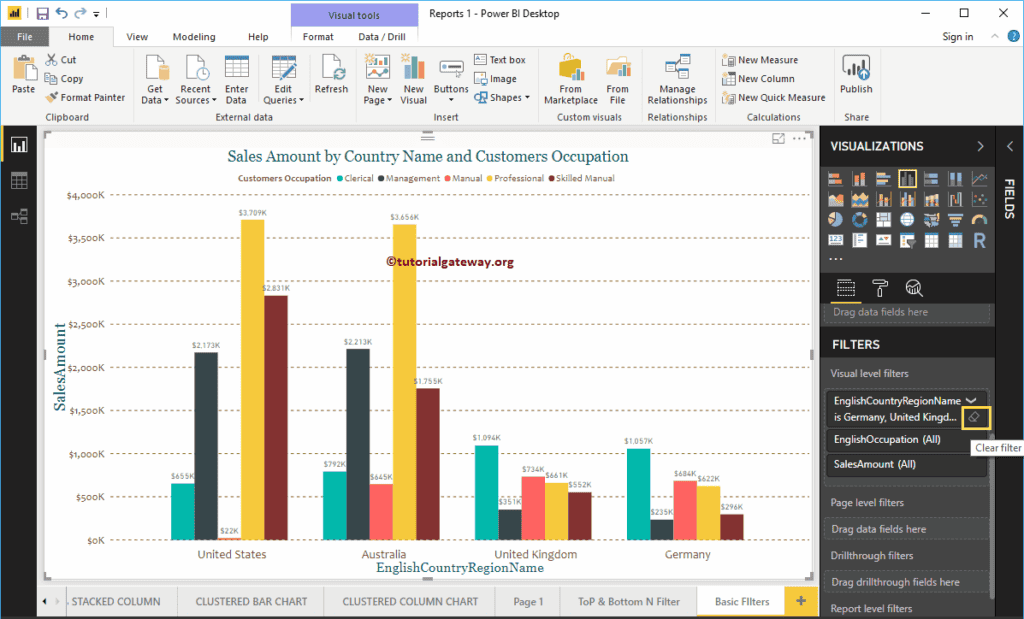
Now you can see there are no filters in this Clustered Column Chart.
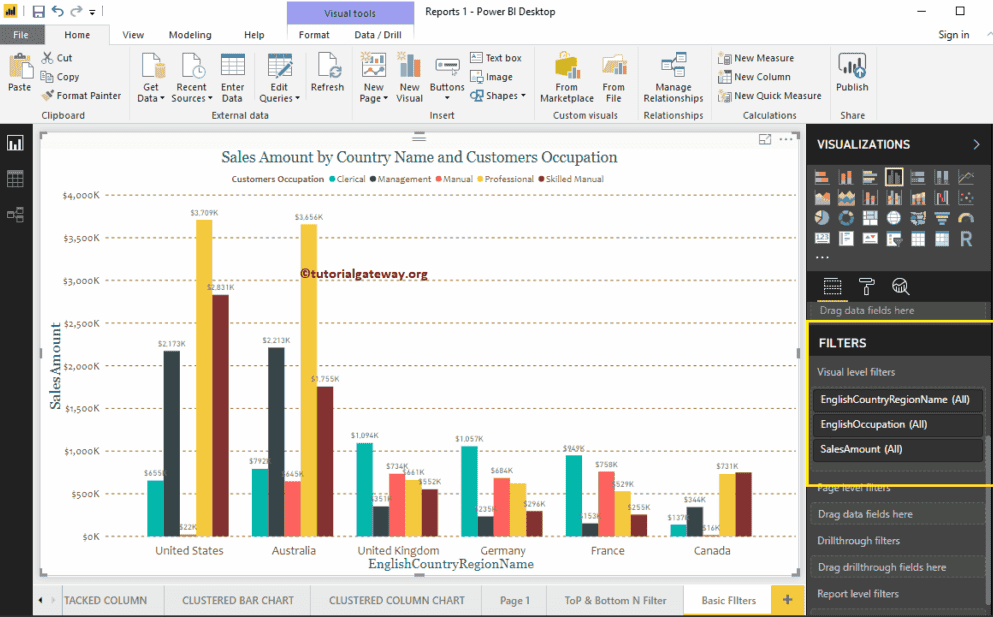
Power BI Advanced Filters
How to create Power BI advanced filters with an example?. Power BI Advanced Filters use Wildcards to restrict the report data as per the requirements. For example, we can use these Power BI advanced filters to find products that start with S, or product contains Bikes, etc.
How to use Power BI Advanced Filters
To demonstrate the Advanced Filters in Power BI, we are going to use the Clustered Column Chart that we created in our earlier post. As you can see from the Power BI screenshot below, we used the Country Name as the Axis field, English Occupation as Legend field, and Sales amount as the Value field.
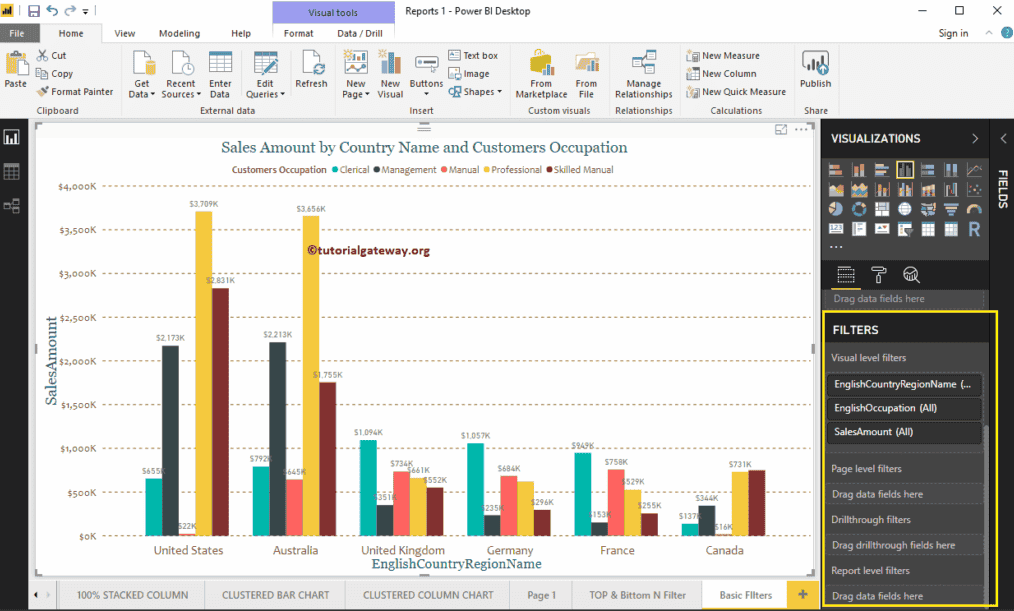
Under the Filters section, you can see the list of available filters in Power BI
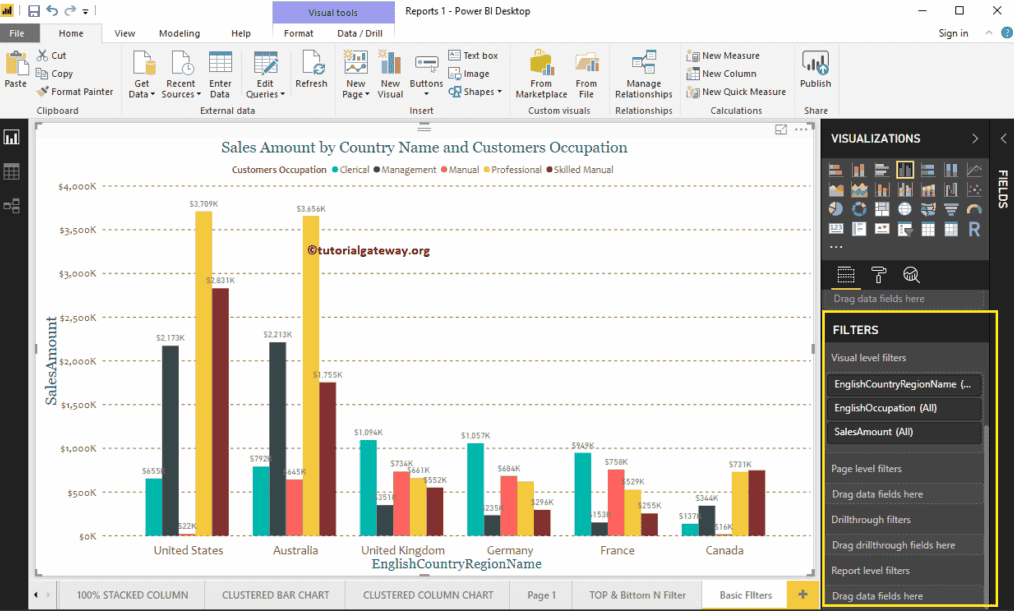
Let me expand the English Country Region Name to see the filter types. By default, the Basic Filters option selected as the Filter type
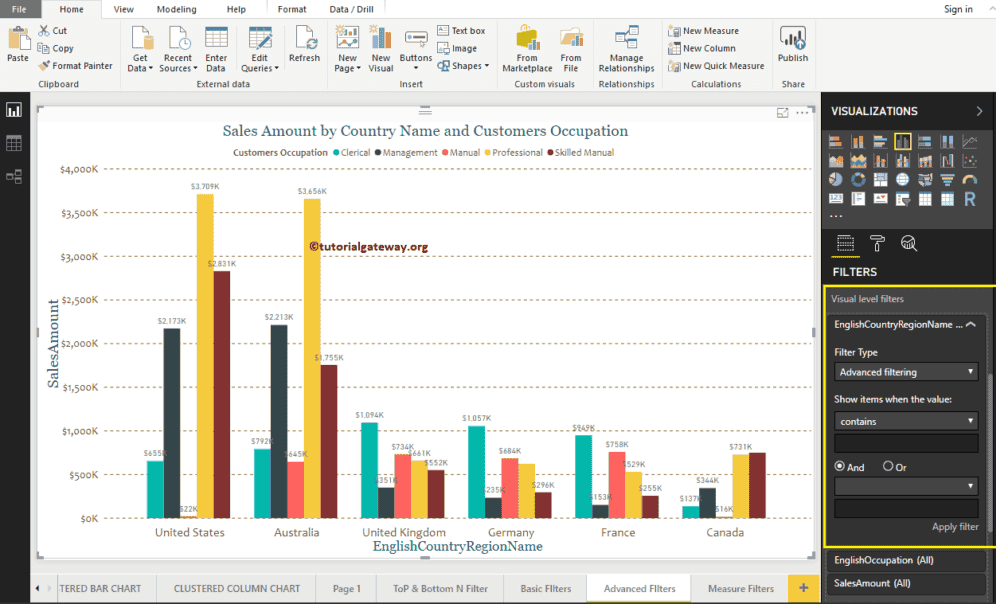
Use the drop-down to change it to Advanced filtering
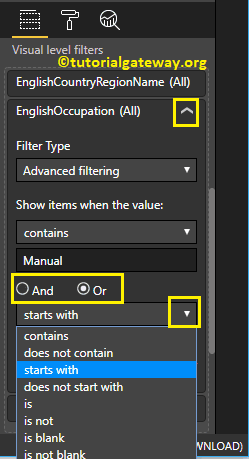
The following are the list of options that are available for Power BI Advanced filtering
- Show Items when the Value: Please select the wildcard that you want to use.
- Empty Text box: Please specify the wildcard character or expression. For example, it starts with s.
- And and Or: Same as AND and OR Operators in SQL. Use this to concatenate multiple wildcard searches.
- Empty drop down list: Please select the second wildcard that you want to use.
- Empty Text box: Please specify the character or expression for the second wildcard.
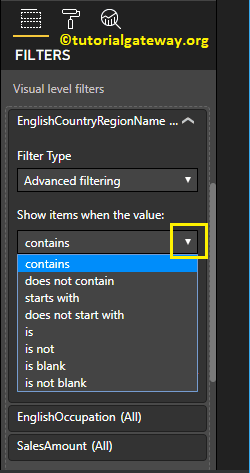
The following are the list of options available under the Show items when the value section:
- Contains: When this property is selected, it checks each record against the Match Value. And if it contains the match value at any position then, the record displayed.
- Does not Contains: It checks each record against the Match Value. And if it does not contains the match value at any position then, the record displayed.
- Starts With: If the record starts with the match value, then the record displayed.
- Does not start with: If the record does not start with the match value, then the record displayed.
- is: If the record matches exactly with the match value, then the record displayed.
- is not: If the record is not exactly equal to the match value, then the record displayed.
- is blank: This option displays all the records with the blank values.
- is not blank: It displays all the records that contain no blank values.
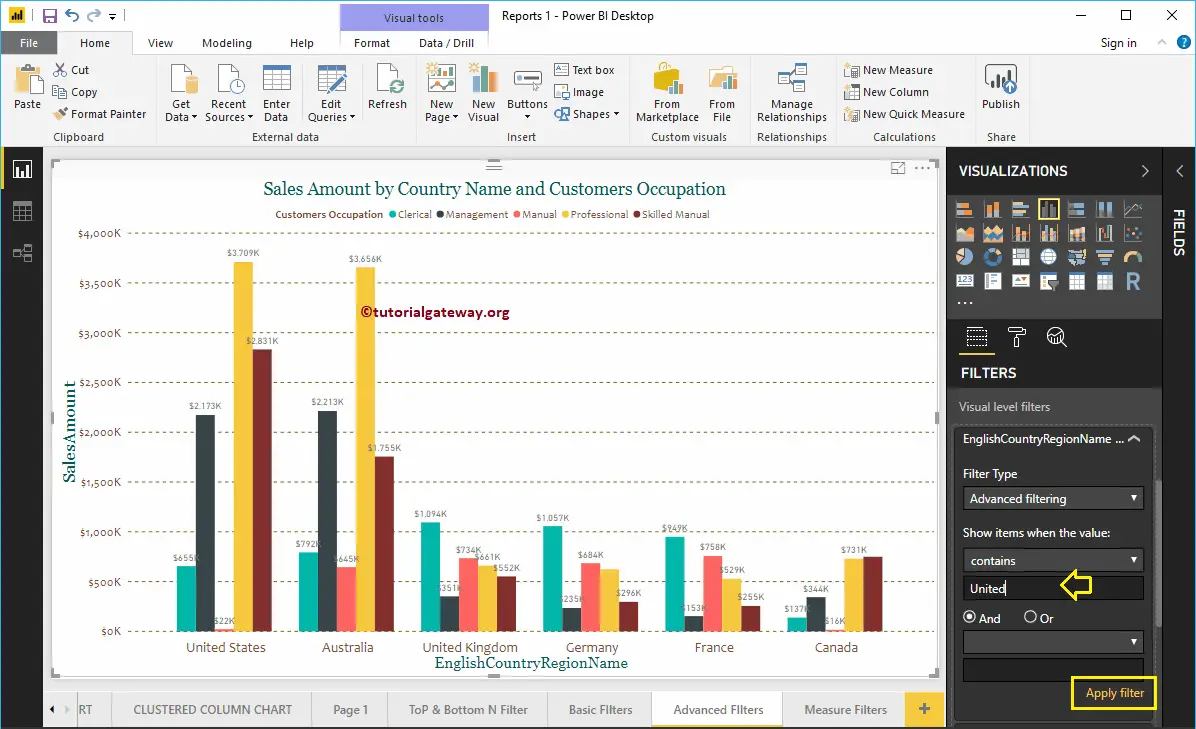
For the Power BI Advanced Filters demonstration purpose, we selected the Contains as the wildcard, and United as the keyword.
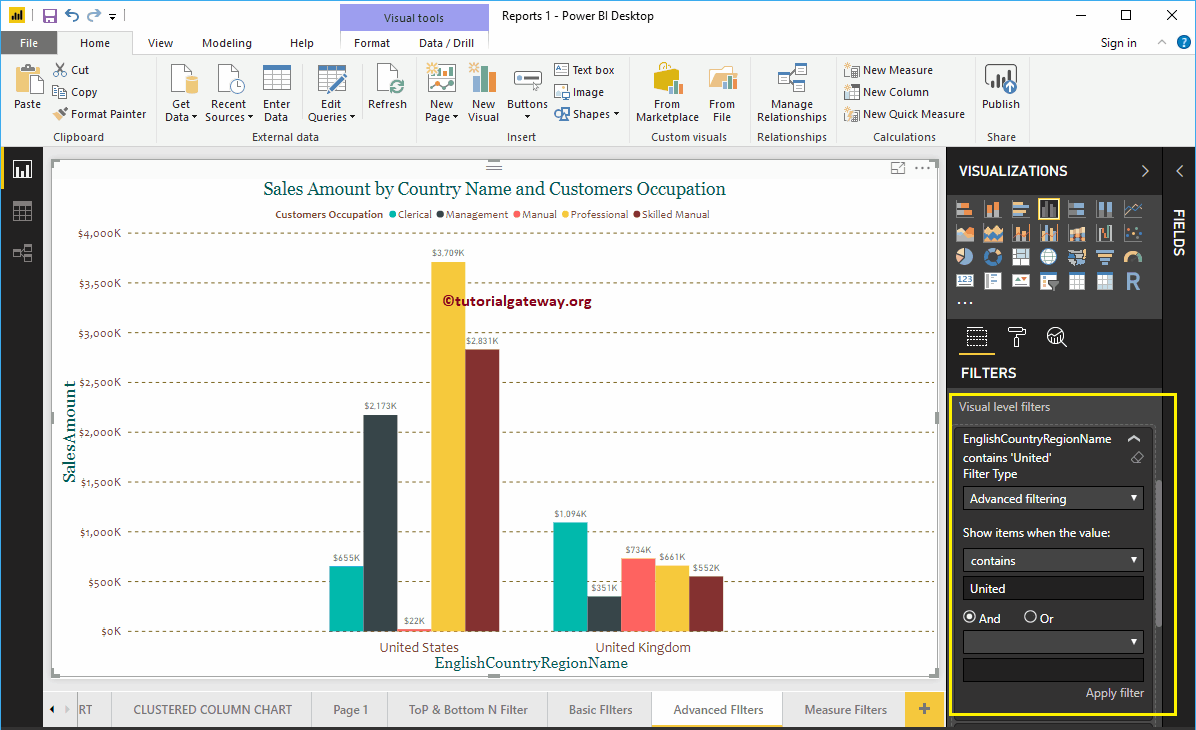
From the screenshot below, you can observe that the report is displaying the countries that contain the united keyword.
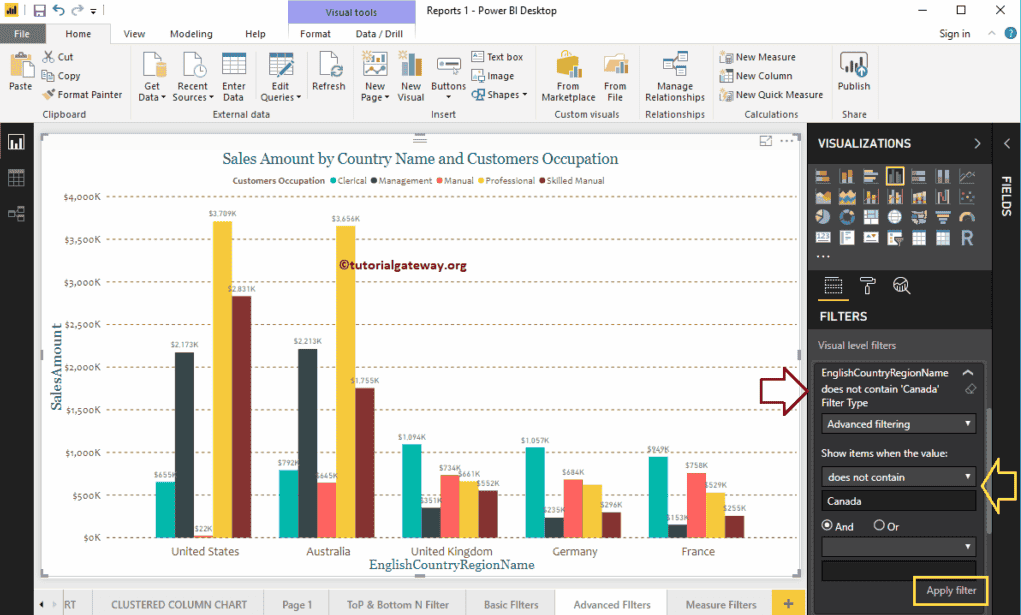
This time we used the does not contain as the wildcard, and Canada as the keyword. From the screenshot below, you can that the report is displaying all the countries except Canada.
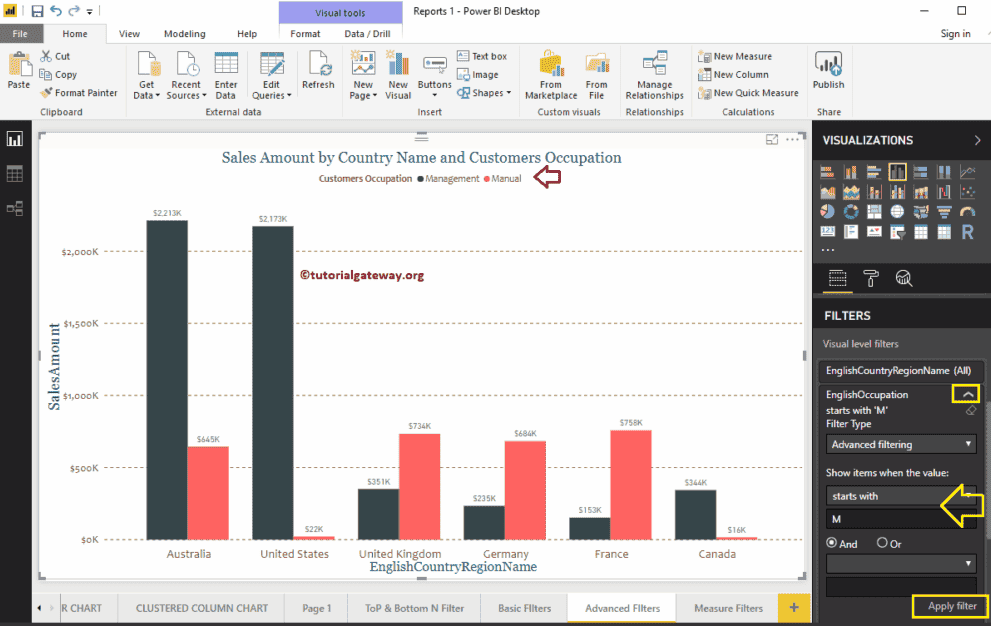
Let me apply Power BI Advanced Filters on the English Occupation column.
We used the starts with as the wildcard, and M as the keyword. From the screenshot below, you can that the report is displaying the occupations that start with M (Management and Manual).
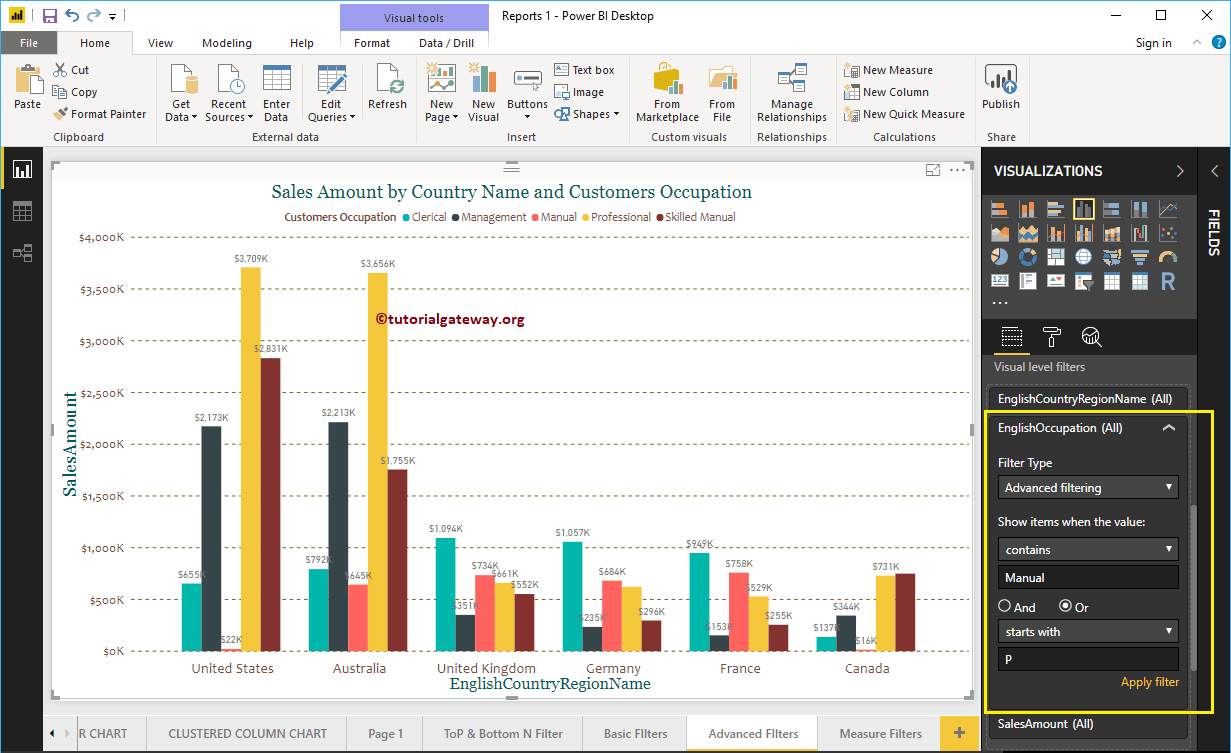
Let me use the OR operator and Starts with as the Keyword.
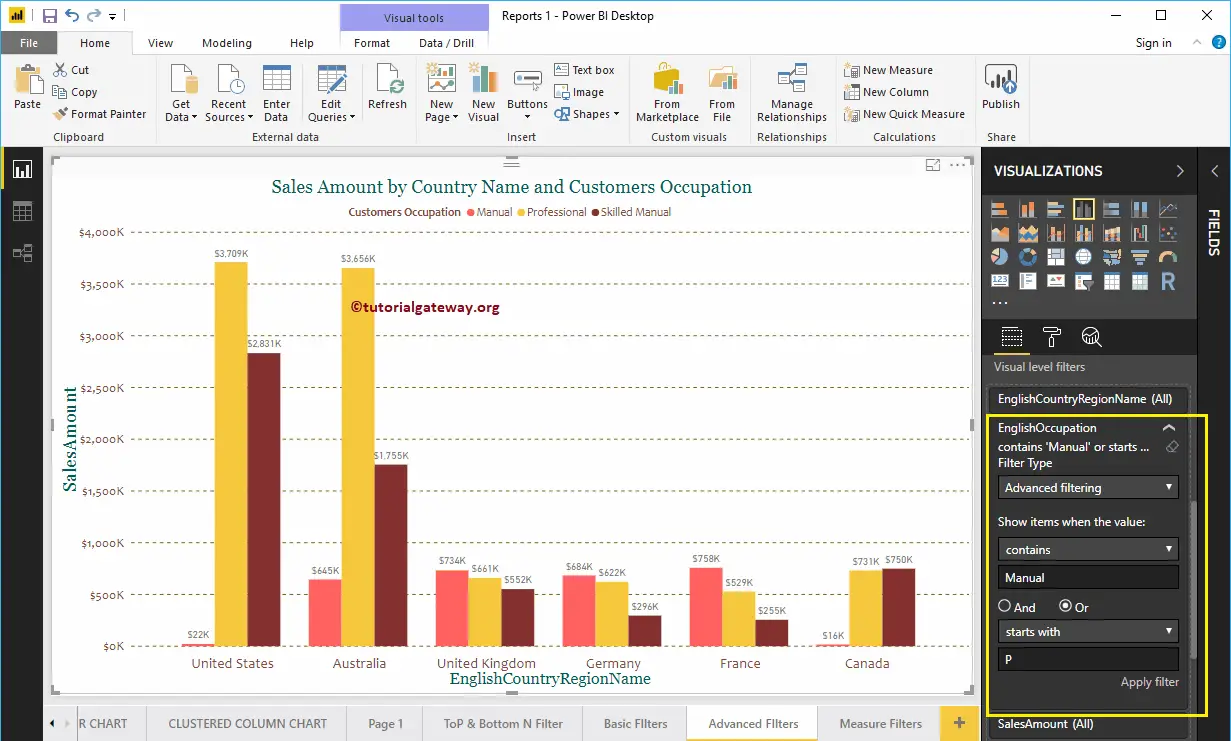
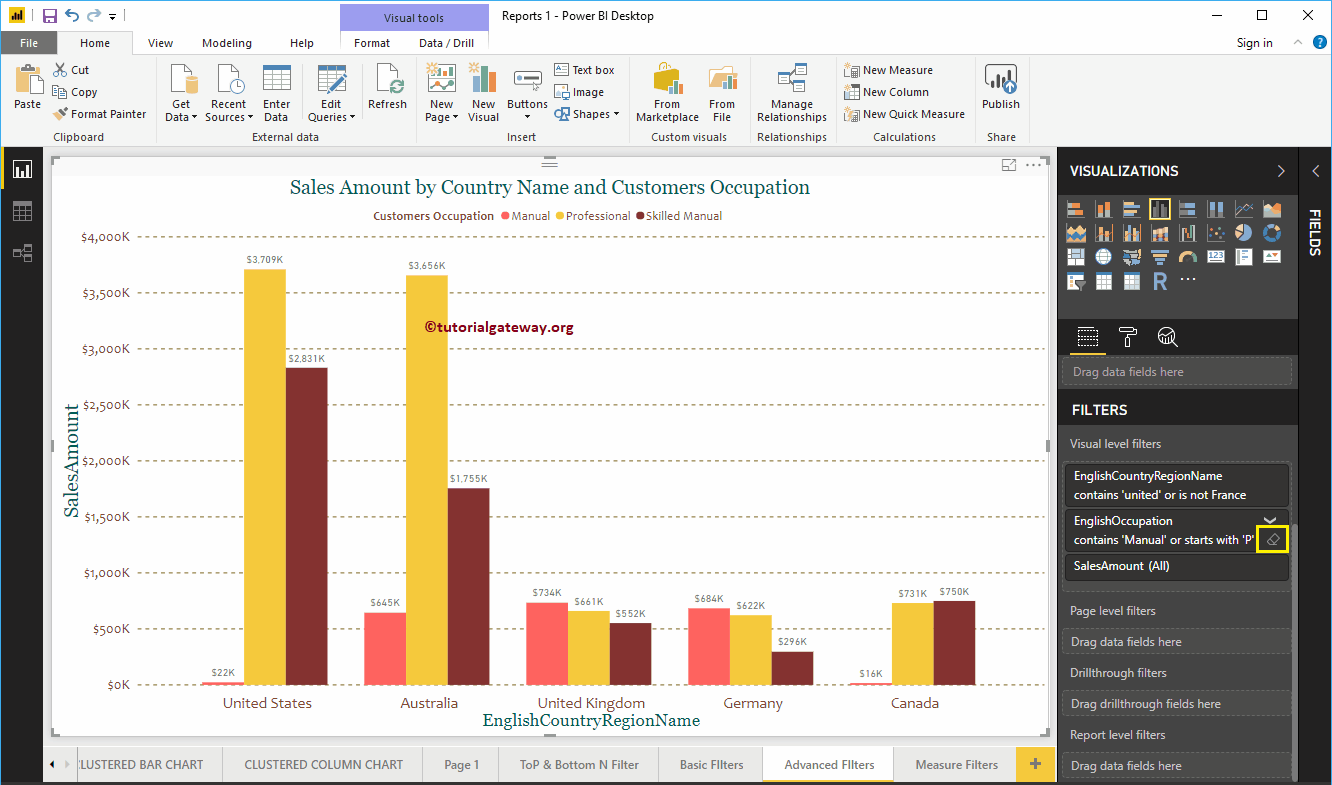
Here, we are using two wildcards: the first wildcard checks whether the Occupation contains a manual keyword or not. Or, the Second filter checks whether the occupation starts with P or not.
The below screenshot is showing the Occupation that contains a manual keyword, and the Occupation that starts with P.
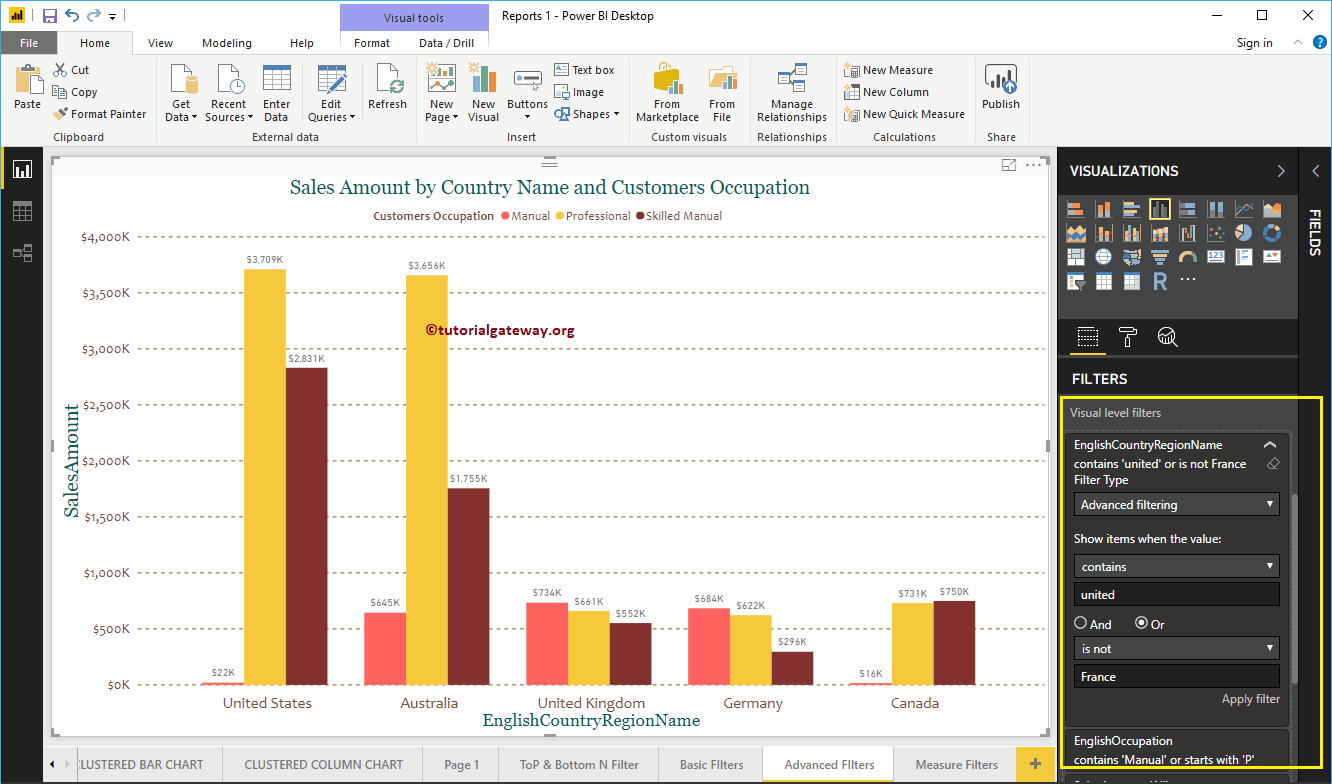
This time we are applying multiple filters on Country column. First, it checks whether the Country contains a united keyword or not. Or, the Second filter checks whether the country is not France.
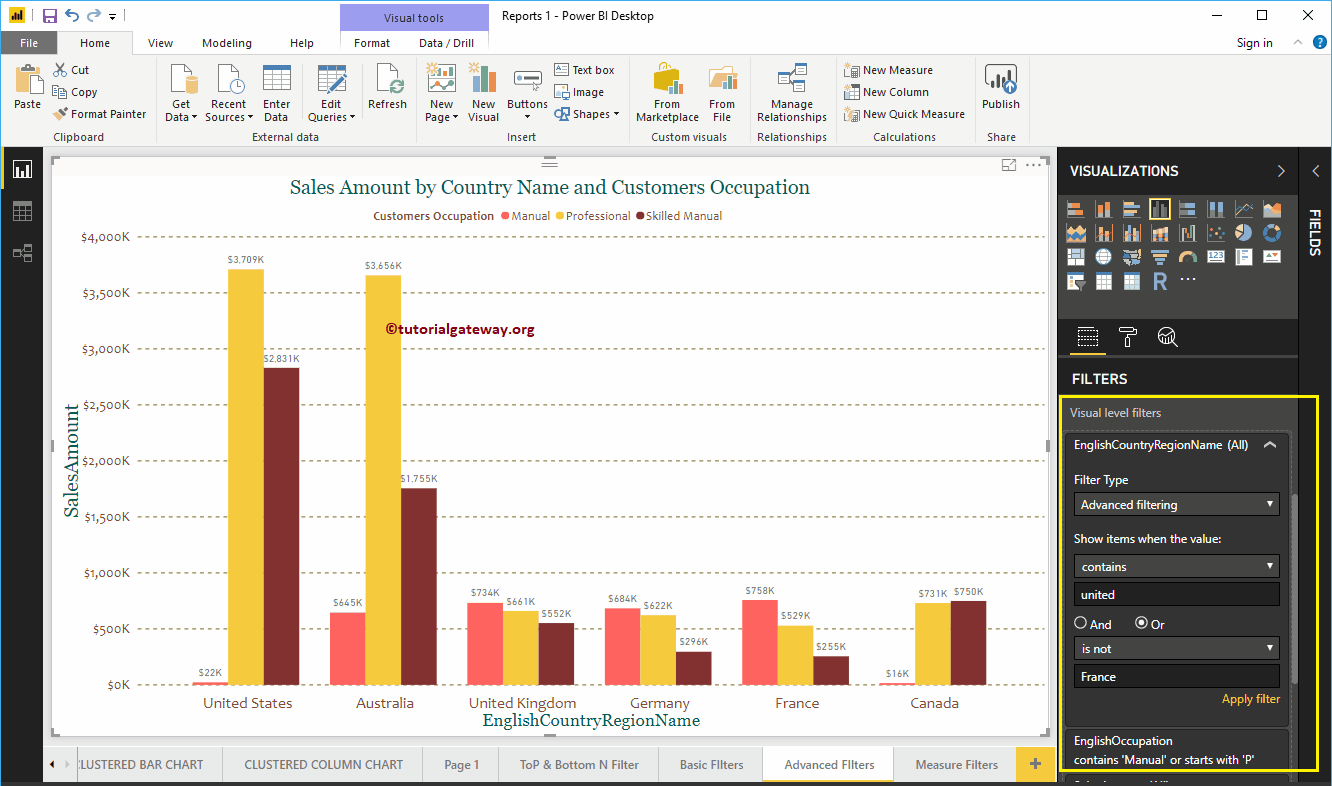
The below report is showing the Countries that contains United keyword, and the country that is not France.
Use that tiny clear filter button to remove the Power BI Advanced Filters.
Power BI Top 10 Filters
Power BI Top N Filters are useful to display the top performing records, and Bottom N filters are helpful to display the least performing records. For example, we can display top or bottom 10 products by orders or sales. Let me show you how to create Power BI Top 10 Filters and Bottom filters with examples.
How to use Power BI Top 10 Filters
To demonstrate the Top N Filters in Power BI, we are going to use the Bar Chart that we created in our earlier post. As you can see from the screenshot Power BI below, we used the State Province Name as the Axis field, Sales amount as the Value field, and Order Quantity as Color saturation.
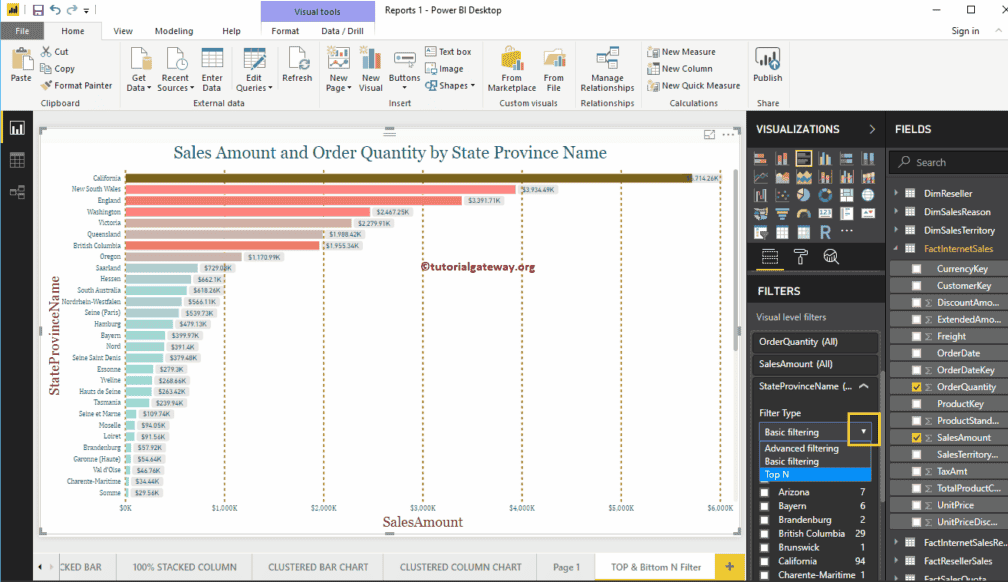
Under the Filters section, you can see the list of filters that are available in Power BI
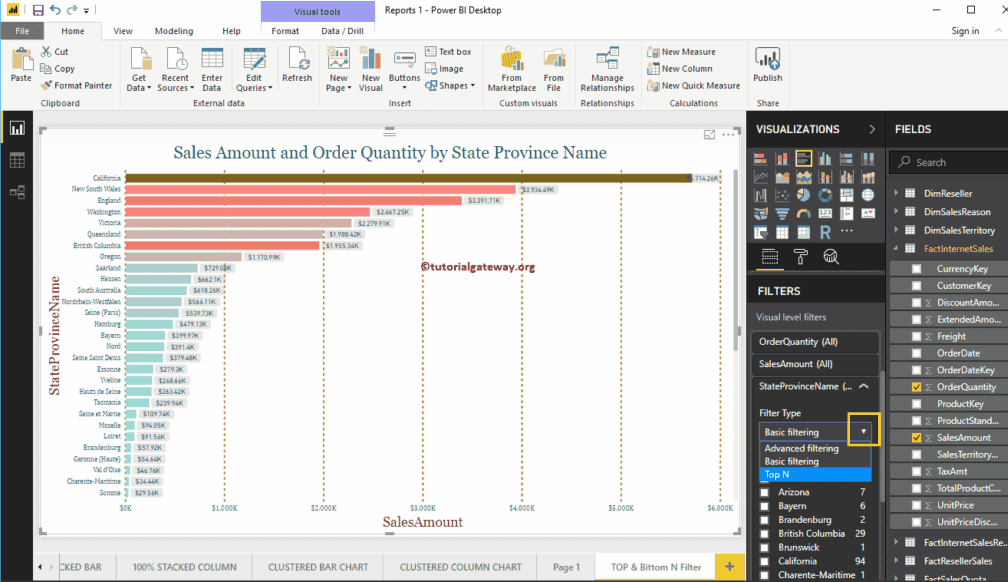
Let me expand the State Province Name (in Short State) to see the filter types. By default, the Basic Filters option selected as the Filter type.
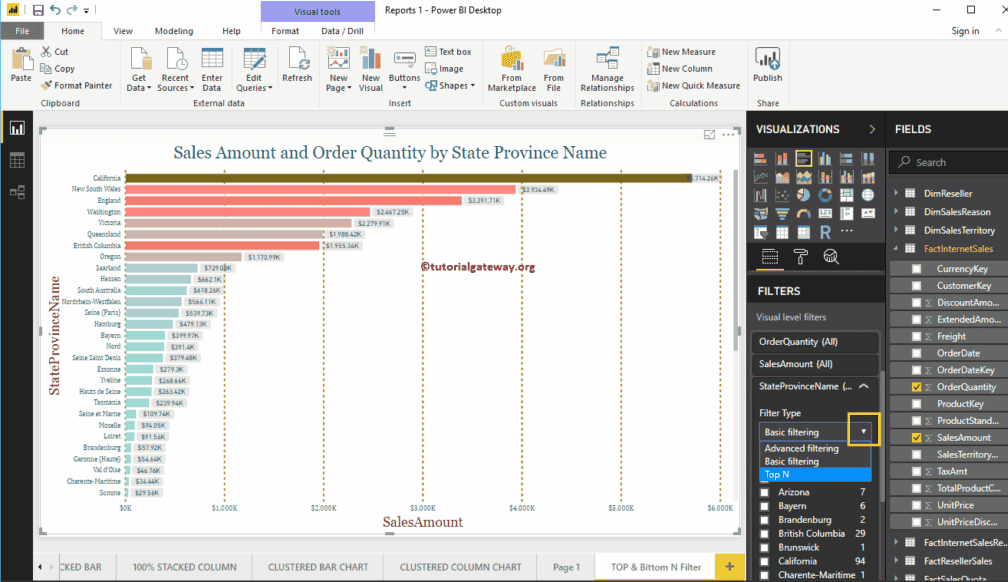
Power BI Top 10 Filters
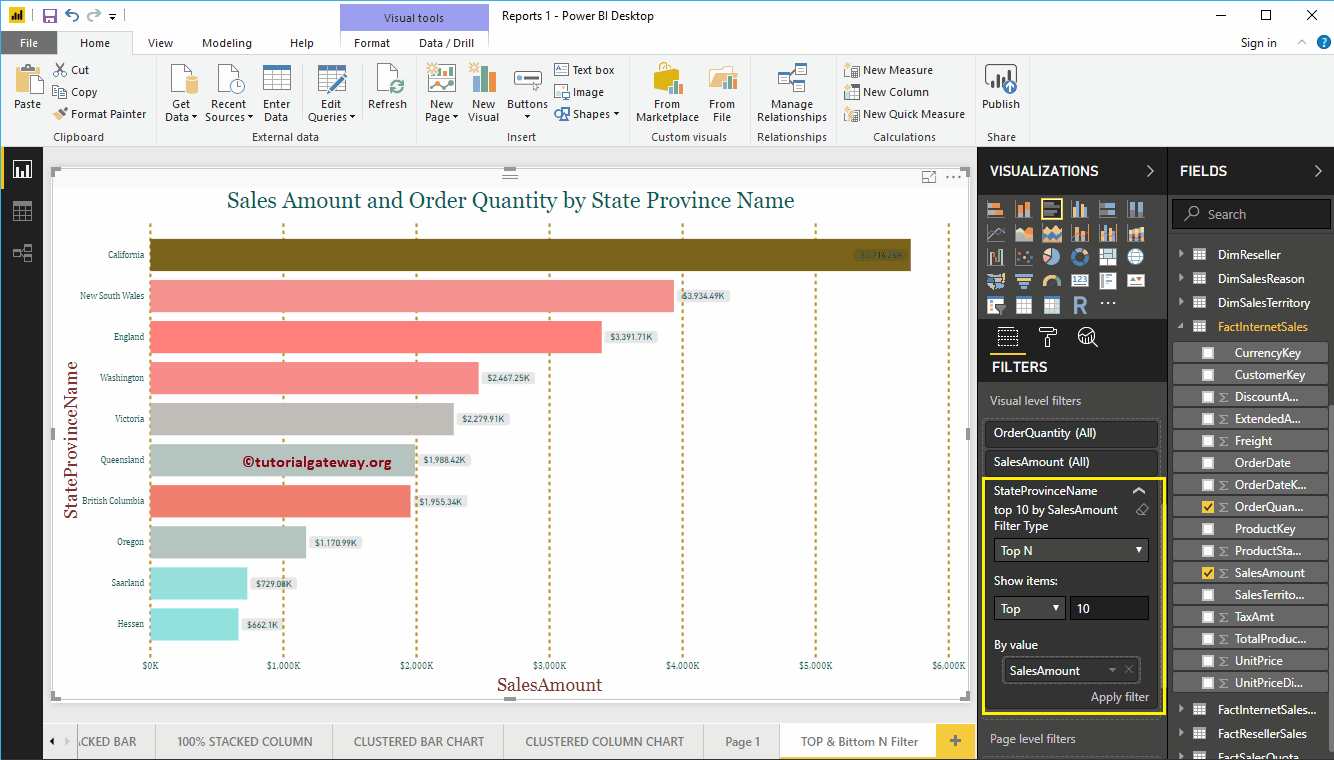
In order to enable Power BI top 10 filters, use the drop-down to change it to Top N filters
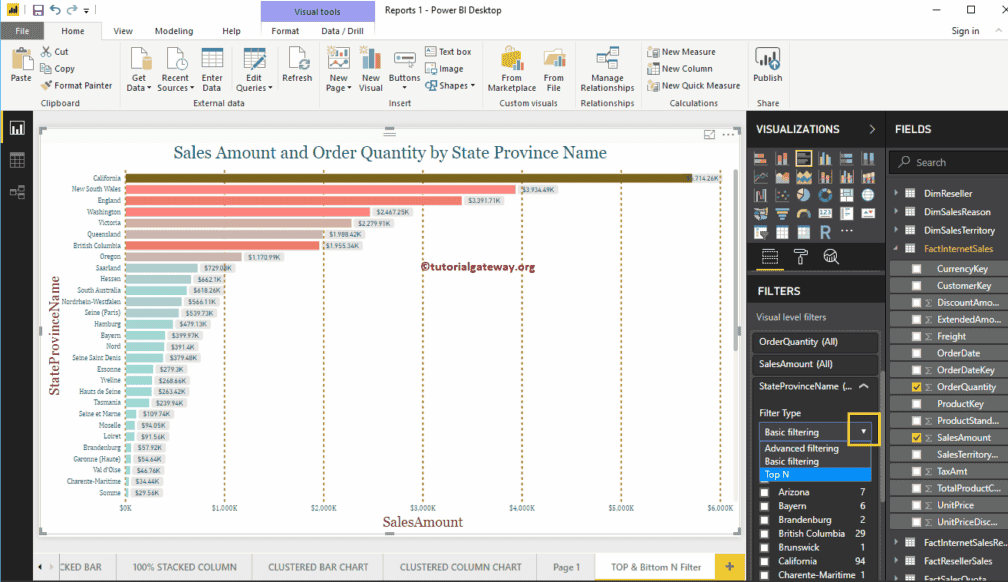
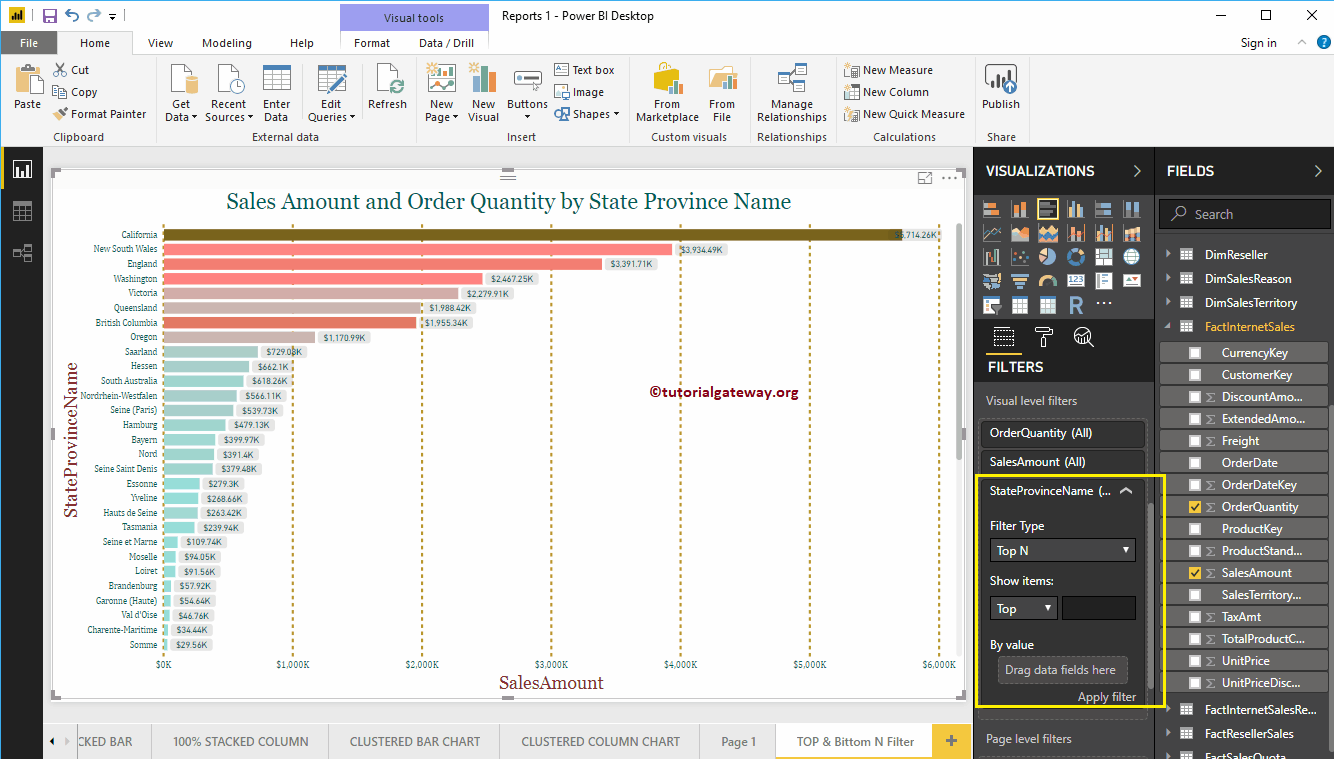
The following are the list of options that are available for Power BI TOP 10 filters
- Show Items: Top filter selected by default. However, you can change this to Bottom by clicking the down arrow.
- Empty Text box: Please specify any integer value — for example, 10 means, top 10 records.
- By Value: You have to drag and drop the required Measure value present in the Fields. Top N filter use this Measure to find Top 10 and Bottom 10 records.
Let me add Sales Amount to By Value section, and 10 to the text box
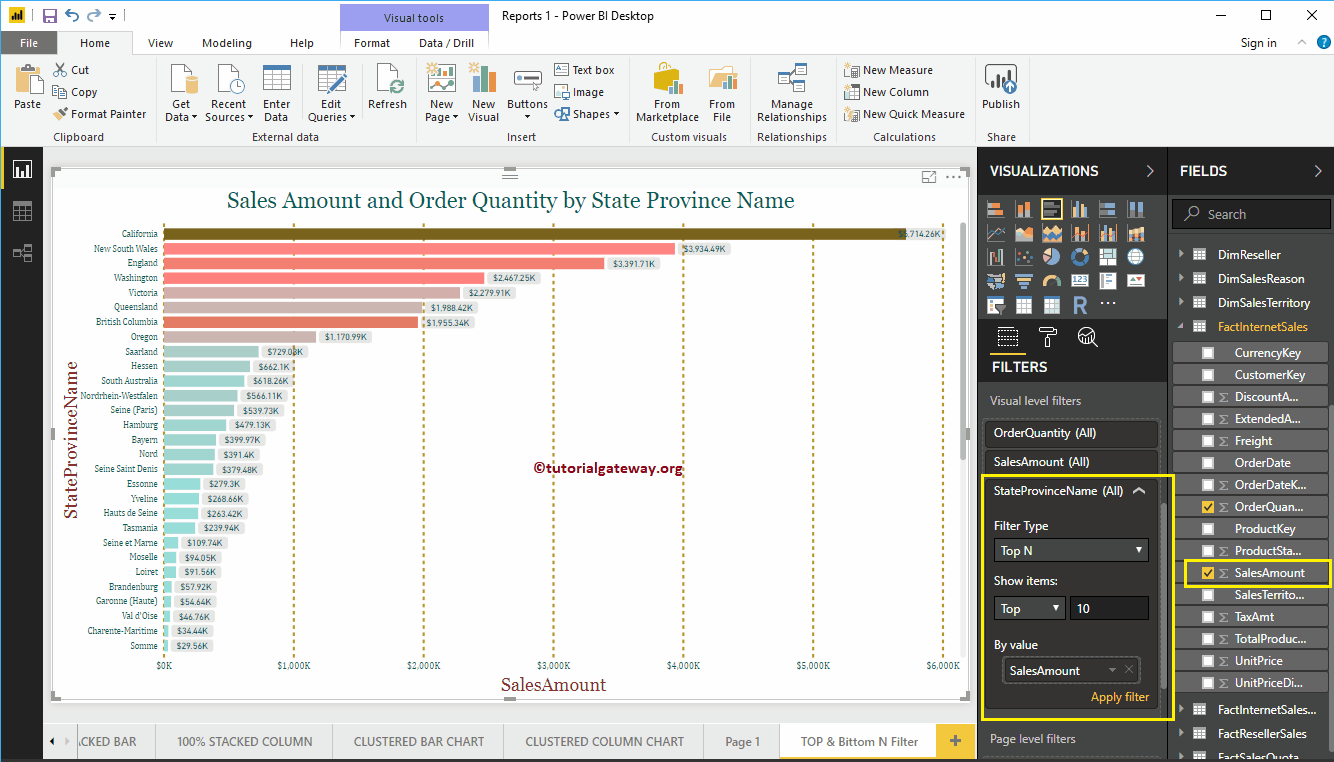
The below Power BI report displaying the Top 10 states according to their Sales Amount. Or we can say, Top ten states based on their sales amount.
Use the Dropdown arrow to minimize the filter
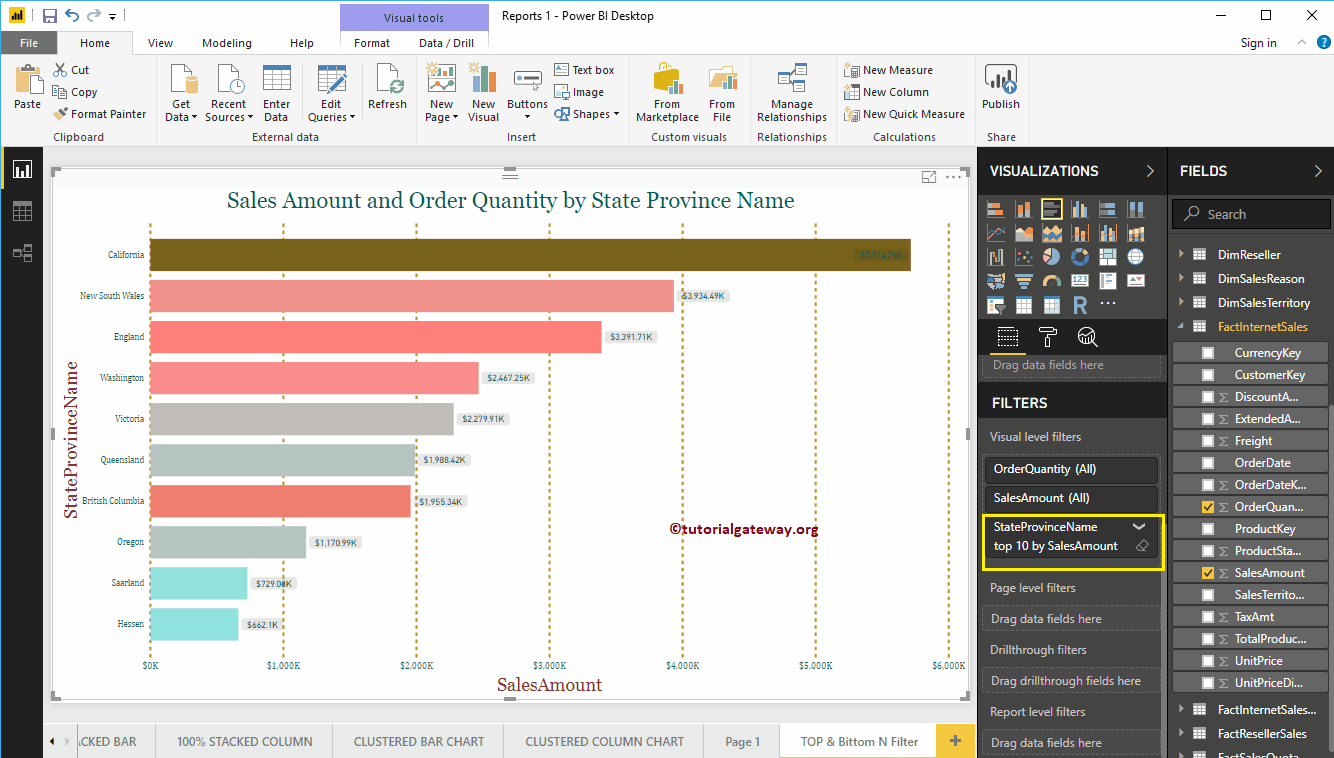
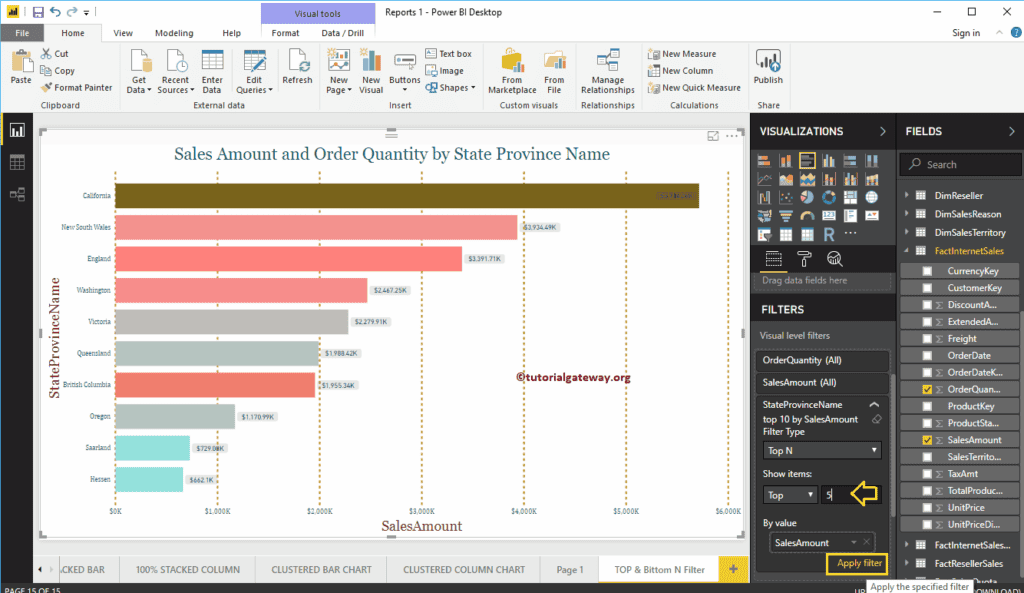
Let me change the value to 5. It means, Power BI Top 5 filter
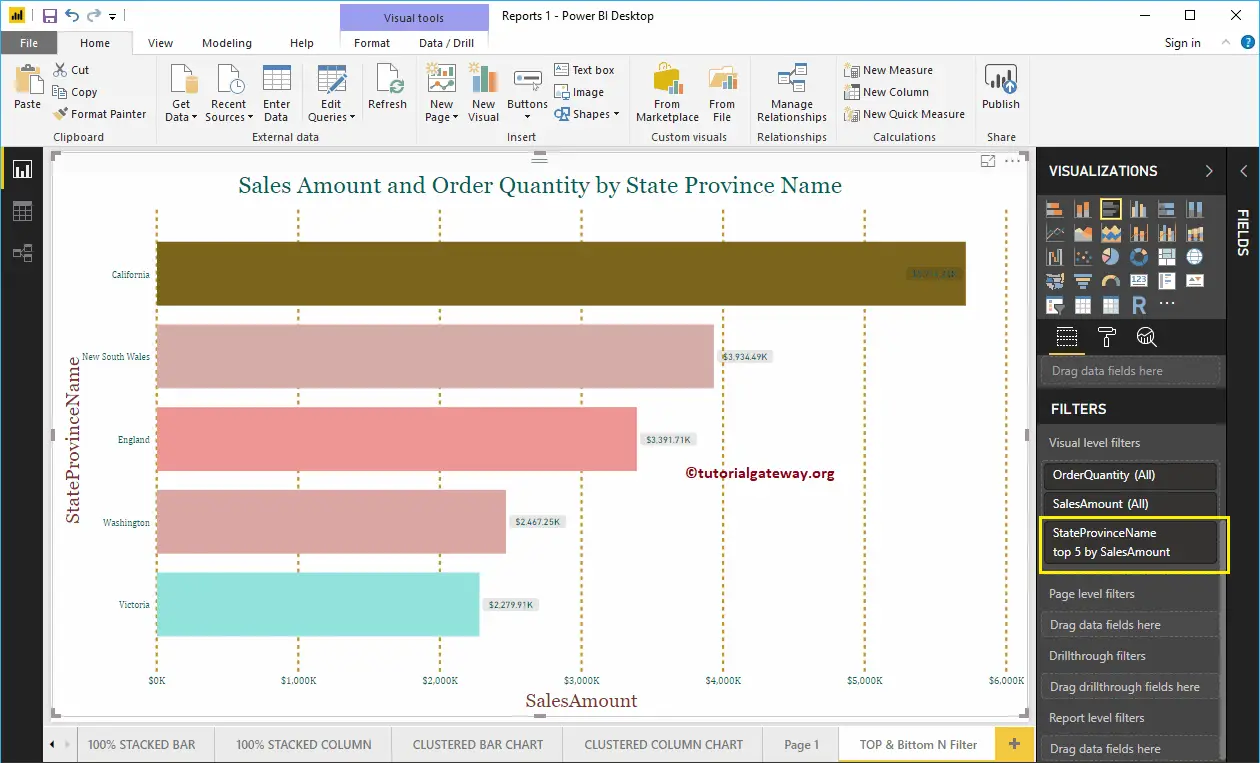
As you can see that the Power BI filter has selected Top 5 State province names by sales amount
Power BI Bottom 10 Filters
In order to apply Power BI bottom 10 filters, let me change the Show Items option from Top to Bottom, and leave the integer value to 5
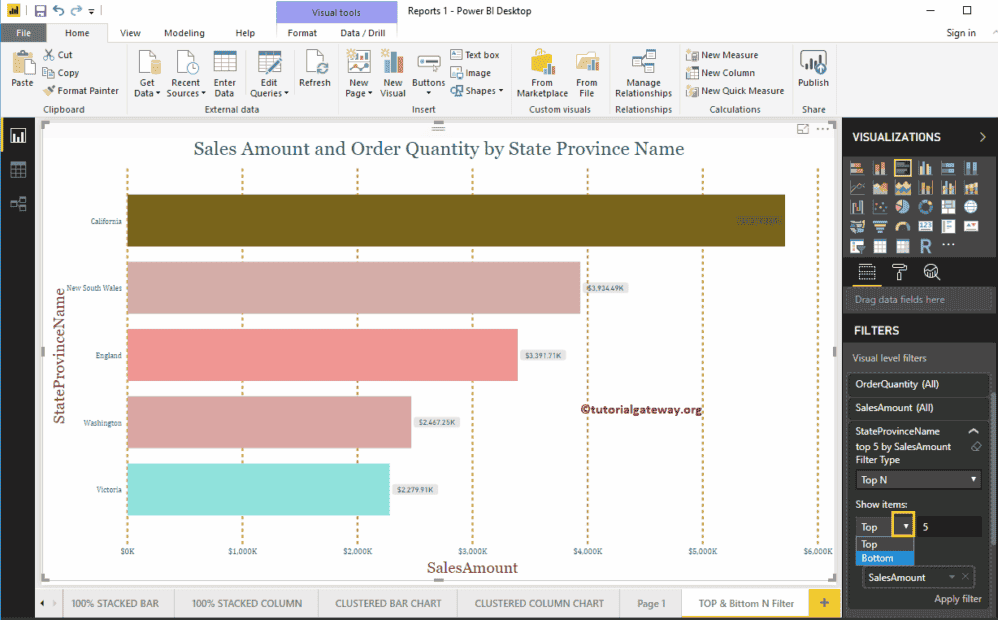
Click the Apply Filter button
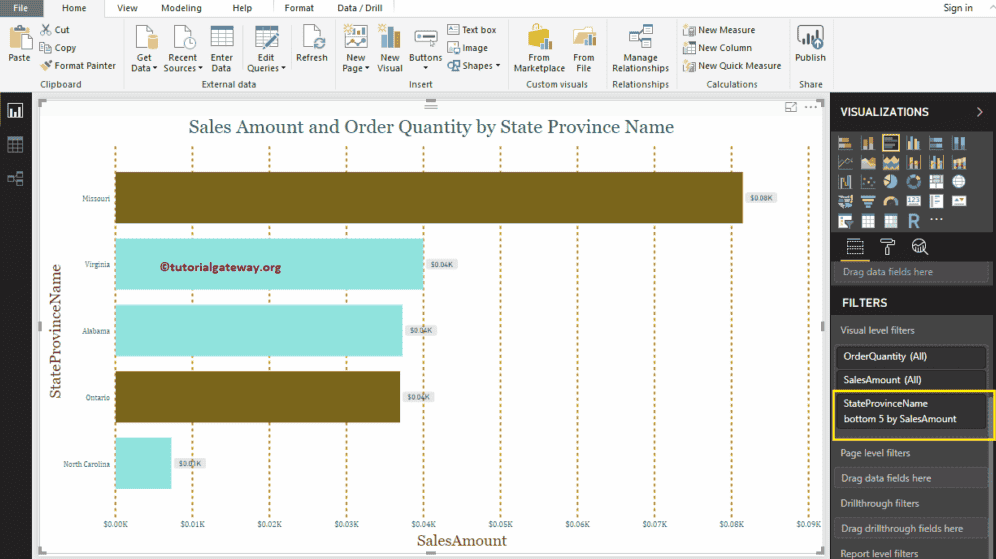
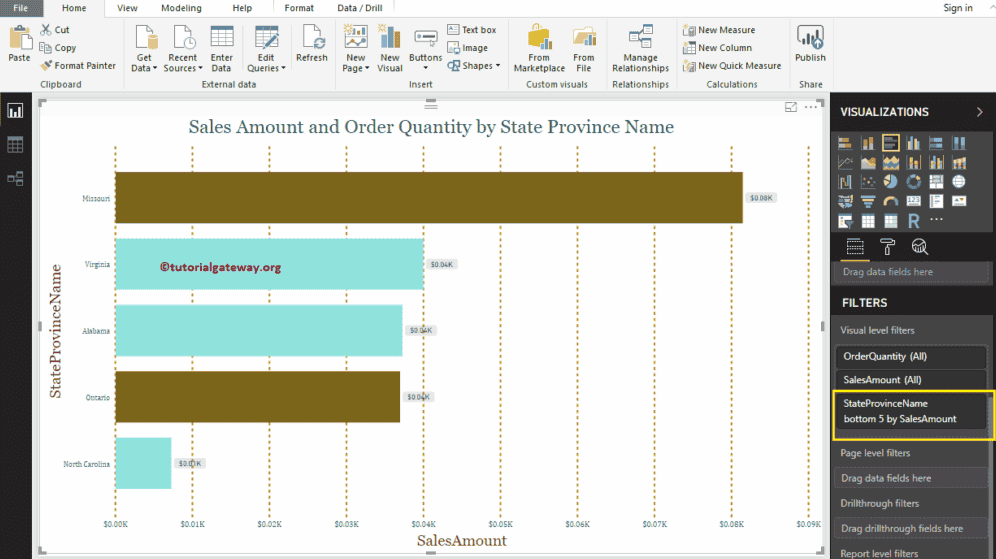
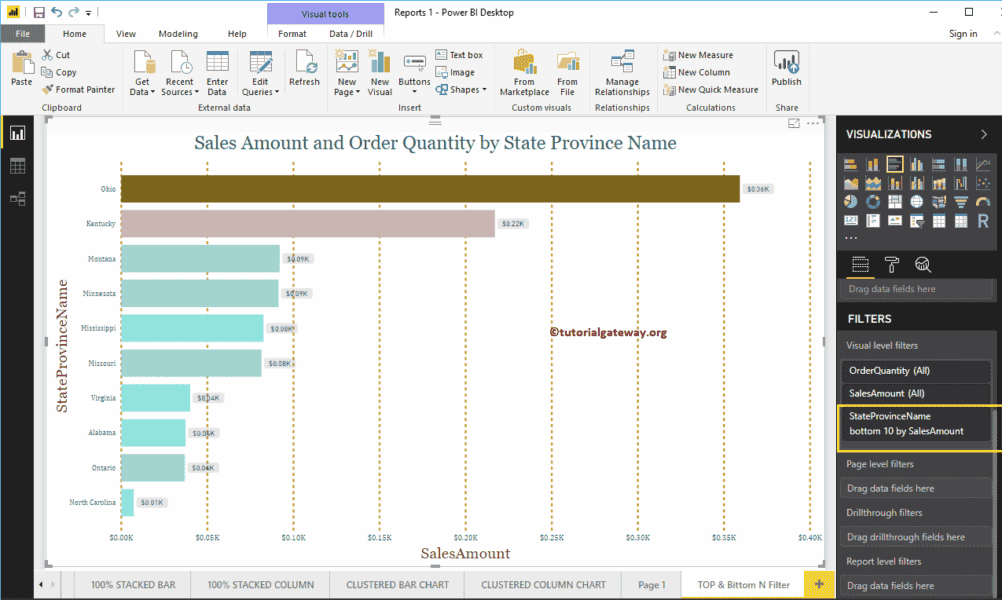
The following Power BI report is displaying the bottom 5 states as per their Sales Amount. Or we can say, Least performing states.
Let me change the integer value to 10
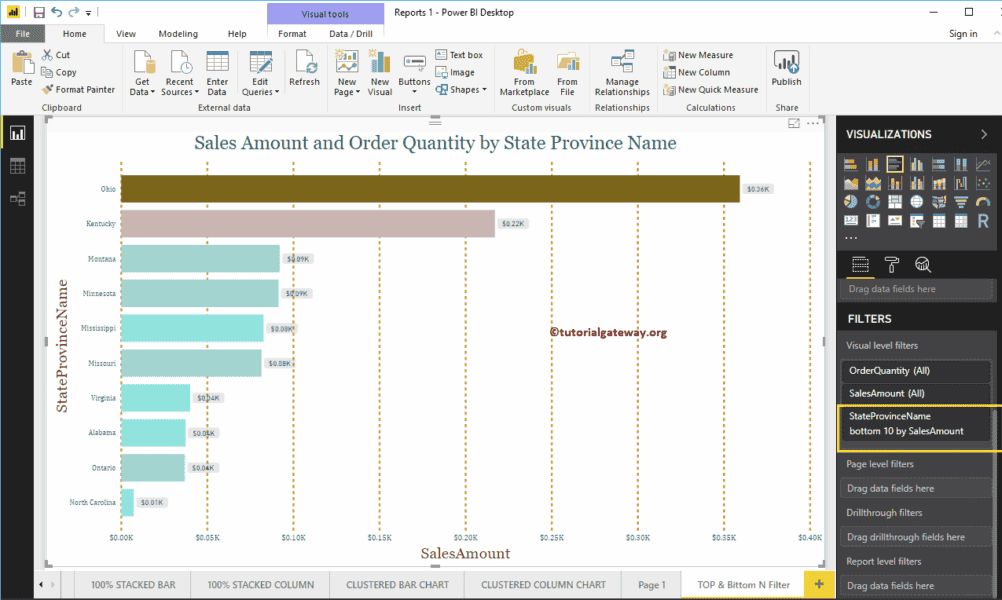
The below report is displaying the Power BI bottom 10 states as per their Sales Amount.
Power BI Page Level Filters
How to create Page Level Filters in Power BI with an example?. The Power BI Page level Filters are useful to filter the charts (or visuals) present on the page. For example, if your page contains four charts, then you can use this page level filter to filters those four reports at a time.
How to create Power BI Page Level Filters
To demonstrate the Page Level Filters in Power BI, we are going to use the Column Chart, Pie Chart, and Bar Charts that we created in our earlier Power BI post.
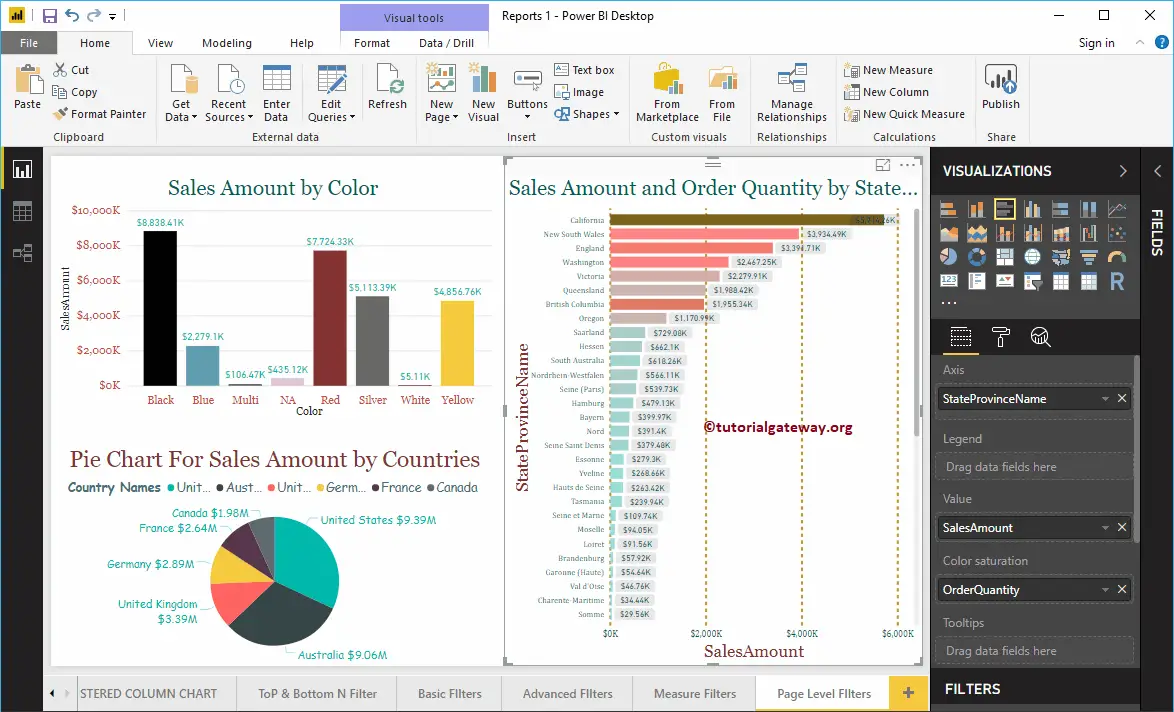
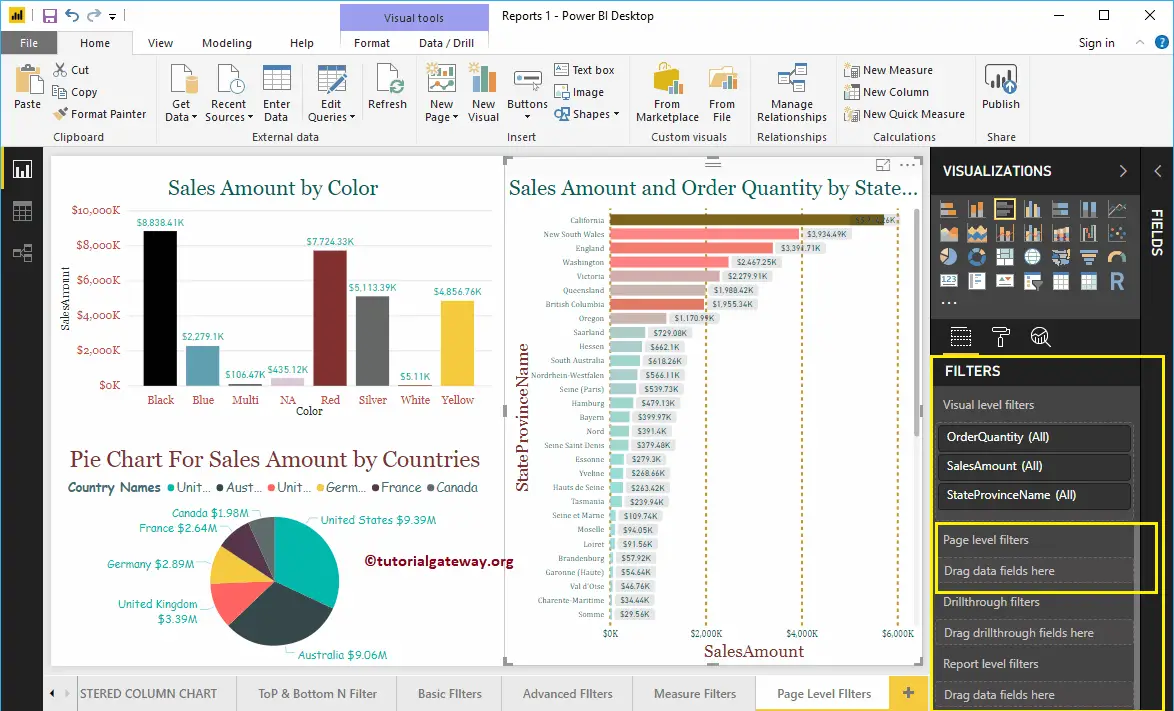
Under the Filters section, you can see the list of available page level filters in Power BI. You have to use the Page Level Filters section to create a filter at the page level.
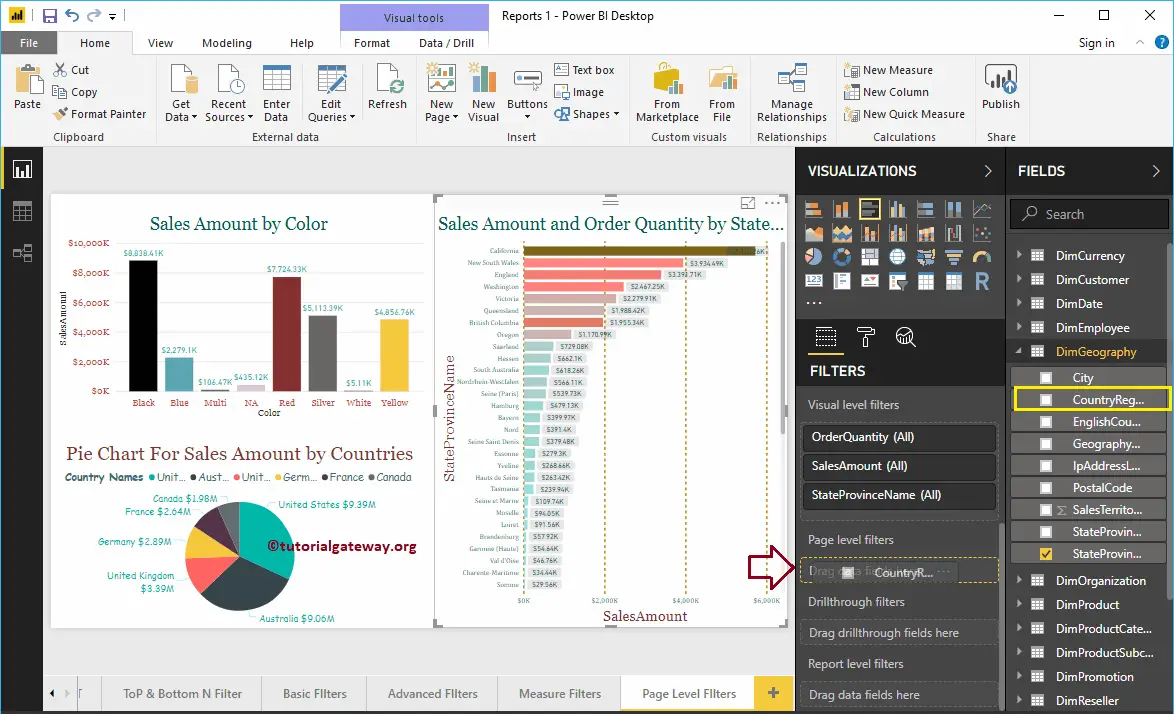
Let me drag and drop the English Country Region Name from the fields section to the Page level Filters.
Expand the English Country Region Name to see the filter types. By default, the Basic Filters option selected as the Filter type.
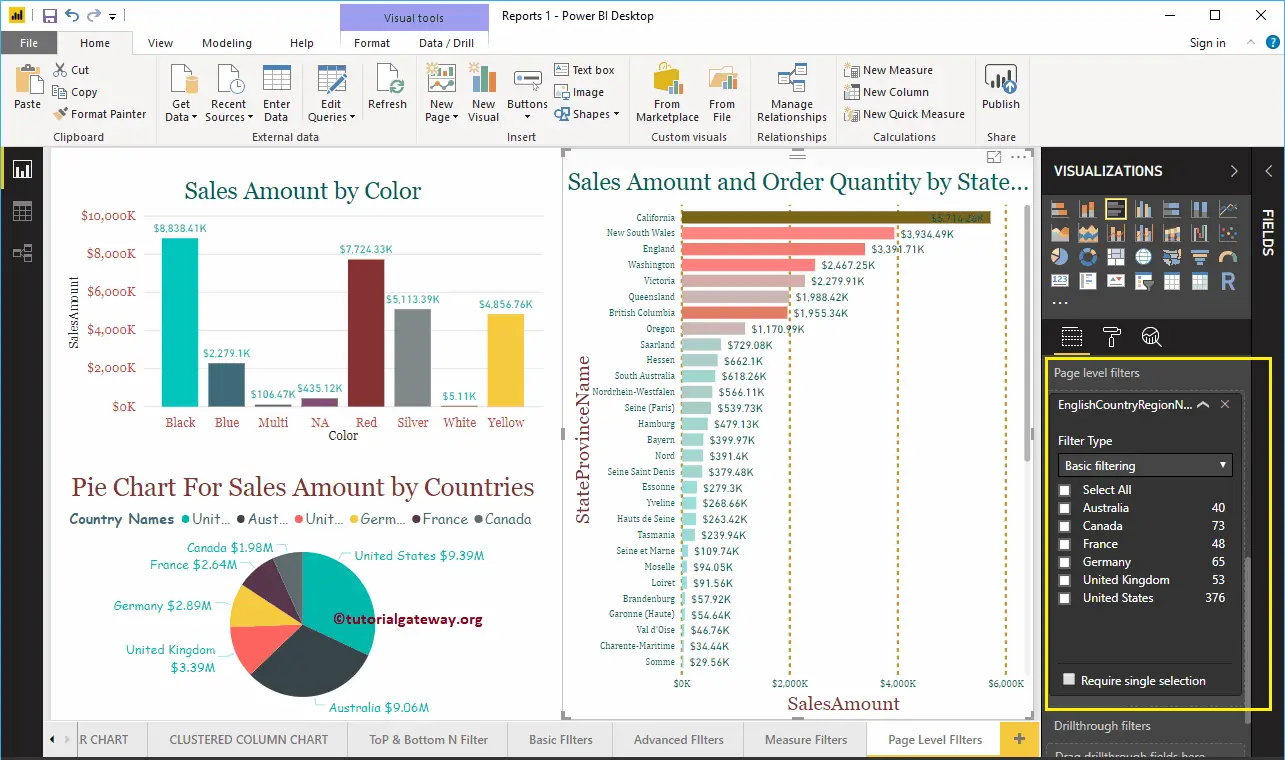
For the demo purpose, let me select Australia, Germany, the United Kingdom, and the United States. From the screenshot below, you can see that the Column chart is displaying Sales for the selected countries. The pie chart is displaying the selected countries. And, Bar chart is displaying the States that belong to these countries.
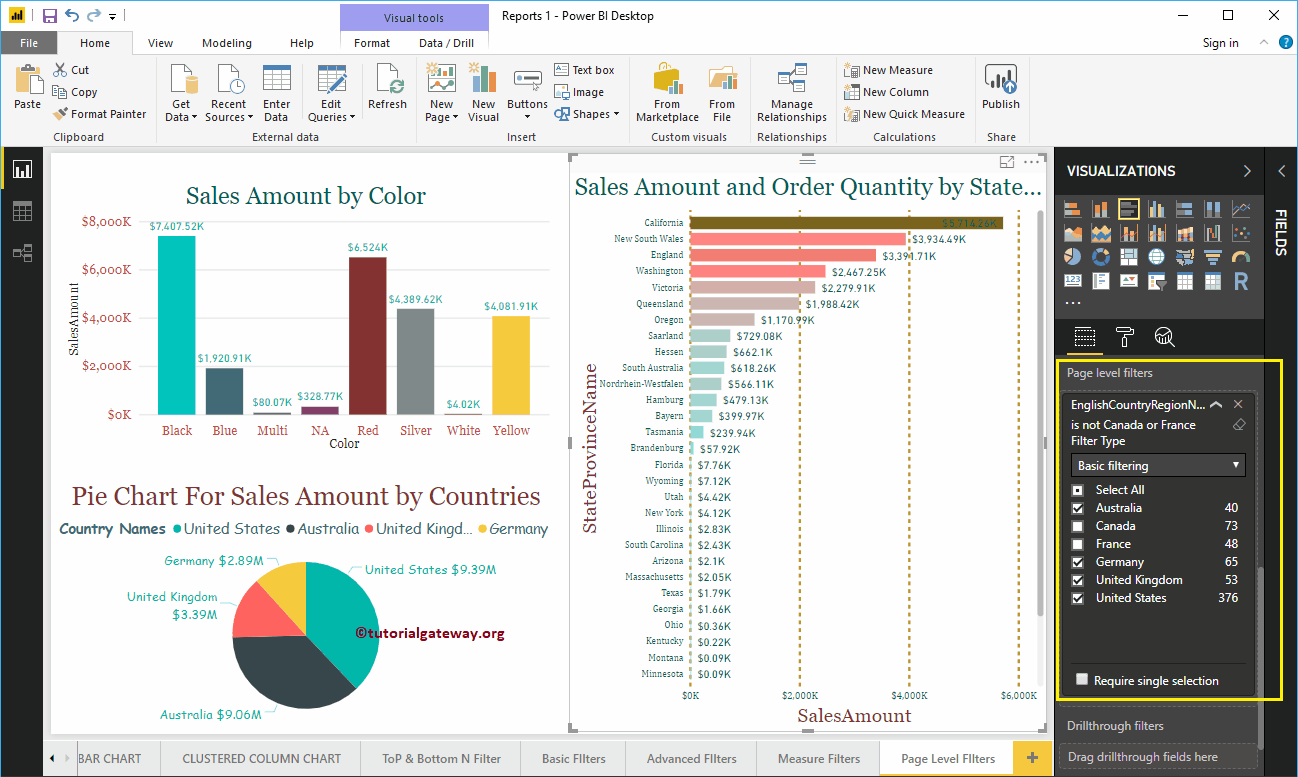
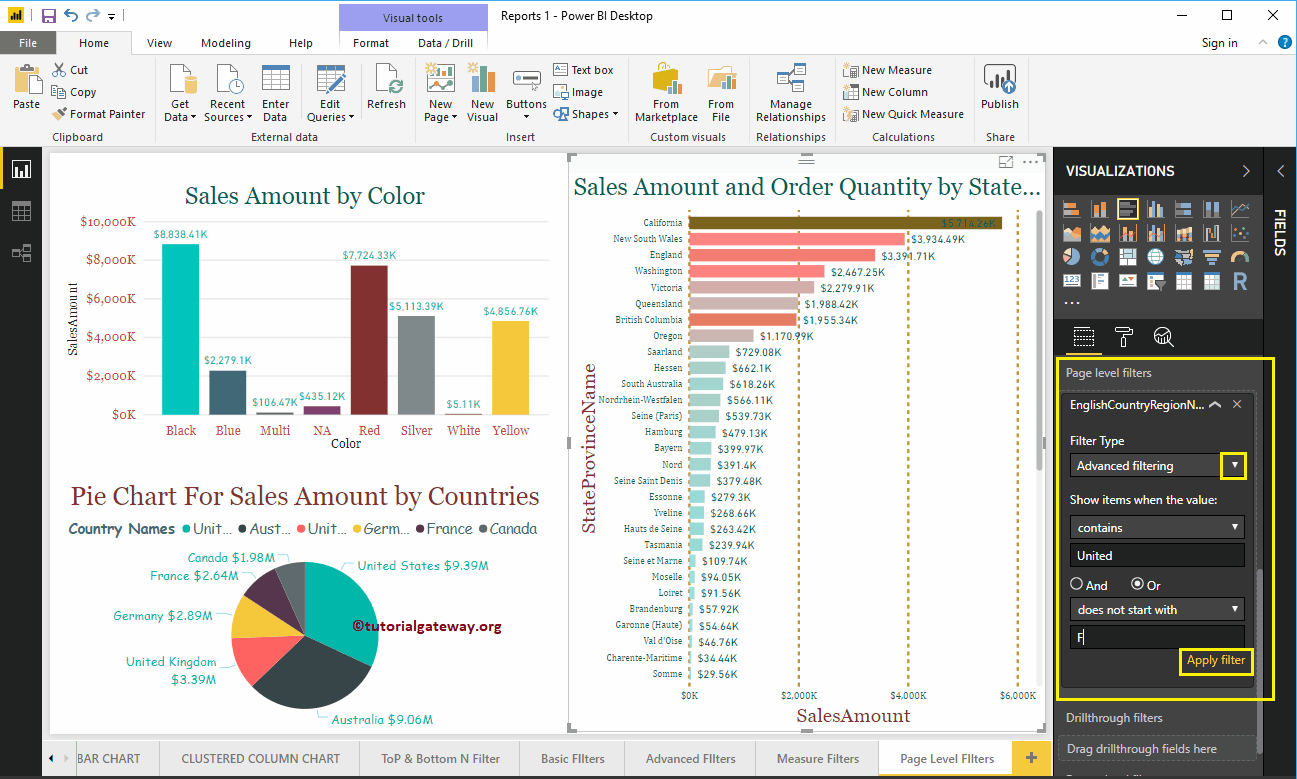
Use the drop-down to change the filtering type to Advanced filtering.
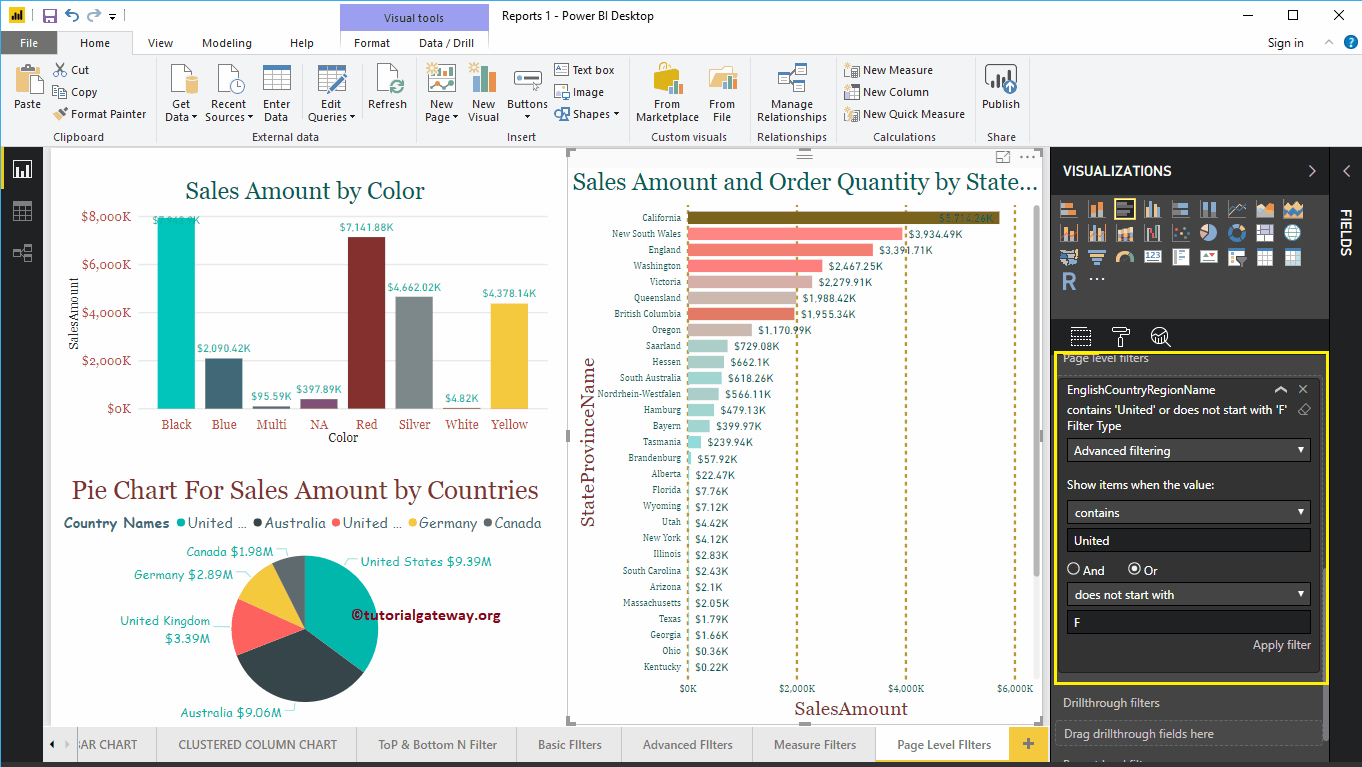
Here, we are applying multiple filters on the Country column. The first filter checks whether the Country contains a united keyword or not. Or, the Second condition checks the countries that do not start with F.
The below page is showing the Countries that contain the United keyword, and the countries do not start with F.
Let me remove the existing page level filters in Power BI, and drag and drop the Product Color from fields section to the Page level Filters.
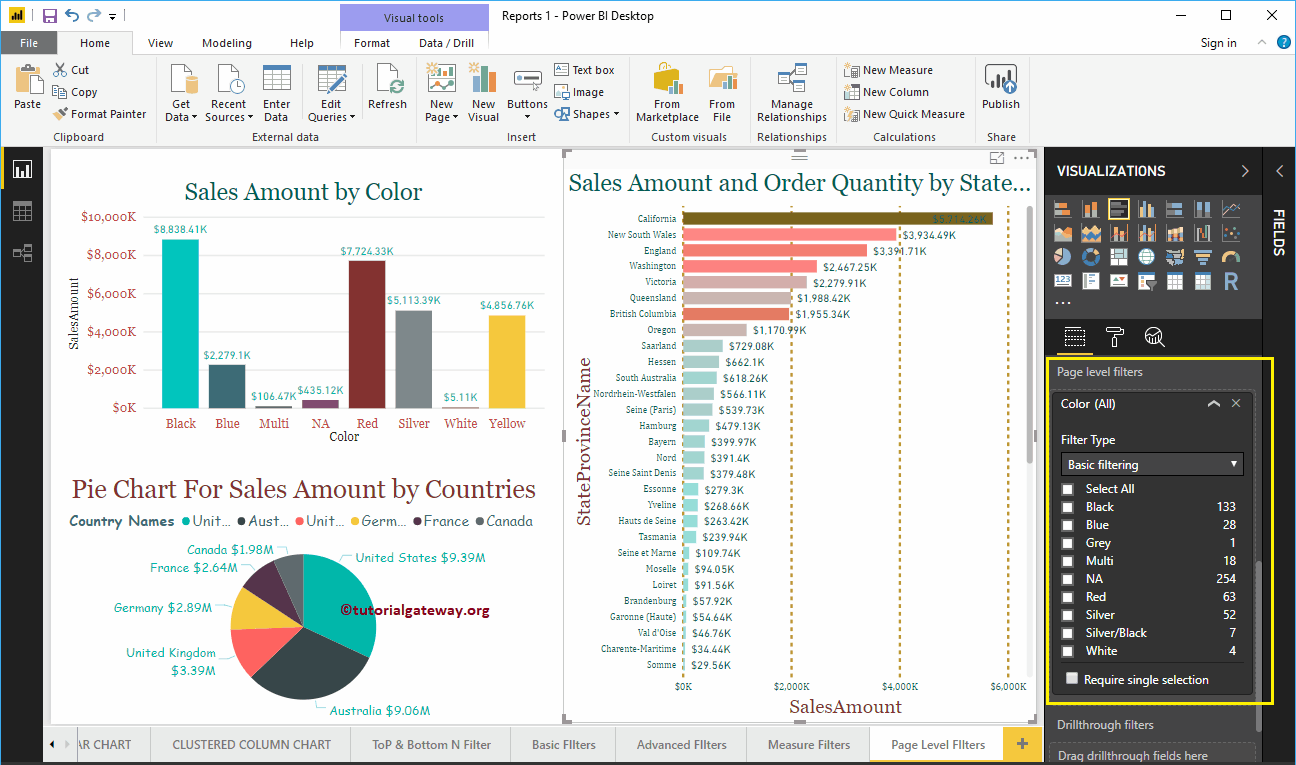
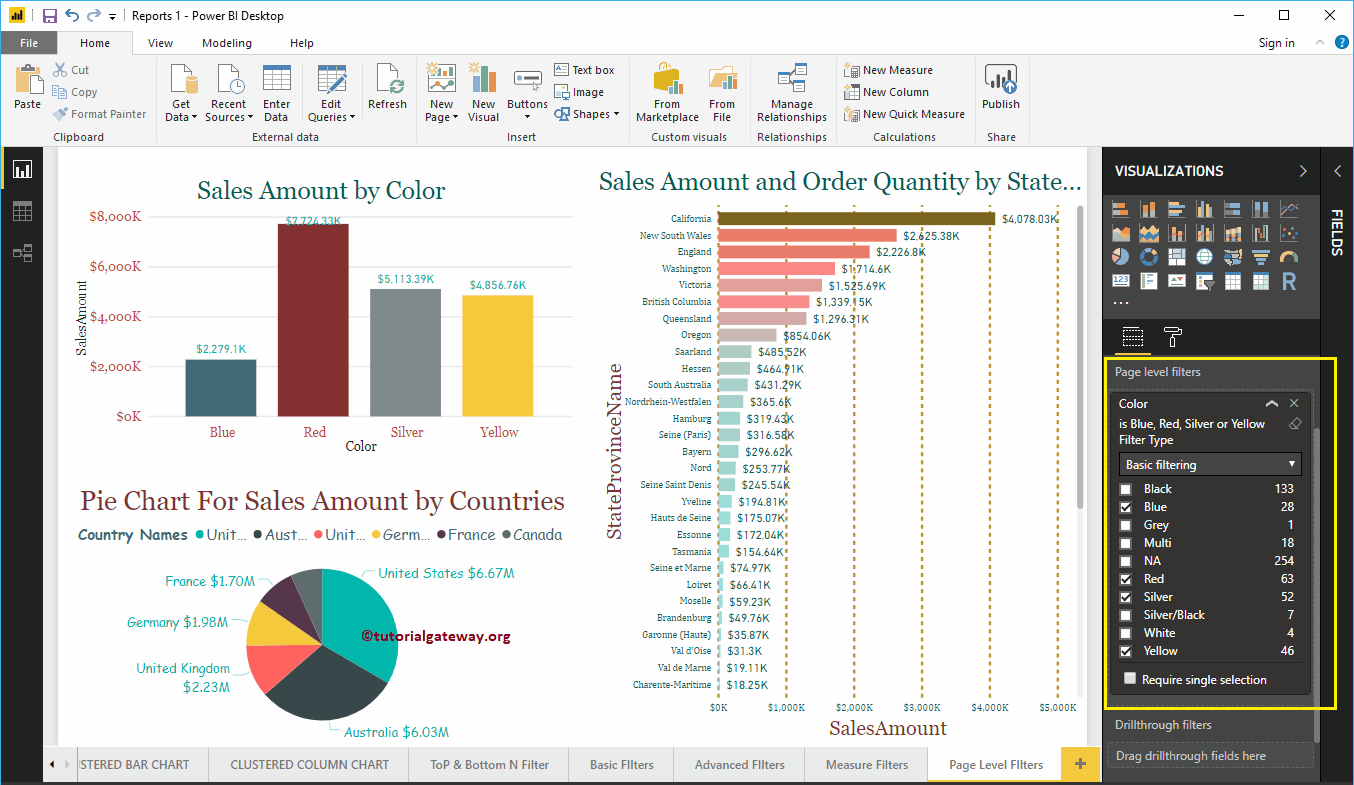
Please select Blue, Red, Silver, and Yellow colors as the basic Filtering fields.
From the screenshot below, you can see that the Column chart is displaying the Sales Amount for the selected colors. The Pie chart is displaying the sales amount for the selected product colors, and Bar chart is displaying the sales amount for selected colors.
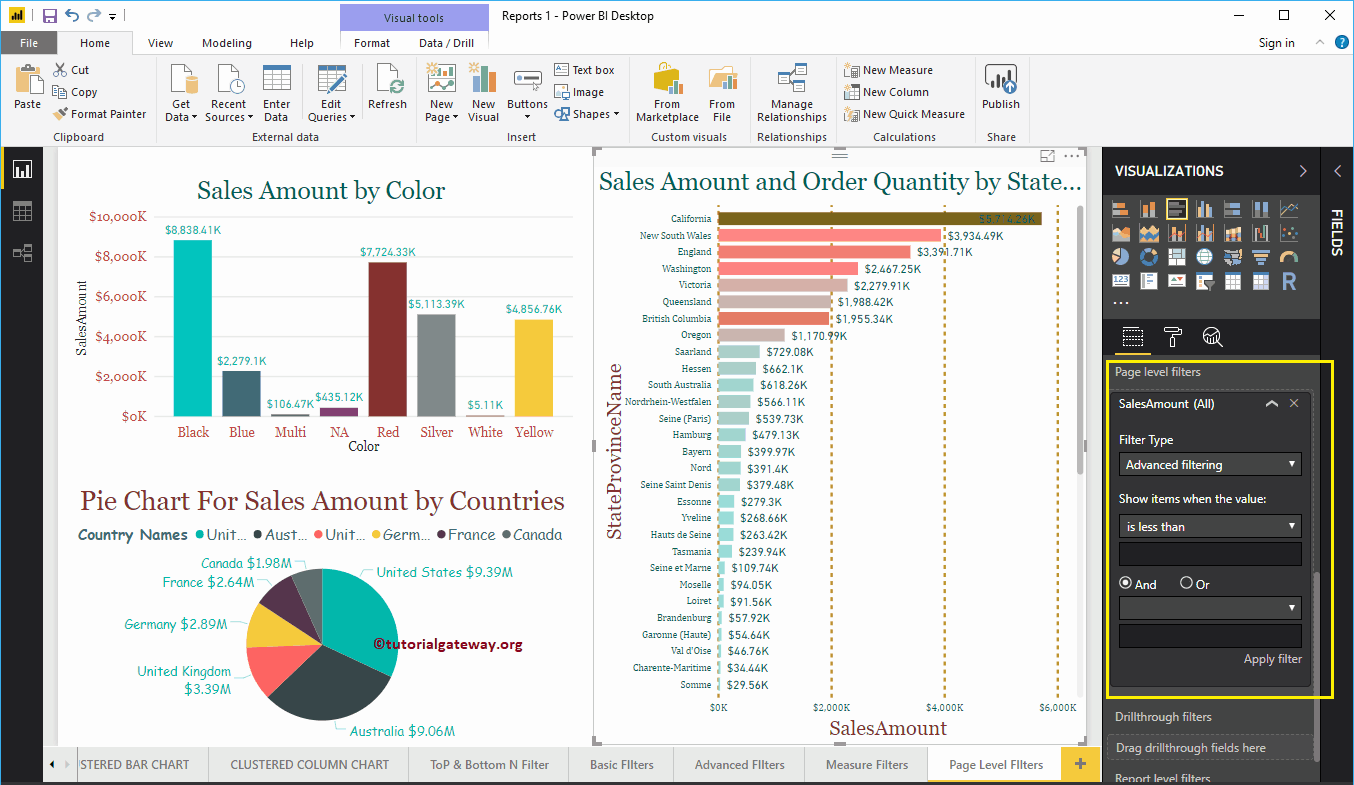
Let me remove the existing page level filters, and drag and drop the Sales Amount from Fields section to the Page level Filters. Next, expand the Sales Amount to see the filter options. Please refer to Filters on Measures article to understand these options.
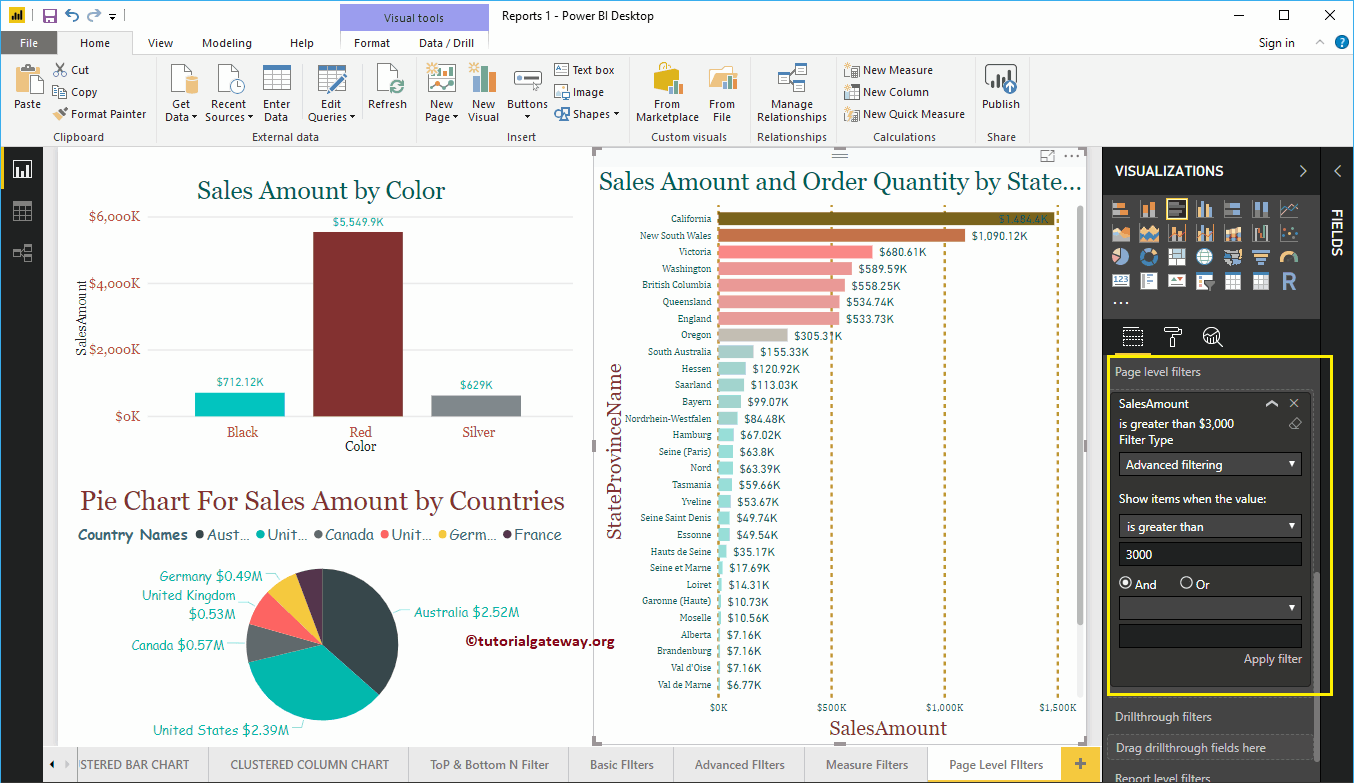
For this Power BI Page Level Filters demonstration purpose, we selected is greater than as the operator, and 3000 the value. All the reports on the below page are displaying the countries or states whose Sales Amount is greater than 3000.
Power BI Report Level Filters
The Power BI Report level Filters are to filter the visuals (or charts) present in all the pages of a Report. For example, if your report contains 10 pages, then you can use this report level filter to filters those 10 pages at a time. Let me show you how to create a Report Level Filters in Power BI with example.
To create this Report (the combination of pages) for Power BI Report level Filters demo, we used the SQL Data Source that we created in our previous article.
Please refer to Connect Power BI to SQL Server article to understand the Data Source.
How to create Power BI Report Level Filters
To demonstrate the Report Level Filters in Power BI, we are going to use the Report 1 that we created in our earlier posts. This Power BI report has 19 pages: Column Chart, Pie Chart, Treemap, Donut Chart, Bar Chart, etc.
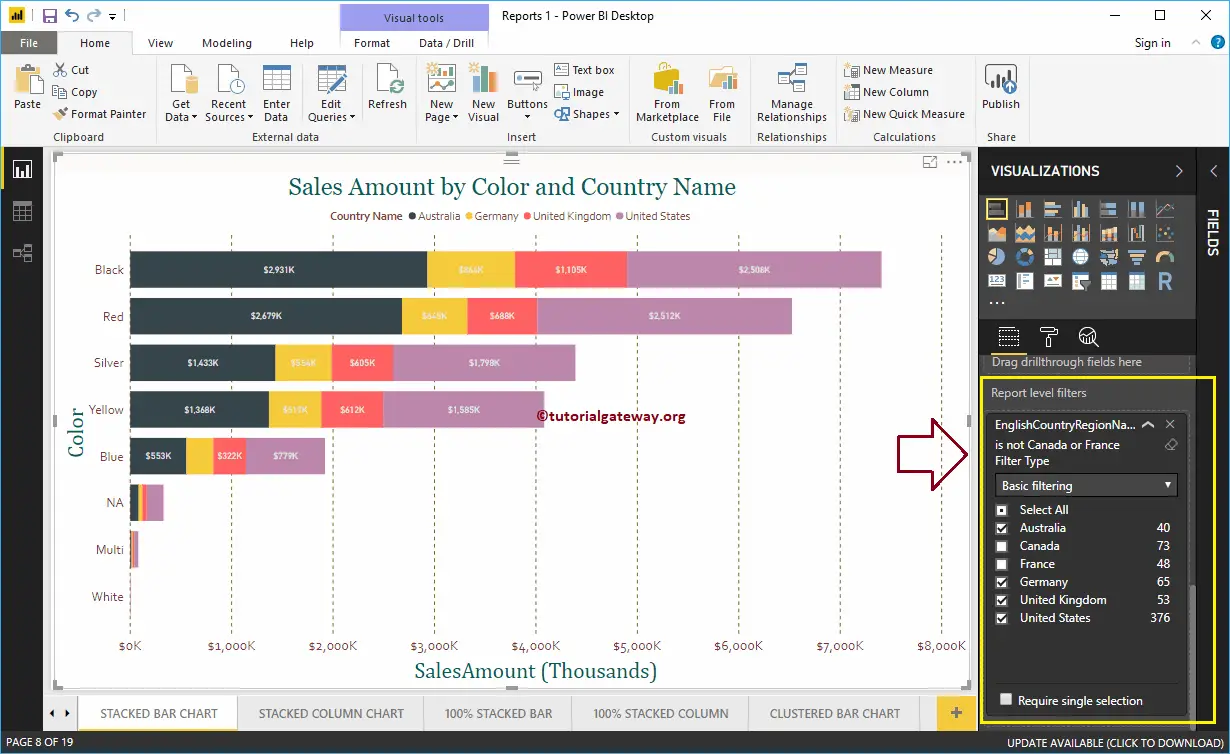
In this example, we create a Report Level Filter on the Stacked Bar Chart. Remember, this is the 8th page of a total of 19 pages.
As you can see from the screenshot below, we used the Color as the Axis field, Country Name as Legend field, and Sales amount as the Value field.
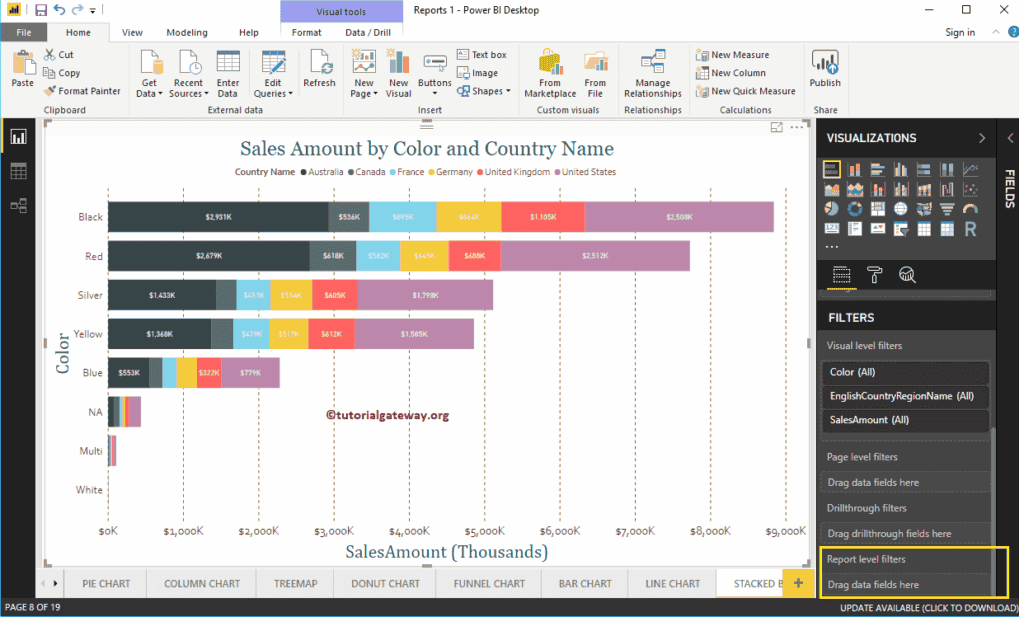
Under the Filters section, you can see the list of available report level filters in Power BI. You have to use the Report Level Filters section to create a filter at the report level.
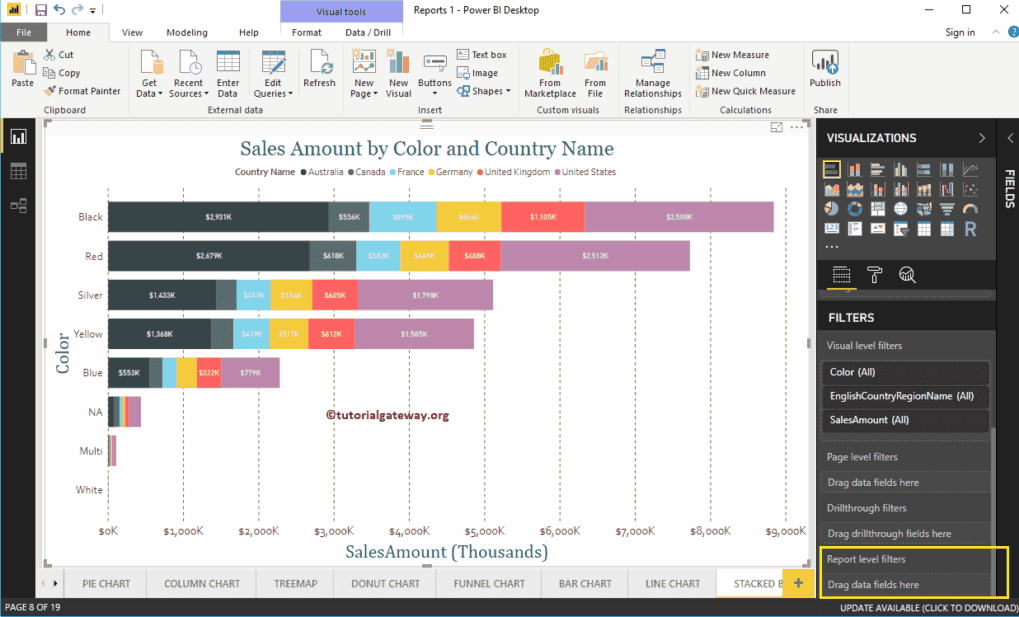
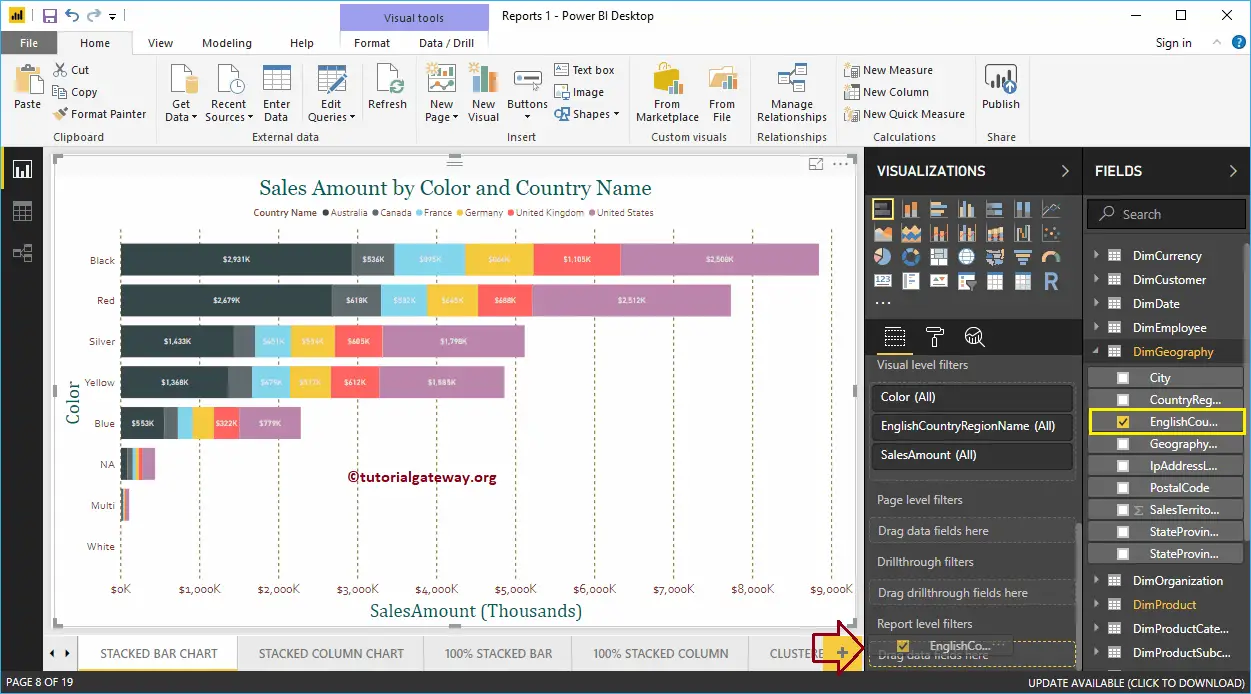
Let me drag and drop the English Country Region Name from the fields section to the Report level Filters.
Expand the English Country Region Name to see the filter types. By default, the Basic Filters option selected as the Filter type.
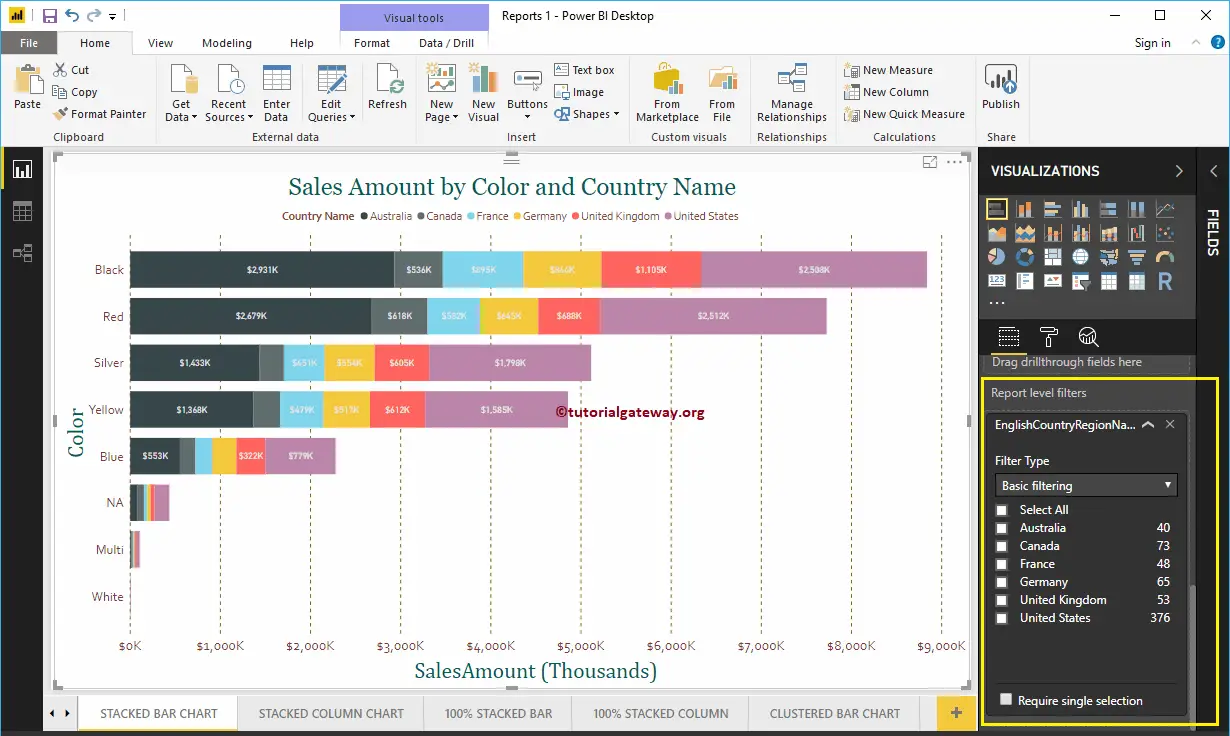
For this Power BI Report Level Filter demonstration purpose, we selected Australia, Germany, the United Kingdom, and the United States.
From the screenshot below, you can see that the Stacked Bar chart is displaying the Sales for the selected countries in a legend.
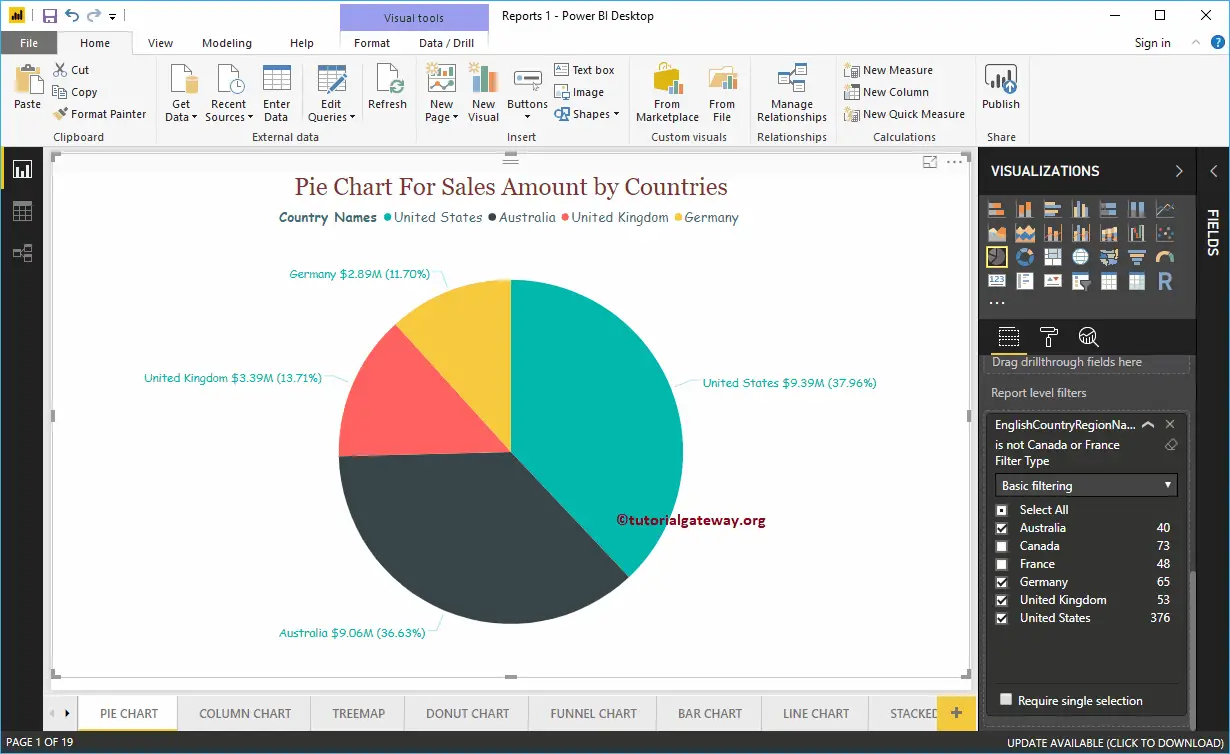
Let me navigate to page 1 of 19. As you can see from the screenshot below, the Pie chart also filtered by the Report level filter. I mean, it is displaying the sales for the selected countries.
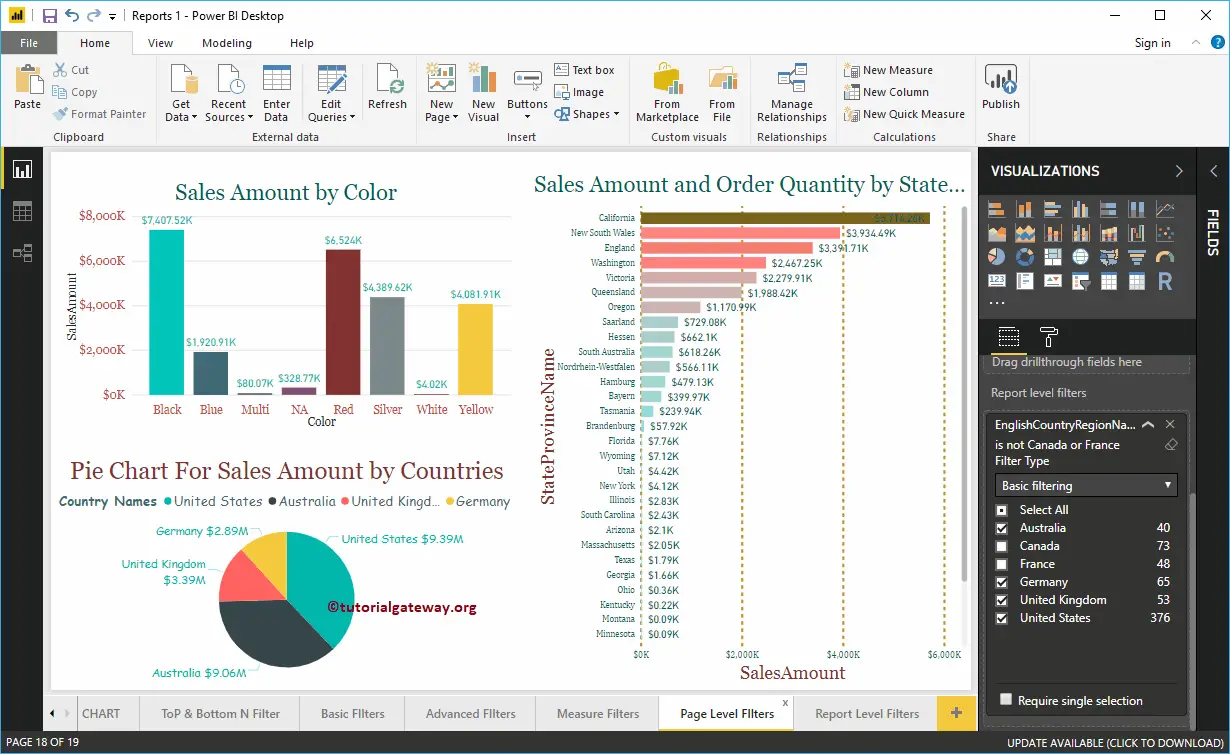
Let me navigate to page 18 of 19. You can see from the screenshot below, Power BI Report level filters are filtering these three charts.
Use the drop-down to change the report level filtering type to Advanced filtering.
Here, we are applying multiple filters on the Country column. The first filter checks whether the Country contains a united keyword or not. Or, the Second filter checks the countries that do not start with F.
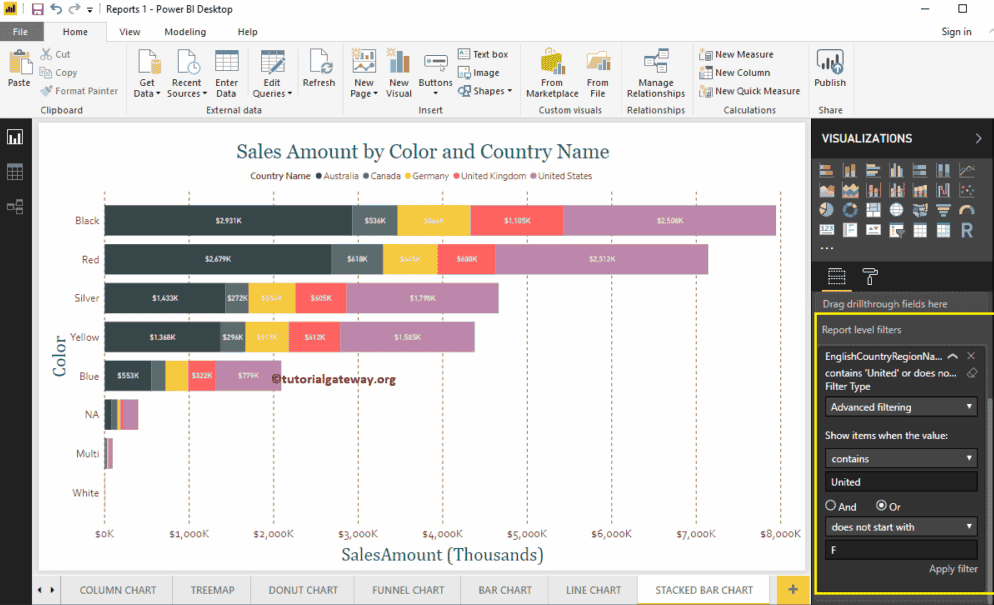
The below report is showing the Bars with Countries that contain the United keyword, and the countries did not start with F.
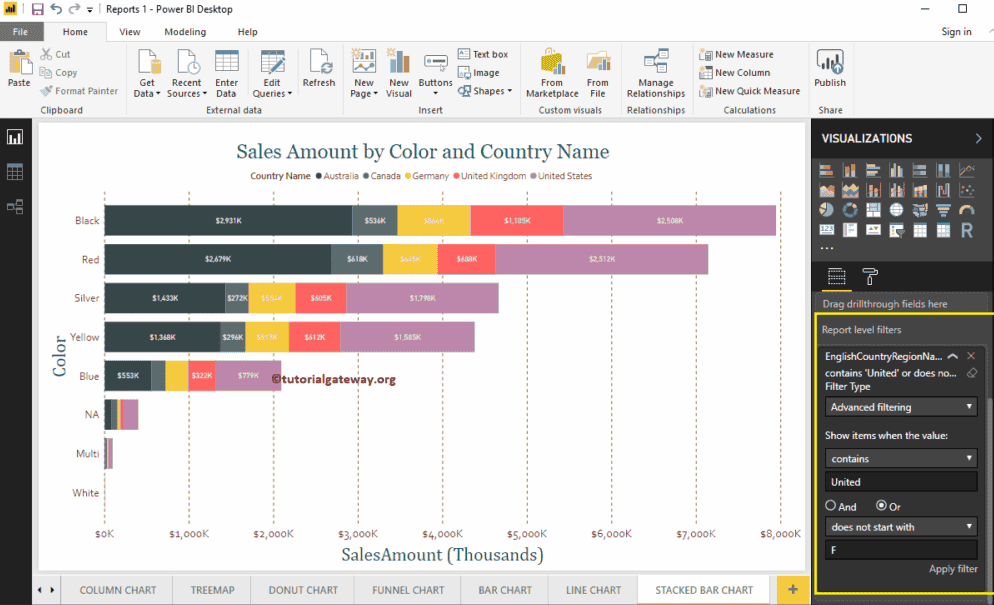
Let me navigate to page 1 of 19. As you can see, the Pie chart is displaying the sales for the countries that contain united or countries that does not start with F
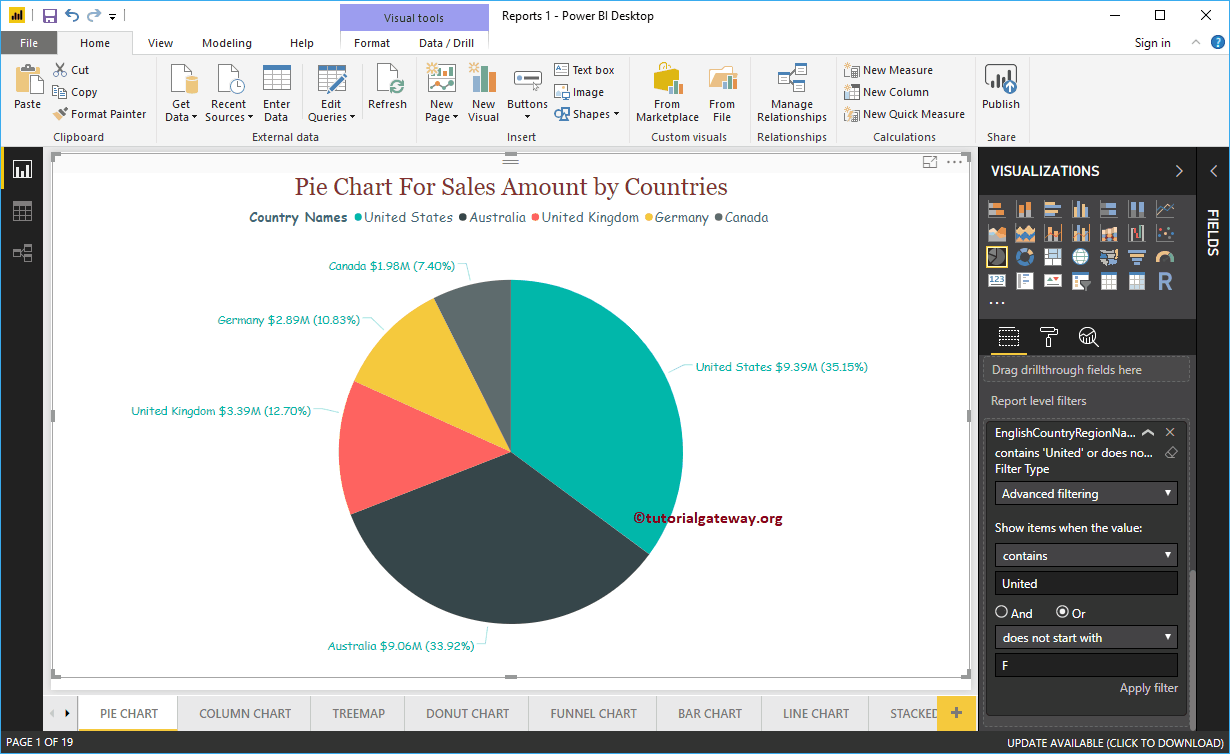
Let me remove the existing Power BI report level filters. Next, drag and drop the Sales Amount from the fields section to the report level Filters. Then, expand the Sales Amount to see the filter options. Please refer Filters on Measures article to understand these options
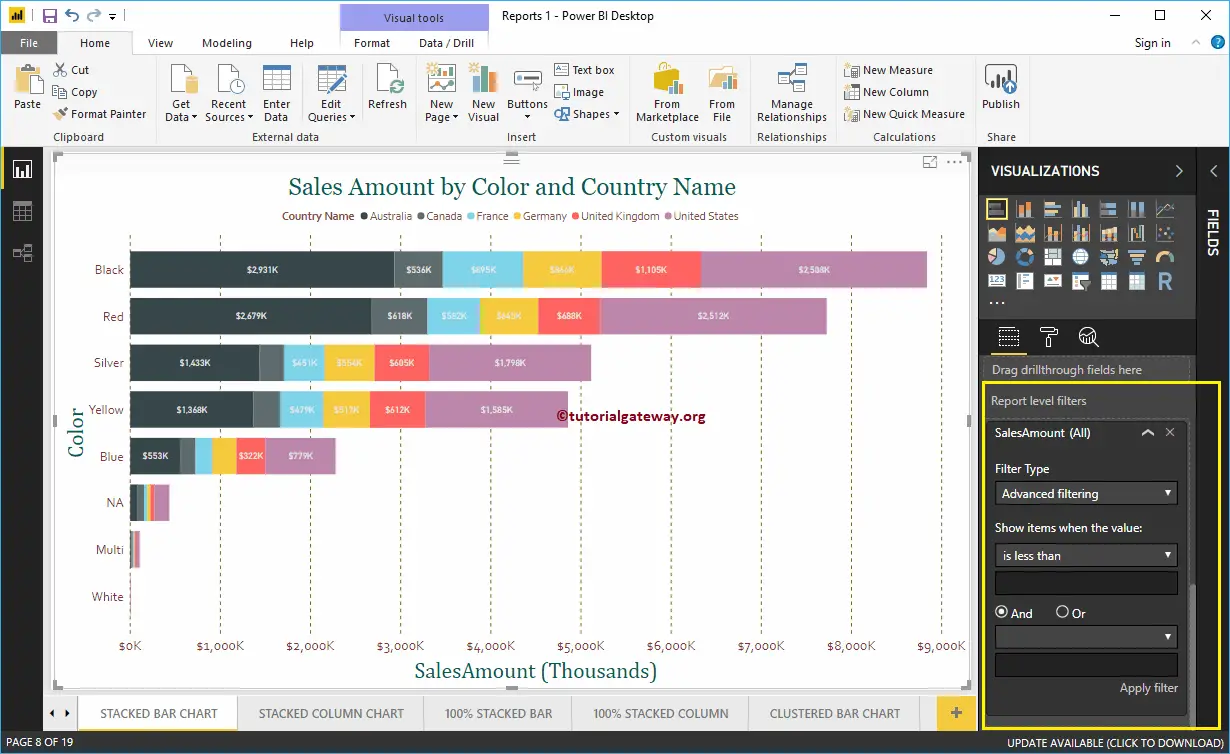
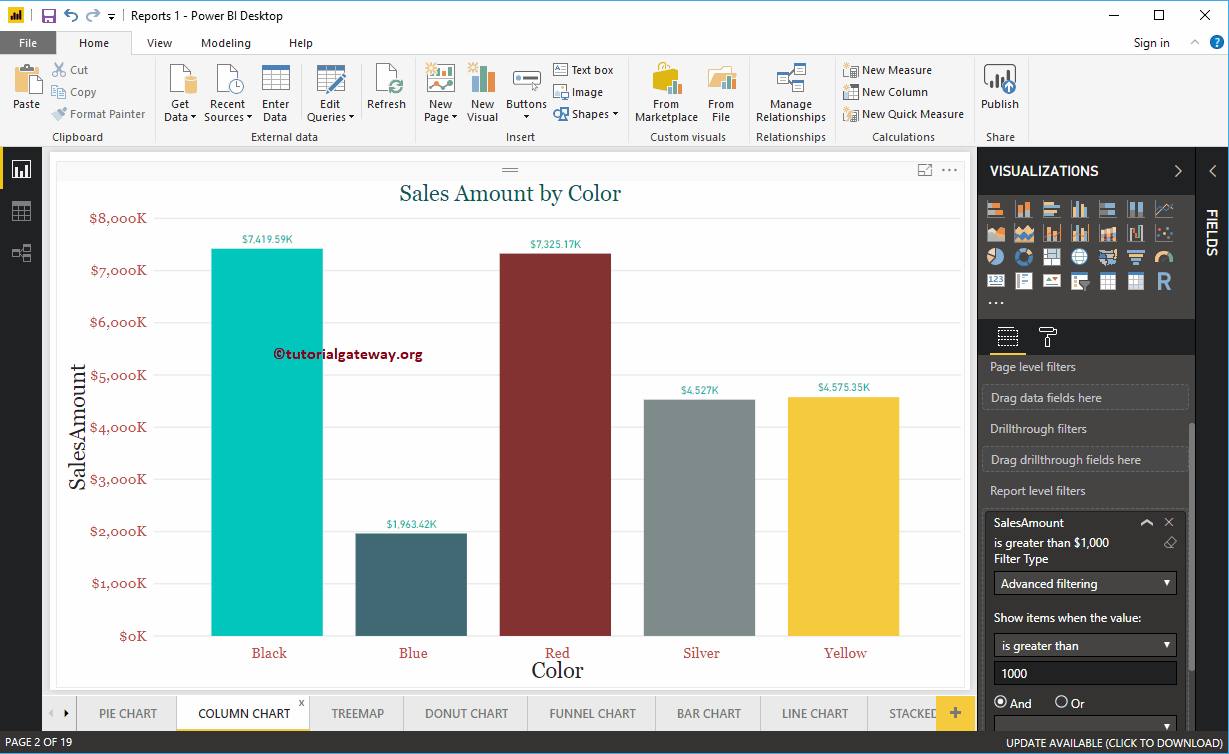
For the demonstration purpose, we selected is greater than as the operator, and 1000 the value. From the screenshot below, you can see that the Stacked Bar chart is displaying the bars whose sales amount is greater than 1000.
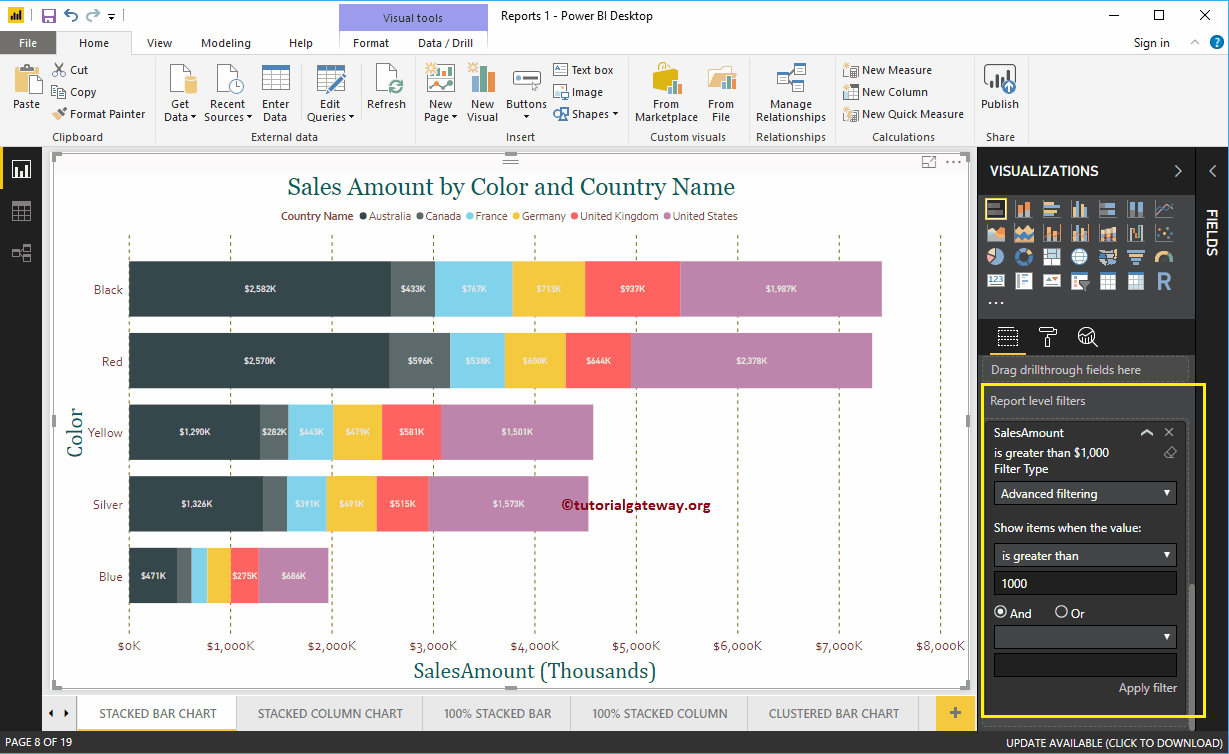
Now, you can see that the same filter applied to the Column chart present on page 2 of 19
Drill through Filters in Power BI
Power BI Drill through Filters are useful to drill through a particular field, or we can say, apply filters on reports at multi-level. Let me show you how to create Drill through Filters in Power BI with an example.
How to create Drill through Filters in Power BI
To demonstrate the Power BI drill through filters report, we are going to use the Countries hierarchy. Please refer to Create Hierarchy article to understand the steps involved in creating a hierarchy.
As you can see from the below screenshot, we created a Column Chart, by adding the Country hierarchy in the Power BI Axis Fields. And added the Sales amount as the Value field, and Order Quantity as the Color Saturation.
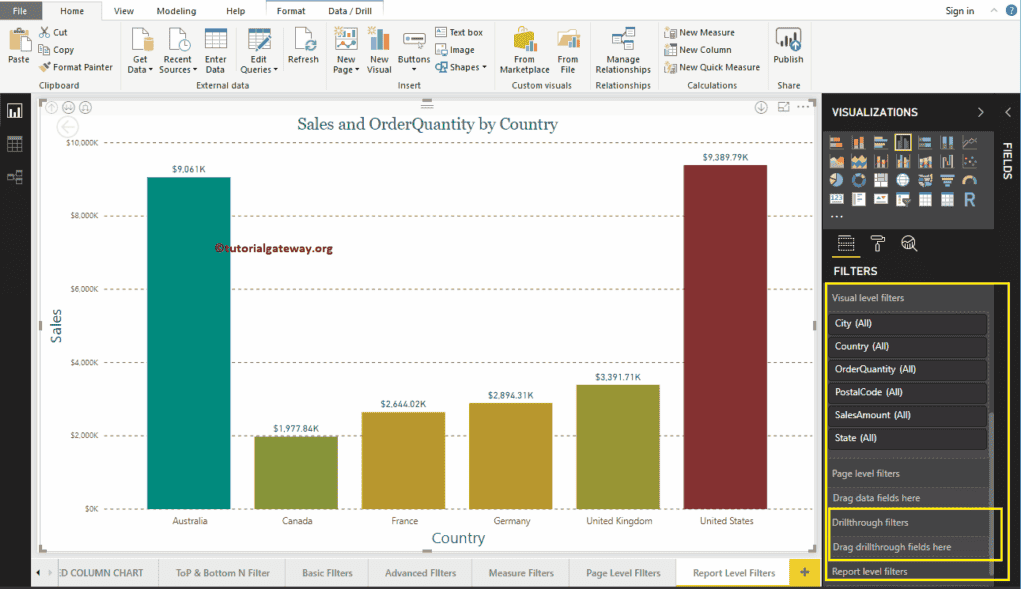
Under the Filters section, you can see the list of available filters in Power BI. You have to use the Power BI Drill through Filters section to create a filter at multi-level.
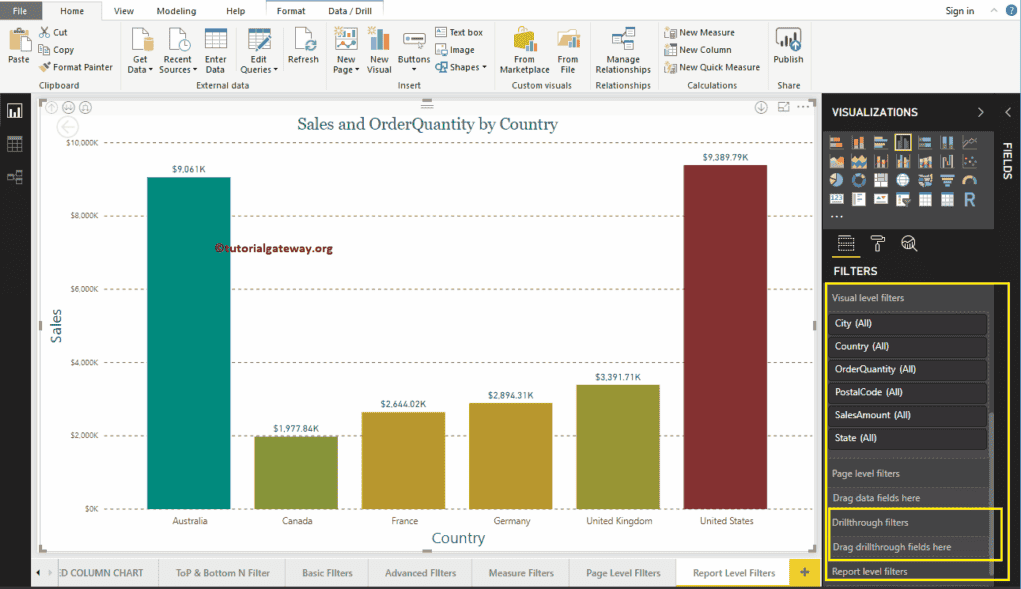
Let me drag and drop the Country from fields section to the Power BI Drill through Filters section.
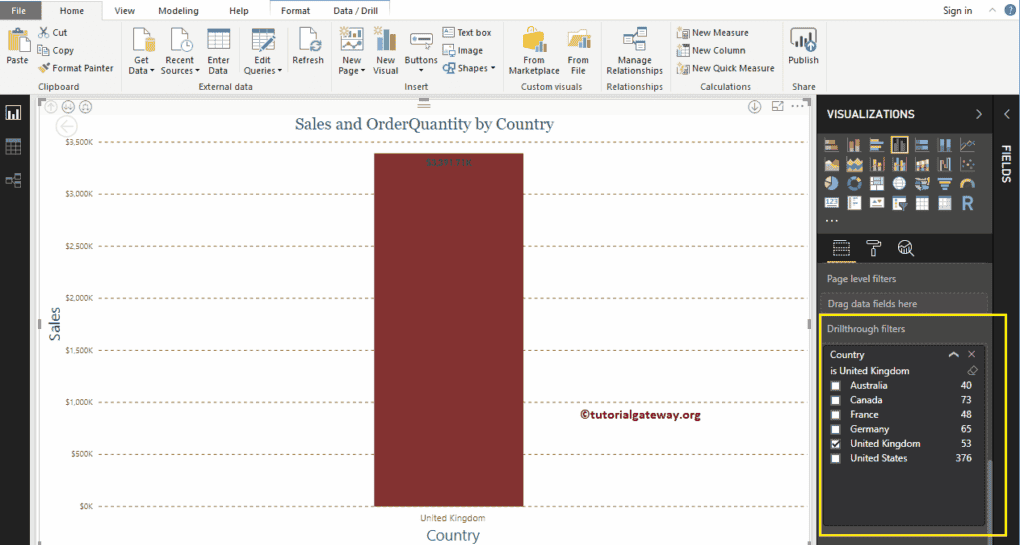
Expand the Country to see the filter types.
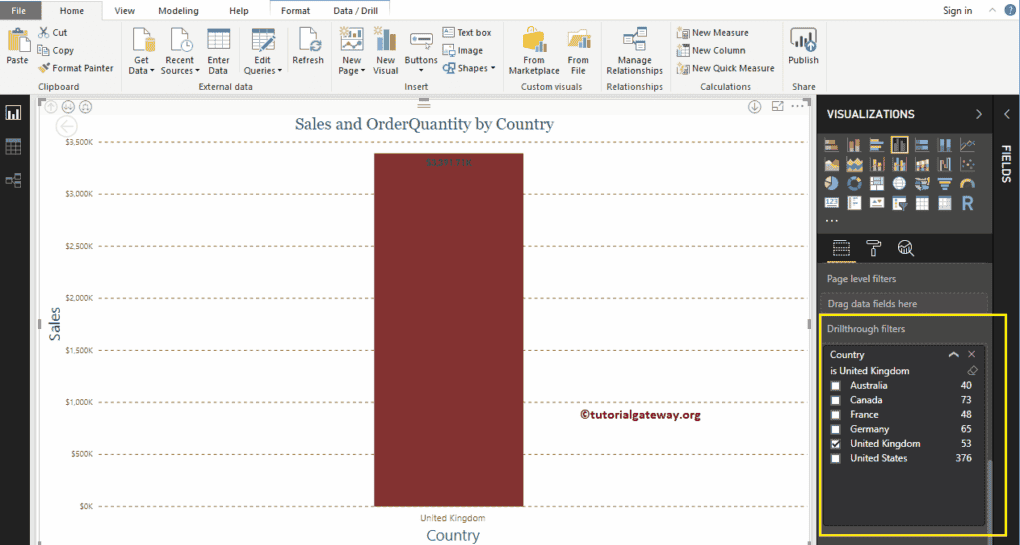
For the Power BI Drill through Filters demo purpose, let me select the United Kingdom. From the screenshot below, you can see that the Column chart is displaying Sales for the United Kingdom.
TIP: By default, you can only select One field (Country) at a time.
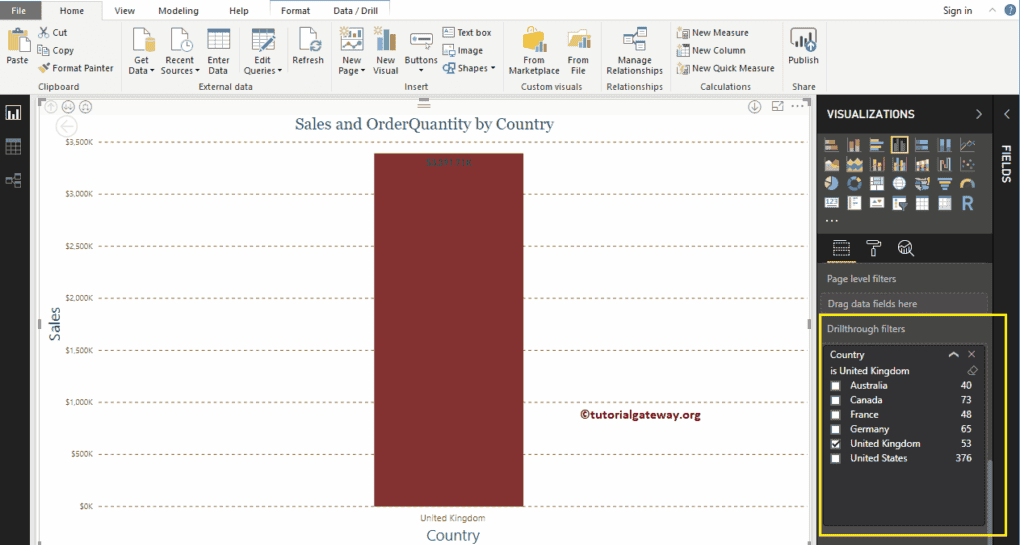
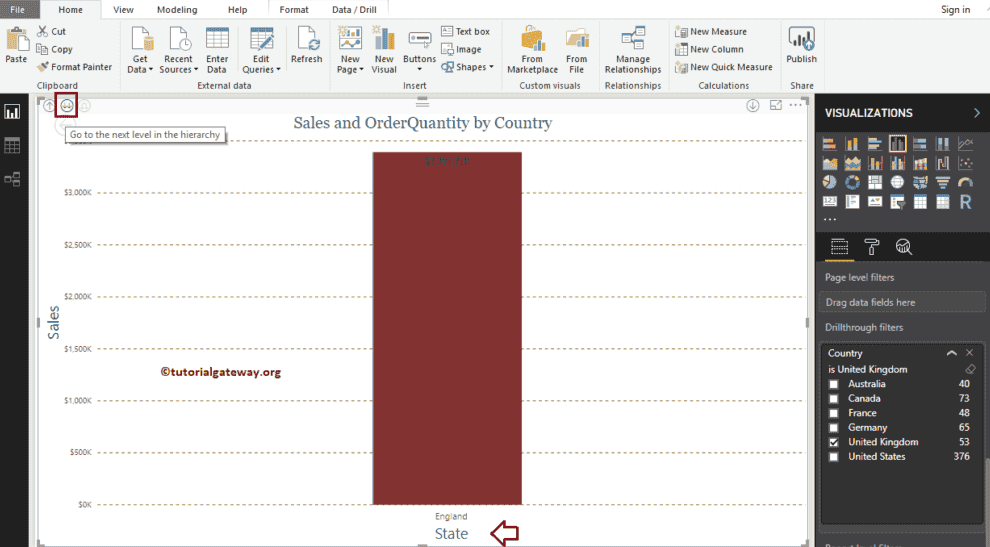
Let me drill down to the next level. I suggest you refer Drill Up and Drill Down reports article to understand the Multi-level reports.
Now you can see the Sales by State (level 2). If you notice closely, it is displaying the sales for England because this is the only state available for the United Kingdom
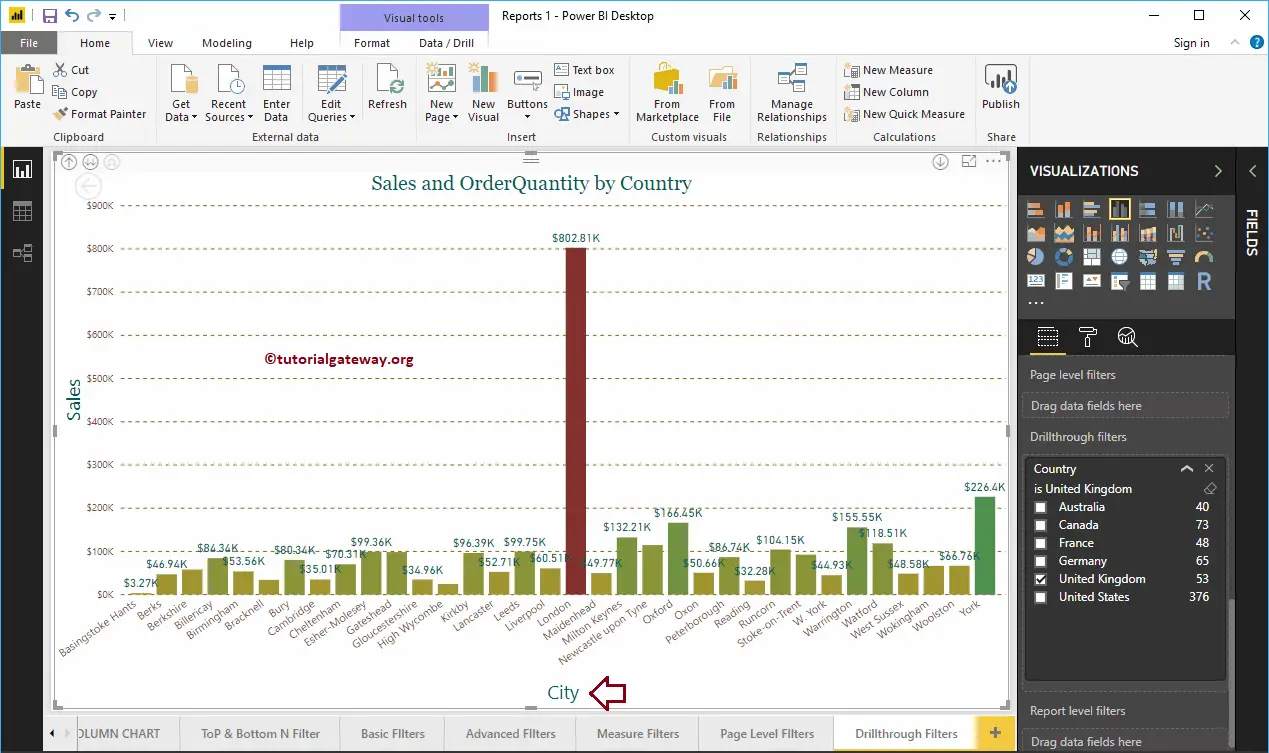
Let me go to another level. Now you can see the Sales by Cities present in the United Kingdom (level 3).
You can drill down further to see the Sales by Postal Codes present in the United Kingdom
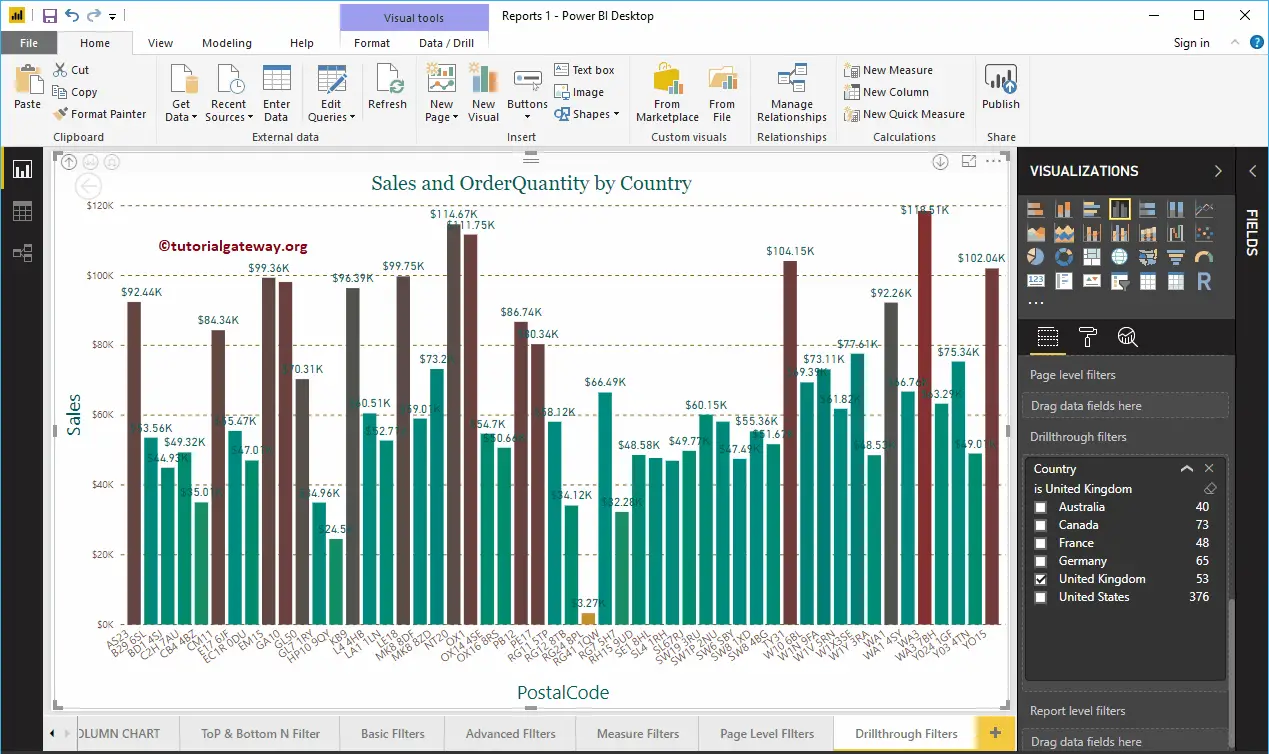
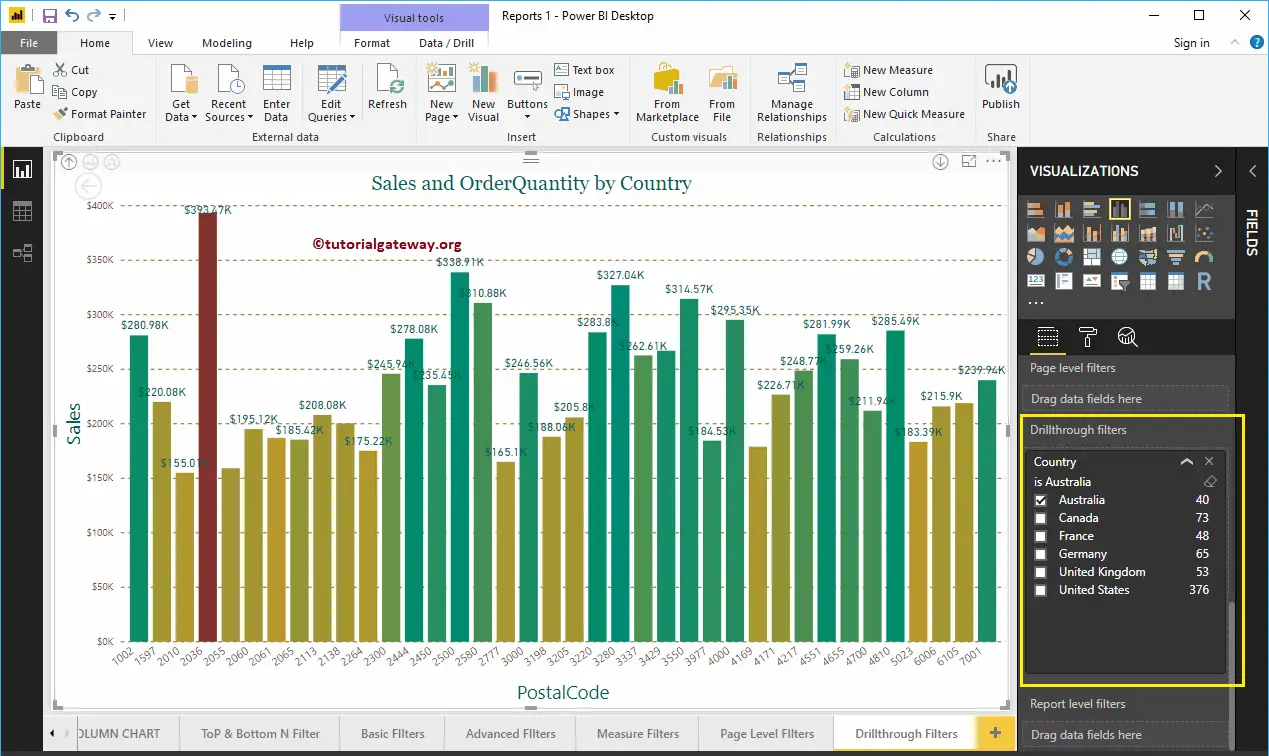
This time we are selected in Australia and went all the way down to Postal Codes level. From the screenshot below, you can see the Sales by Postal Codes present in Australia.
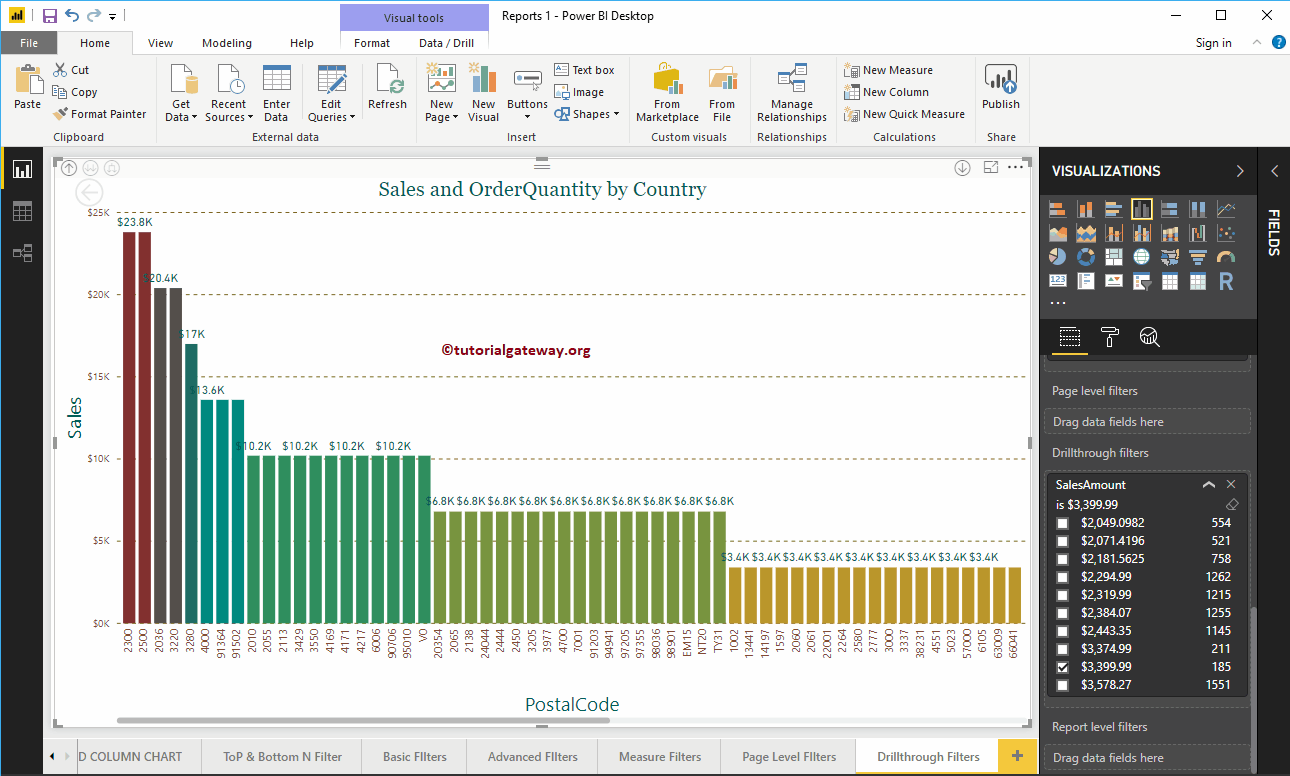
Let me remove the existing Power BI Drill through filter, and drag and drop the Sales Amount from fields section to the Drillthrough Filters. Next, expand the Sales Amount to see the filter options.
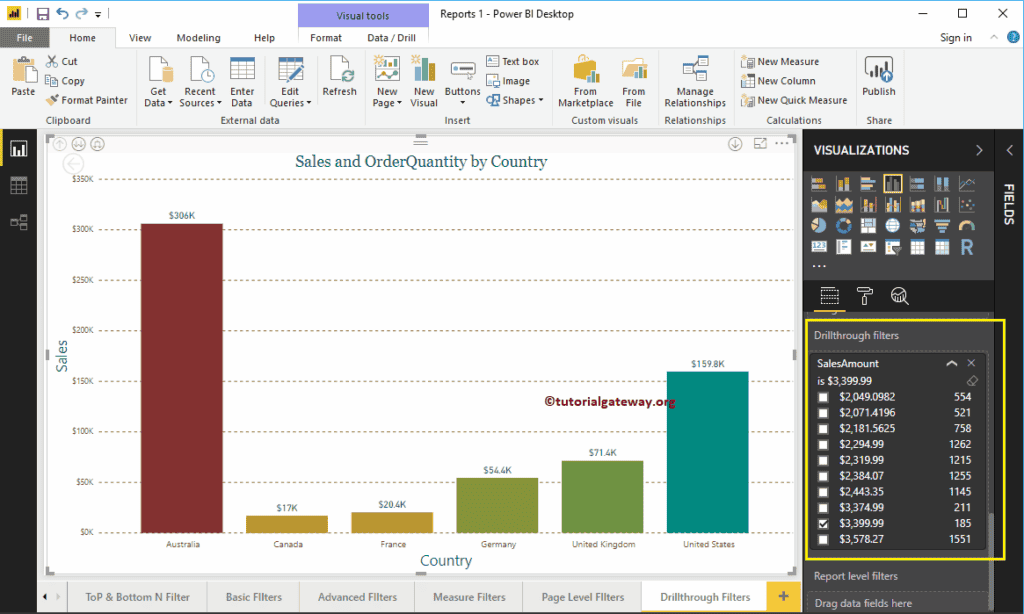
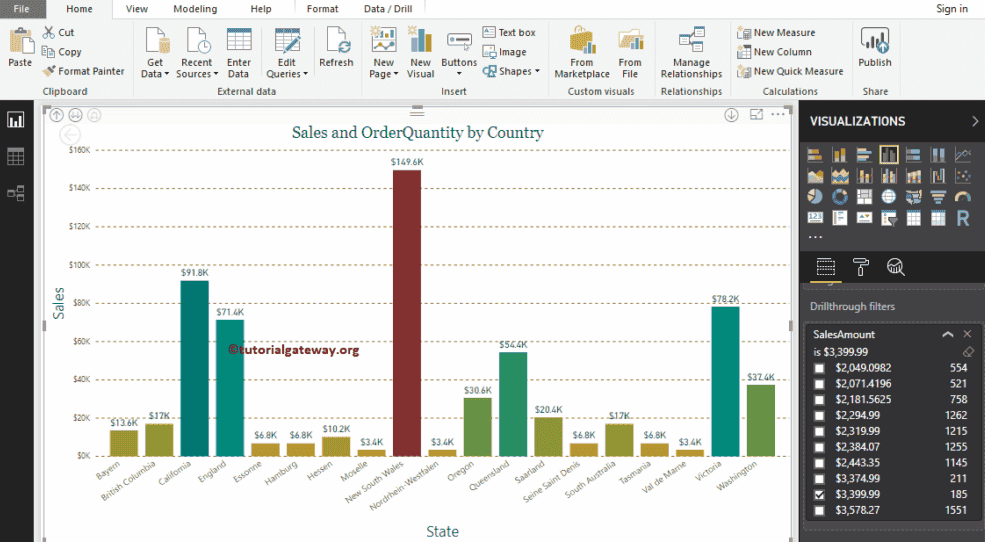
Let me select the Sales Amount as 3399.99
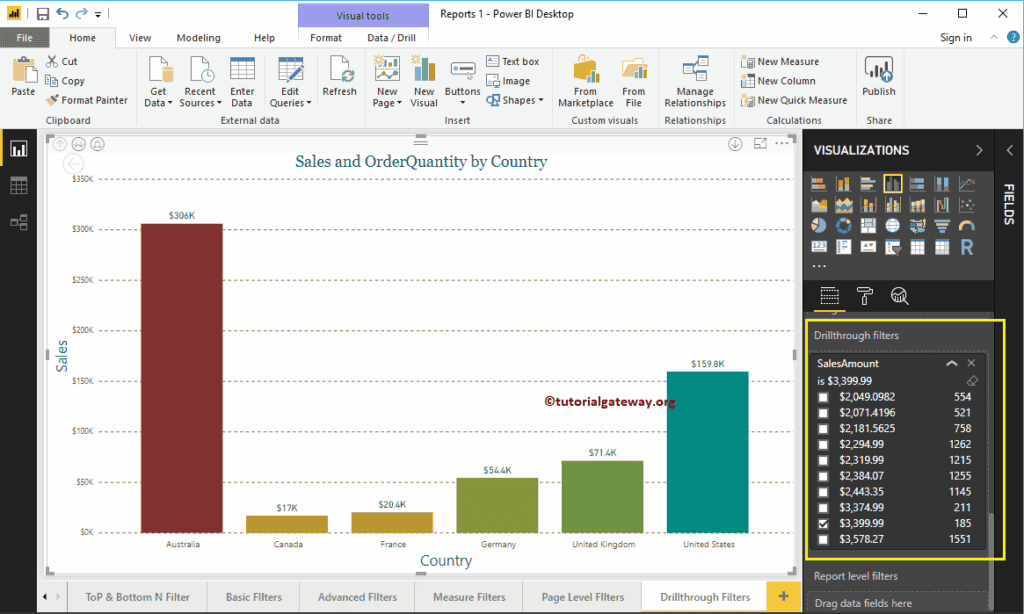
Now you can see the States whose Sales Amount is at least 3399
Now you can see the Postal Codes whose Sales Amount is at least 3399
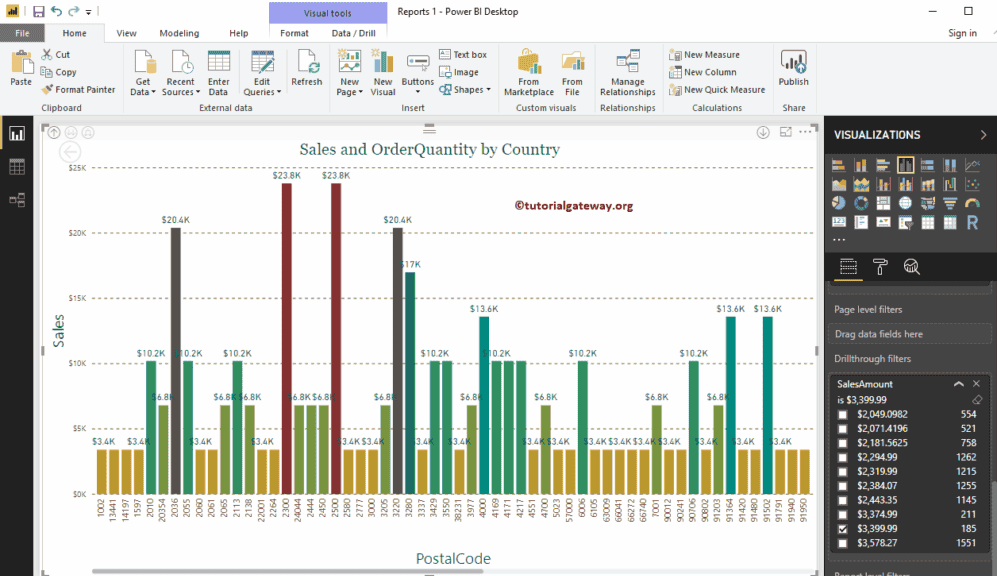
Let me Sort them by Sales Amount
