Users Online
· Members Online: 0
· Total Members: 188
· Newest Member: meenachowdary055
Forum Threads
Latest Articles
Articles Hierarchy
SAP BI Part 3
SAP BI Content: Installation, Activation
BI Content:
BI Content provides selected roles within a company with the information that they need to carry out their tasks. SAP NetWeaver Business Warehouse delivers pre-configured authorization objects under the collective term BI content. To understand this we take an example of a sales manager, who wants all the information like sales, market share, product quality, sales and service cost etc… to enable him to make effective decision. A BI content role will bring all this data together in the form of workbooks and queries carrying exactly the information the sales manager needs. No sensitive & confidential information from the HR department are shown to him
Benefits of BI Content:
Below mentioned are the benefits of using BI Content.
- Be used in particular industries without being modified
- Be modified, meaning you can customize it to any degree of detail
- Serve as a template or an example for customer-defined Business Content
- Immediate access to interpreted information.
- Ready-to-go reports, data models, extractors, transformations
- Significant cut down of implementation time and costs
- Consistency of operational processes with management processes
- Easily extensible
- Automatic improvements to the information model
- Data consistency and integrity
- Rich set of standard key performance indicators
BI Content Objects:
Business Content includes:
- SAP extractor programs
- Data Sources
- Process Chains
- InfoObjects
- InfoSources
- Data targets (Info Cubes and DSO objects)
- Variables
- Queries
- Workbooks
- Transformations and Update Rules
- Web templates
- oles
Activation of BI Content:
Steps to view and activate objects available via BI Content:
Step 1)
- Go to Transaction Code RSA1.
- Click the “Ok” button.
Step 2)
- Browse to the tab “BI Content”.
- Click on “Object Types.”
Step 3)
You can browse the BI Content using different views. In attached screenshot, the content is grouped by “Object Type”.
- Click on “Select Objects” for required Object Type. Each object type is meant for a different role in an organiztion
- In the subsequent screen, select the required objects.
- Click on“Transfer Selection”.
Step 4)
The selected objects and all the objects on which they are dependent are added hierarchically.
- Select / deselect required objects
- Click on “Install” Button
- Click on Install from the drop-down.
SAP BEx Query Designer Tutorial & Query Elements
- The key to making informed decisions is having the right data in the right place at the right time. Executives and line managers rely on business intelligence (BI) and reporting tools to deliver timely accurate and relevant data for both operational and strategic decisions.
- The Business Explorer (BEx) is a component of SAP BI that provides flexible reporting and analysis tools that we can use for strategic analysis and supporting the decision-making process in an organization. These tools include query, reporting, and analysis functions.
- SAP NetWeaver 7.0 provides the following tools:
- BEx Query Designer
- BEx Web Application Designer
- BEx Broadcaster
- BEx Analyzer
- The BEx tool can be used to display past and present data differing in the level of their details and from different perspective.
- It can be used to create planning projections using BI Integrated Planning.
- The BEx Information Broadcasting can be used to distribute business intelligence content by e-mail, either as pre-calculated documents with historical data, or as links with live data.
Query Designer:
As the name suggests, it is used to define queries to retrieve data from SAP BW. Query Designer acts as the bridge between SAP BW InfoProviders and the reporting front-end tools (SAP BW / SAP BO). It limits the field list displayed, which is based on their requirements. It also defines the default placement of these report objects within a report Query Designer and adds value by allowing users to define filters, selection screen variables (a.k.a. Prompts), Calculations, Unit Conversions, etc. that are not available in InfoProviders.
Accessing Query Designer:
To access BEx Query designer, follow the below steps.
Step 1)
- Navigate to Start -> All Programs.
- Under the folder “Business Explorer”, the “Query Designer” is available. Click on “Query Designer”.
Step 2)
- Select required BW system
- Click the Ok button
- Enter the Client
- User Name
- Password
- Logon Language
- Click the Ok Button
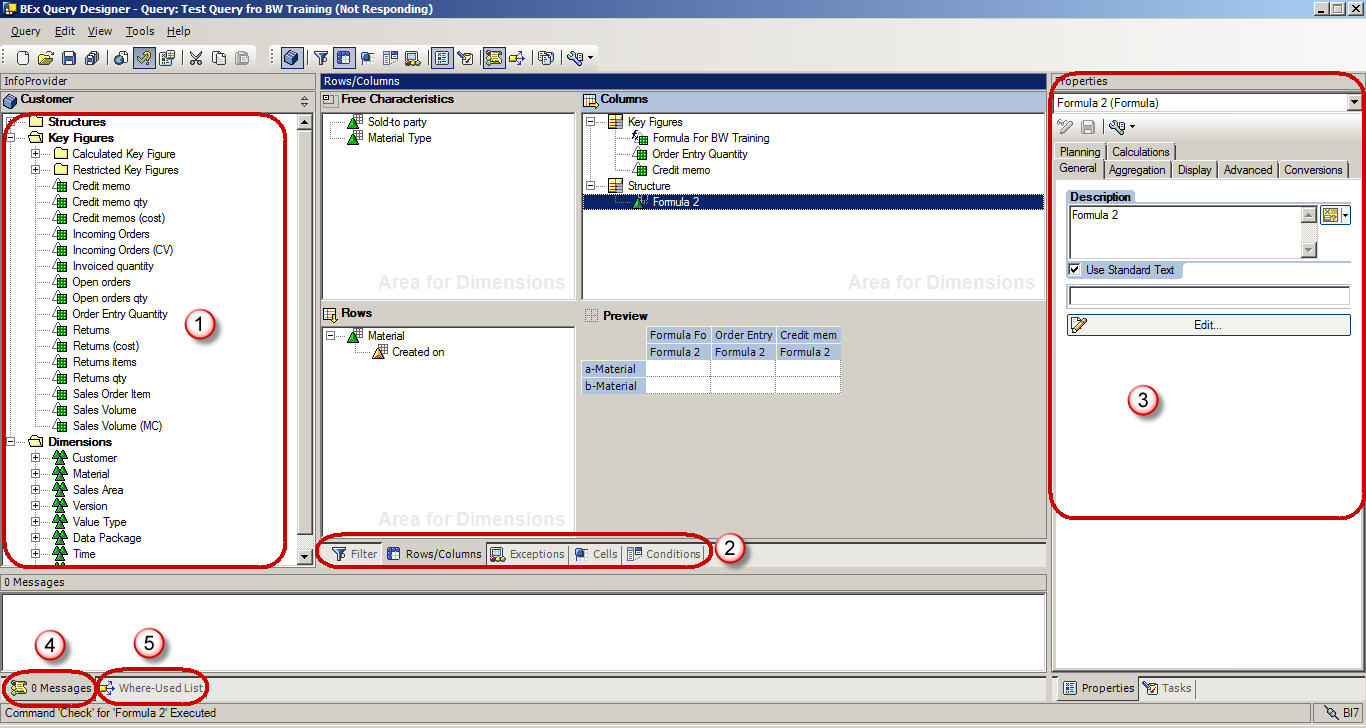
Query Panel:
- InfoProvider Details are available here.
- Tabs to view various report components.
- Properties Box which shows the properties of each component selected in the query.
- System Messages such as any error or warning messages during the Query check is displayed here.
- Shows the Where-Used List of any component selected within the query.
Query Panel – Standard Toolbar:
The Standard tool bar in the Query Designer has the following buttons.
- Create New Query
- Open Query
- Save Query
- Save All
- Publish on Web
- Check Query
- Query Properties
- Cut
- Copy
- Paste
- Toggle tabs for Filter and Rows/Columns
- Cells
- Conditions
- Exceptions
- Properties
- Tasks
- Messages
- Where Used
- Documents
- Technical names
Query Elements:
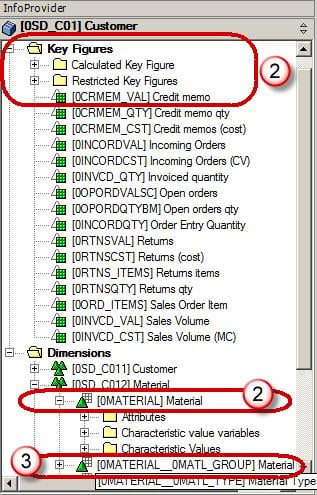
- Key Figures : Key Figures represent the numerical data or the KPIs(Key Performance Indicator). They are further divided into Calculated Key Figures (CKF) and Restricted Key Figures (RKF).
- Characteristics : A characteristic provides the criteria according to which objects are classified. e.g. Material,Period, Location, etc.
- Navigational attributes appear as characteristics in Query designer.
OTHER Query Elements:
- Dimensions : Similar characteristics are grouped together in a dimension. e.g. Time dimension consistsof Year, Month, Week, etc.
- Attributes : Attributes define the additional properties of a characteristic. E.g. Material may have size,length or width. It is not possible to add a display attribute to a query unless the related characteristics are also added to the query. However, it is possible to set the property of characteristic as “No Display”.
Query Properties:
- Select the Tab “Variable Sequence”. The tab “Variable Sequence” is used to control the order in which selection screen variables are displayed to users.
- List the variables used in the Query. There can be multiple variables present here. These variables can be sequenced as per our need.
- Select the “Display” tab.
- The Check box “Hide Repeated Key Values” controls whether the characteristic will repeat in each row or not.
- The option “Display Scaling Factors for Key Figures” controls whether the scaling factor is reported at the top of corresponding column.
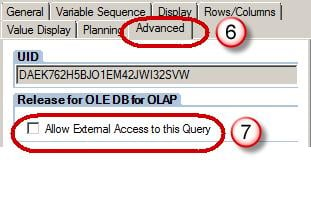
- Select the “Advanced” tab. The tab “Advanced” is most important from BO perspective . It controls whether the query is visible to BO or not. The option must be checked to allow query access to BO.
- The Check box “Allow External Access to this Query” should be checked if this Query is to be used from BO
- Select the “Rows/Columns” tab.
- The options under “Result position” section decide the Location of sub-total (a.k.a. results in BW world) as below / above or right / left of the Characteristics.
- The options under “Suppress Zeros” section decide the application of Zero-Suppression on the query.
Filters:
Filters are used to restrict the data retrieved by a query. Filters can be dynamic or static in nature. Values entered as static filters cannot be overwritten by users at runtime while dynamic filters or variables can be overwritten by user / system during query execution.
Steps to apply filters in the Query
- Select the “Filter” tab.
- Filters can be applied in the “Characteristic Restrictions” section.
- Filters can be applied in the “Default values” section.
Characteristic Restrictions are applied before data fetch operation, while the default values will result in entire data being fetched by query. The restriction is applied only in report front end. If “Clear all filters” option is applied in WAD / Analyzer, the filters in Default Values will be erased from front end, but the filters applied via Characteristic Restriction will still remain in force. It is recommended to have at least one or two characteristic restrictions while using a BW query for BO Universe.
Variables:
Variables are query parameters that we define in the Query Designer and are filled with values only when you execute the query. Variables are reusable objects. The variables defined in the Query Designer are available in all InfoProviders. They do not depend on the InfoProvider, but rather on the InfoObject for which they were created.
Types of Variables
- Characteristic values
- Hierarchies
- Hierarchy Nodes
- Texts
- Formula elements
Steps to create a variable:
Step 1)
- To create a variable, browse to the folder called “Characteristic Value Variables” under the corresponding characteristic.
- Right click on the folder and select the option “New Variable”.
Step 2)
- In the subsequent window, enter the Description.
- Enter the Technical name.
- Variable Processing Types
- Under reference characteristic, the variable can be assigned to either the specific InfoObject or all Info-Objects based on same reference characteristic.
- Under the “Details” tab, we can specify whether the variable accept:
- Single Value/ Multiple Values/ Range
- Selection Option (allows any of the above at runtime, is not supported in BW-BO)
Step 3)
- Click the “Default values” tab.
- We can specify the default filter applied to the report. This value can be over-written by user at run-time.
Conditions & Exceptions:
Conditions act as filters on key figures. e.g. Top 10 customers, products with bottom 10% margin, etc.
Exceptions are similar to “conditional highlighting” in MS excel. They are used to highlight rows / columns / cells where the KPI value is above or below a certain threshold. As these are not imported to a BO Universe, we will not discuss them in details in current tutorial.
SAP BEx: Characteristics & Key Figure Settings (RKF, CKF & Formulas)
In this tutorial you will learn about
Characteristics Settings – Display Name
Characteristics Settings – Display Properties
Key Figure Settings – Display Name
Key Figure Settings – Display Properties
Key Figures – Calculated Key Figure
Key Figures – Restricted Key Figure
Characteristics Settings – Display Name:
By default, when a characteristic is added to the query, it displays the description specified in SAP BW. It is possible to replace this with customized text as follows.
- Click on Properties
- Select the General tab
- Enter Description
Characteristics Settings – Display Properties:
- Select the Display tab of the properties window of the selected characteristic.
- The “Display as” option is used to display either only the Key or only Text or both Key & Text.
- If a characteristic has 2 or more of Short / Medium / Long Text populated, “Text View” is used to display corresponding text.
- It is possible to sort data ascending / descending either by the characteristic or any of its attributes.
- The “Result Rows” option is used to show or hide sub-total for underlying characteristic.
Characteristics Settings – Display Records:
The display option is used to define what data is viewed by user during data selection (in filters) and after report execution.
- Select the Advanced tab of the properties window of the selected characteristic.
- Access Type for Result Values. Choose one of these values.
- “Posted values” is used to show only records that have got some transactions associated with them
- “Master Data” displays all master data records irrespective of whether a transaction exists for them or not. It is ineffective if used with zero suppression.
- Filter Value Selection. Choose one of these values.
- Only Posted Values for Navigation: The system displays only posted values from the current navigational state.
- Only Values in InfoProvider: The system displays only values contained in the InfoProvider.
- Values in Master Data Table: It is faster, but may result in zero records matching selection criteria.
Key Figure Settings – Display Name:
By default, when a Key Figure is added to the query, it displays the description specified in SAP BW. It is possible to replace this with customized text as follows.
- Click on Properties
- Select the General tab
- Enter Description
Key Figure Settings – Display Properties:
- Select the Display tab of the properties window of the selected Key Figure.
- Hide:
- The options “Always Show” and “Always Hide” are self explanatory.
- Hide (Can be Shown) option is used to keep a key figure hidden in default output of the report. However, the user can later display this field by using filters.
- Number of Decimals places can be used to restrict the decimal places displayed in report.
- Scaling factor is used to show data in thousands / hundreds / etc.
- The sign of key figures can be reversed if required. e.g. Sales Quantity is negative movement from Inventory perspective, but positive from sales perspective and we can reverse sign based on user.
Key Figure Settings – Currency Or Unit Conversion:
BW does not allow cumulating amount in different units e.g. one rupee to one dollar or one kilogram to one yard. When data exists in multiple currencies / unit, all records must be converted to single currency / unit using Currency Translation / Unit Conversion. The translation can be dynamic (by using selection screen variable) or static (with target currency / unit hardcoded in adjacent screens). Advantage of doing this in SAP BW is that it directly imports the conversion factors available in SAP ERP to SAP BW.
- Select the Conversions tab.
- For currency translation, this option can be used.
- For unit conversion, this option can be used.
Key Figure Settings – Aggregation:
Query Designer gives the flexibility of calculating aggregates as average, summation, minimum,
etc. Similar calculations can also be performed on row-level data.
- Select the Calculations tab.
- Select from the Different options available under the drop-down of “Calculate Results As”.
Key Figures – Local Formula:
BW, allows use of formulae, on data coming from InfoProvider, to provide calculated values to user.
e.g. Subtracting Cost from Revenue to calculate Profit
Steps to create Formula:
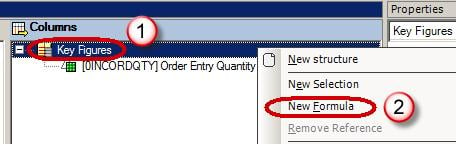
Step 1)
- Right click on the structure “Key Figure”
- Click on “New Formula”
Step 2)
Click on the edit button of properties box to create / edit a local formula
Step 3)
Some of the common operators used in BW include:
- Addition, Subtraction, Multiplication and Division
- NODIM is used to display key figures without their corresponding unit
- NOERR is used to display zero instead of error message (e.g. zero instead of mentioning that division by zero error)
- %GT is used to show the value of key figure as a percentage of total value
- In the “Detail View” box, enter the formula
- Use the operators from the “Operators” box.
Key Figures – Calculated Key Figure:
If same calculation is required for multiple reports, it can be mapped to the InfoProvider instead of creating it individually in each query. Such key figure is called “Calculated Key Figure” or CKF.
Once defined, it can be dragged into a query like any other key figure. The biggest advantage of this approach is that it facilitates global definitions of common calculated KPIs.
Steps to create a Calculated Key Figure:
- Navigate to the Infoprovider section
- Right Click on Key Figures folder.
- Choose the option “New Calculated Key Figure”.
Key Figures – Restricted Key Figure:
Restricted Key Figures (RKF) can be used to selectively apply filters only to a specific KPI in the report, but not to the entire report e.g. split sales into columns like YTD (Year To Date) Sales, PYTD (Previous Year To Date) Sales, etc.
Step 1)
- Navigate to the Infoprovider section
- Right Click on Key Figures folder.
- Choose the option “New Restricted Key Figure”.
Step 2)
Click on the edit button of properties box to create / edit a RKF
Step 3)
In the subsequent screen, at least one key figure and one characteristic must be entered to make a meaningful RKF.
- Key Figure which is to be restricted.
- The characteristic may be restricted by a selection screen variable to make it “Dynamic” RKF.
- It may also be restricted by a constant e.g. year = 2008. In the below screen shot, version is restricted with constant value “1”.
Like CKF, RKFs are also global to the InfoProvider and can be reused in multiple queries using the same InfoProvider.
Top 40 SAP BW / BI Interview Questions & Answers
1) What is SAP BW/BI? What is the purpose of SAP BW/BI?
SAP BW/BI stands for Business Information Warehouse, also known as business intelligence. For any business, data reporting, analyses and interpretation of business data is very crucial for running business smoothly and making decision. SAP BW/BI manage the data and enables to react quickly and in line with the market. It enables the user to analyze data from operative SAP applications as well as from other business.
2) In SAP BW/BI what are the main areas and activities?
a) Data Warehouse: Integrating, collecting and managing entire company's data.
b) Analyzing and Planning: Using the data stored in data warehouse
c) Reporting: BI provides the tools for reporting in web-browser, Excel etc.
d) Broad cast publishing: To send the information to the employees using email, fax etc.
e) Performance: Performance of the company
f) Security: Securing the access like using SAP logon tickets from portal
3) What is data Integrity?
Data integrity is to eliminate duplicate entries in the database.
4) What is table partition?
Table partition is done to manage the huge data to improve the efficiency of the applications. The partition is based on 0CALMONTH and 0FISCPER. There are two type of partitioning that is done
a) Database partitioning
b) Logical partitioning
5) What is data flow in BW/BI?
Data flows from a transactional system to the analytical system (BW). DS ( Data Service) on the transactional system needs to be replicated on BW side and attached to infosource and update rules respectively.
6) What is ODS (Operational Data Store)?
'Operational Data Store' or 'ODS' is used for detailed storage of data. It is a BW architectural component that appears between PSA ( Persistent Staging Area) and infocubes, it allows BEX (Business Explorer) reporting. It is primarily used for detail reporting rather than dimensional analysis, and it is not based on the star schema. ODS (Operational Data Store) objects do not aggregate data as infocubes do. To load the data into an IDS object, new records are inserted, existing records are updated, or old records are deleted as specified by RECORDMODE value.
7) What is an 'Infocube'?
8) How many tables does info cube contain?
Info cubes contain two tables, Fact table and Dimensions table.
9) Mention what are the maximum number of dimensions in info cubes?
In info cubes, there are 16 dimensions ( 3 sap defined and 1 customer defined)
10) What is the difference between ODS and Info-cubes?
The difference between ODS and Info-cubes are
a) ODS has a key while Info-cubes does not have any key
b) ODS contains detailed level data while Info-cube contains refined data
c) Info-cube follows Star Schema (16 dimensions) while ODS is a flat file structure
d) There can be two or more ODS under a cube, so cube can contain combined data or data that is derived from other fields in the ODS
11) What is the dimension in BW? How would you optimize the dimensions?
A dimension in BW is a collection of reference information about a measurable event in data warehousing. In this context, events are known as "facts". For example, a customer dimension's attributes could include first and last name, gender, birth date etc. To optimize the dimensions, do not add most dynamic characteristics into the same dimension and make the dimension smaller. Also, define as many dimensions as possible, and the dimension should not exceed 20% of the fact table size.
12) What are info objects?
Characteristics and key figures will be called as info objects. 'Info-objects' are similar to fields of the source system, data based on which we organize data in different info provider in BW.
13) What is modelling?
Designing of data base is done by using modelling. The design of DB (Data Base) depends on the schema, and schema is defined as the representation of tables and their relationship.
14) What is extended star schema?
Star Schema comprises of Fact tables and Dimension Tables, while the table that consists the Master data are kept in separate tables. These separate tables for Master data are referred as Extended Star Schema.
15) What are the extractors and mention their types?
To extract data from the system program is used which is known as Extractor. The types of extractors in BW are:
a) Application Specific: BW content FI, HR, CO, SAP CRM, LO cockpit
b) Customer-Generated Extractors: LIS, FI-SL, CO-PA
c) Cross Application (Generic Extractors) : DB View,Infoset, Function Module
16) What is a 'Fact Table'?
Fact table is the collection of facts and relations that mean foreign keys with the dimension. Actually fact table holds transactional data.
17) What are the data types for the characteristics info object?
There are 4 types
a) CHAR
b) NUMC
c) DATS
d) TIMS
18) What is the use of the process chain?
The use of the process chain is to automate the data load process. It automates the process like Data load, Indices creation, Deletion, Cube compression etc. Process chains are only to load your data's.
19) What are the transaction codes or T-codes for Info-objects?
The T-codes for Info-Cubes are
a) LISTCUBE: List viewer for InfoCubes
b) LISTSCHEMA: Show InfoCube schema


