Users Online
· Guests Online: 23
· Members Online: 0
· Total Members: 188
· Newest Member: meenachowdary055
· Members Online: 0
· Total Members: 188
· Newest Member: meenachowdary055
Forum Threads
Newest Threads
No Threads created
Hottest Threads
No Threads created
Latest Articles
Articles Hierarchy
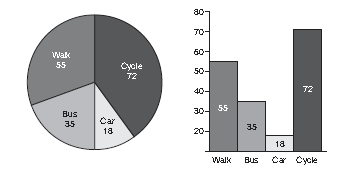
Data set 2: Means of travel to work
The findings of a survey into how people travel to work (presented
as both a bar and a pie chart) are shown below.

Note:
1 in 8 of the people who cycled to work were found to be over 65 years of age.
1 in 3 of the cyclists stated that they travelled to work by bus on rainy days.
11. How many more respondents indicated that they walked to work rather than travelled by bus?
A 55
B 35
C 20
D 18
Answer ( )
12. How many more people indicated that they cycled to work compared with those who travelled by either bus or car?
A 72
B 35
C 18
D 19
Answer ( )
13. What is the total number of responses represented in the survey?
A 180
B 170
C 160
D 150
Answer ( )
14. The sum of which categories, if any, represents half the number of responses represented in the survey?
A Cycle and car
B Bus and car
C Walk and bus
D Walk and cycle
Answer ( )
15. How many degrees of arc in the pie chart represent each response in the survey results?
A 8°
B 6°
C 4°
D 2°
Answer ( )
16. Which of the following best represents the ratio of responses between car and cycle?
A 1:6
B 1:5
C 1:4
D 1:3
Answer ( )
17. What fraction most closely represents the segment of the pie labelled bus?
A 1/2
B 1/4
C 1/5
D 1/6
Answer ( )
18. Which of the following statements is true?
A Slightly fewer than twice as many people indicated that they travelled to work by bus than by car.
B Slightly more than twice as many people indicated that they travelled to work by bus than by car.
C Slightly more people indicated that they travelled to work by bus than by car.
D Slightly fewer people indicated that they travelled to work by car than by bus.
Answer ( )
19. How many respondents indicated that they cycled to work and were over 65 years old?
A 12
B 9
C 8
D Cannot tell
Answer ( )
20. How many people cycled on a rainy day?
A 24
B 48
C 72
D Cannot tell
Answer ( )
as both a bar and a pie chart) are shown below.

Note:
1 in 8 of the people who cycled to work were found to be over 65 years of age.
1 in 3 of the cyclists stated that they travelled to work by bus on rainy days.
11. How many more respondents indicated that they walked to work rather than travelled by bus?
A 55
B 35
C 20
D 18
Answer ( )
12. How many more people indicated that they cycled to work compared with those who travelled by either bus or car?
A 72
B 35
C 18
D 19
Answer ( )
13. What is the total number of responses represented in the survey?
A 180
B 170
C 160
D 150
Answer ( )
14. The sum of which categories, if any, represents half the number of responses represented in the survey?
A Cycle and car
B Bus and car
C Walk and bus
D Walk and cycle
Answer ( )
15. How many degrees of arc in the pie chart represent each response in the survey results?
A 8°
B 6°
C 4°
D 2°
Answer ( )
16. Which of the following best represents the ratio of responses between car and cycle?
A 1:6
B 1:5
C 1:4
D 1:3
Answer ( )
17. What fraction most closely represents the segment of the pie labelled bus?
A 1/2
B 1/4
C 1/5
D 1/6
Answer ( )
18. Which of the following statements is true?
A Slightly fewer than twice as many people indicated that they travelled to work by bus than by car.
B Slightly more than twice as many people indicated that they travelled to work by bus than by car.
C Slightly more people indicated that they travelled to work by bus than by car.
D Slightly fewer people indicated that they travelled to work by car than by bus.
Answer ( )
19. How many respondents indicated that they cycled to work and were over 65 years old?
A 12
B 9
C 8
D Cannot tell
Answer ( )
20. How many people cycled on a rainy day?
A 24
B 48
C 72
D Cannot tell
Answer ( )
Page 1 of 2: 12
Comments
No Comments have been Posted.
Post Comment
Please Login to Post a Comment.

