
Users Online
· Members Online: 0
· Total Members: 188
· Newest Member: meenachowdary055
Forum Threads
Latest Articles
Articles Hierarchy
#02_14 Solar Panel Voltage Logging with NearBus Cloud Connector and Xively
Solar Panel Voltage Logging with NearBus Cloud Connector and Xively
Do you want to synchronize your Arduino board memory with cloud memory? Then this is the solution for memory mapping between Arduino and cloud. The memory mapping is done by mirroring or replicating a small part of Arduino's memory into the cloud's memory. So, reading or writing on the cloud's memory will have the same effect as reading or writing directly into the Arduino's memory.
The objective of this project is to log the voltage values generated by a solar cell against the time.
In this chapter, you will learn:
-
About NearBus Cloud connector
-
How to wire a solar cell with Arduino, and the use of the voltage divider
-
How to install and use NearAgent with Arduino
-
How to configure Xively with Arduino Ethernet
-
How to combine NearBus with Xively
-
How to display real time voltage logging with Xively
-
How to write a simple HTML web page to display real time voltage logging that can be run on your mobile phone
Connecting a solar cell with the Arduino Ethernet board
We will use the following hardware to build the circuit:
-
Arduino Ethernet board (https://www.sparkfun.com/products/11229) or Arduino UNO (https://www.sparkfun.com/products/11021), with Arduino Ethernet Shield (https://www.adafruit.com/products/201)
-
A solar cell (https://www.sparkfun.com/products/7840)
-
Two resistors (resistor values should be calculated on the open voltage of the solar cell); take a look at the Building a voltage divider section that follows for the calculation of values and color codes
-
Some hook-up wires
-
A 9V DC 650mA wall adapter power supply (https://www.sparkfun.com/products/10273)
-
DC barrel jack adapter (https://www.sparkfun.com/products/10811)
-
An Ethernet cable (https://www.sparkfun.com/products/8915)
Also, you will need a computer with an Arduino IDE installed.
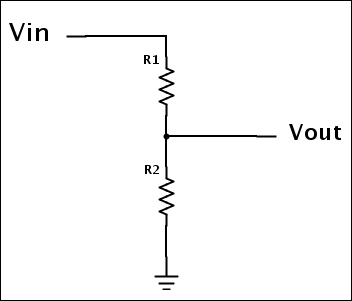
Building a voltage divider
A voltage divider is a simple circuit that can be used to turn higher voltage into lower voltage through a series of two resistors. The resistor values depend on the input voltage and the mapped output voltage:
For this project, we are using Sparkfun Solar Cell Large—2.5W (PRT07840). The open voltage of this solar cell is 9.15V (take a look at the datasheet for open voltage specification).
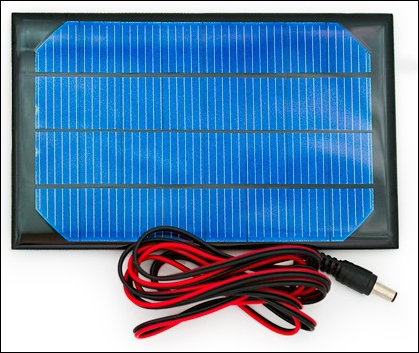
SparkFun Solar Cell Large - 2.5W Image courtesy of SparkFun Electronics (https://www.sparkfun.com)
So, we can calculate the resistor values for the voltage divider by using the following equation:
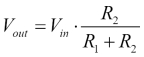
-
Vout is 5V (the input voltage to Arduino)
-
Vin is 9.15V (the output voltage from the solar cell)
Therefore, the following can be derived:
-
R1 = 1200 Ohm = 1.2k (brown, red, red)
-
R2 = 1500 Ohm = 1.5k (brown, green, red)
Building the circuit with Arduino
The following Fritzing diagram shows how to connect the voltage divider and solar cell with the Arduino Ethernet board. Now, start building the circuit according to the following diagram and steps provided:
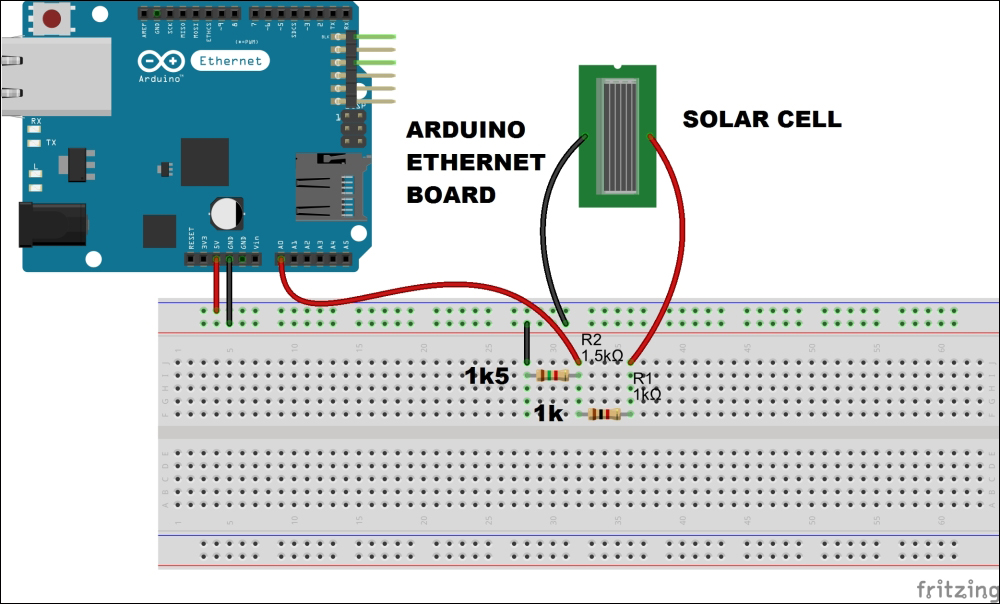
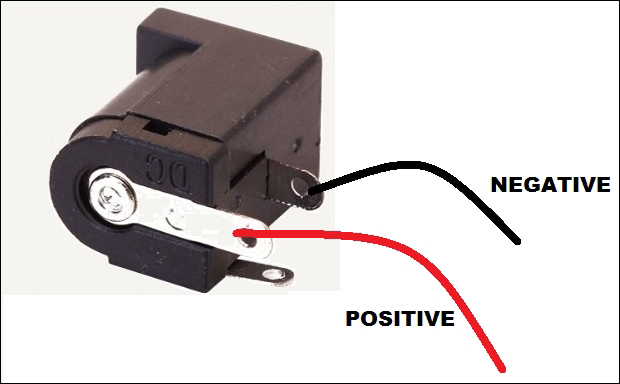
This particular solar cell comes with a DC barrel jack plug attached, and it is center positive. Plug it to the DC barrel jack adapter. Now solder two wires to the positive and negative terminals of the DC barrel jack adapter, as shown in the following image:
Connect the other wires as explained in the following steps:
-
Connect the voltage divider's output (Vout) with the Arduino analog pin 0 (A0).
-
Connect the solar cell's positive wire with voltage divider's Vin.
-
Connect the solar cell's negative wire to Arduino GND.
-
Connect the Arduino Ethernet board to a network switch or router using an Ethernet cable.
-
Power the Arduino Ethernet board using a 9V DC 650mA wall adapter power supply.
Now, the circuit and hardware setup is complete, and in the next section you will learn how to set up a NearBus account and connect your Arduino Ethernet shield to the NearBus Cloud for solar cell voltage logging.
Setting up a NearBus account
Setting up a NearBus account is simple. Visit the NearBus home page at http://www.nearbus.net/ and click on Sign Up in the main menu. This will navigate you to the new user signup page with a simple form to enter your registration information. Enter your information as described in following steps:
-
E-mail: Type a valid e-mail address.
-
User name: Type your preferred name for the NearBus account.
-
Password: Type a secret word and don't share it with others.
-
Then, click on the checkbox of the captcha section to verify that you are a human.
-
Finally, click on the Sign Up button.
Now you have successfully registered with the NearBus website and you will be navigated to the Login page. Now, enter the following information to log in.
-
Username: Type your user name.
-
Password: Type your password.
-
Click on the Login button.
Defining a new device
Now, you can define a new device with the NearBus cloud connector. In this chapter, we will work with the Arduino Ethernet board. If you have an Arduino Ethernet Shield, you can stack it with an Arduino board and test it with the samples provided in this chapter.
-
On the NearBus website menu bar, click on New Device. You will be navigated to the NEW DEVICE SETUP page.

-
You can enter a value for each parameter and the only mandatory field is SHARED SECRET. It is eight characters long. Other fields are optional.
|
DEVICE NAME (Maximum 18 characters) |
Arduino Ethernet |
|
LOCATION |
|
|
FUNCTION |
|
|
SHARED SECRET |
12345678 |
|
PIN |
|
|
CALLBACK SERVICE |
|
|
DEVICE IDENTIFIER |
|
|
DEFAULT REFRESH RATE [ms] |
|
-
Click on the Setup button.
Examining the device lists
After setting up the new device, you will navigate to the DEVICE LIST page. The NearBus system will assign a DEVICE ID to your new device and display your device name under the device alias. However, your new device will not have been mapped with NearBus. The mapped status shows as DOWN, which is highlighted in the following:
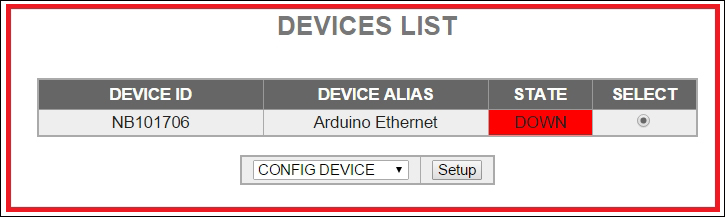
You will need this DEVICE ID when you write an Arduino sketch for this device.
Later, you can visit to the device list page by clicking on Device List on the menu bar.
Downloading the NearBus agent
To use your Arduino Ethernet Shield, or Arduino Ethernet board with the NearBus cloud connector, you must download and install the NearAgent code library. You can download the latest version of the NearBus library for Arduino at http://www.nearbus.net/v1/downloads.html. Also, you can visit the download page by clicking on Downloads on the NearBus web page menu bar. The following screenshot shows the Download page:

For this project, we need Arduino library for Ethernet, and the latest version is 16. Click on the NearBusEther_v16.zip link to download the library, or type http://www.nearbus.net/downloads/NearBusEther_v16.zip on your browser's address bar and hit Enter to download it on your computer's hard drive. Then, extract the downloaded ZIP file into the Arduino libraries folder.
Also, you need to download the FlexiTimer2 from http://github.com/wimleers/flexitimer2/zipball/v1.1 and extract the ZIP file into the Arduino libraries folder. You can read more about the FlexiTimer2 at https://github.com/wimleers/flexitimer2, which is the GitHub page, and you can even download it from there.

Perform the following steps to modify the sample code to read the voltage:
-
Open your Arduino IDE.
-
In the menu bar, click on File | Examples | NearBusEther_v16 | Hello_World_Ether. The sample code will load into the Arduino IDE. Also, you can copy and paste the sample sketch, B04844_05_01.ino, into your Arduino IDE which is located in the code folder of Chapter 5.
-
Save the sketch in another location by selecting File | Save As from the menu bar. Now, make the following modifications to the sample code to work with your Arduino Ethernet board or Ethernet Shield.
-
Modify the following code lines with your NearBus configuration's Device ID and Shared Secret. The Device ID can be found at the Device List page:
char deviceId [] = "NB101706"; // Put here the device_ID generated by the NearHub ( NB1xxxxx )
char sharedSecret[] = "12345678"; // (IMPORTANT: mandatory 8 characters/numbers) - The same as you configured in the NearHub
-
Replace the MAC address with your Arduino Ethernet board's MAC address:
byte mac[6] = { 0x90, 0xA2, 0xDA, 0x0D, 0xE2, 0xCD }; // Put here the Arduino's Ethernet MAC
-
Comment the following line:
//pinMode(3, OUTPUT);
-
Then, uncomment the following line:
///////////////////////////////////
// Example 1 - Analog Input
// Mode: TRNSP
///////////////////////////////////
A_register[0] = analogRead(0); // PIN A0
Remember, our solar panel is connected to the Arduino analog pin, 0 (A0). But you can attach it to another analog pin and make sure that the pin number is modified in the sketch.
-
That's all. Now, connect your Arduino Ethernet board with the computer using an FTDI cable.
-
Select the board type as Arduino Ethernet (Tools | Board | Arduino Ethernet), and select the correct COM port (Tools | Port).
-
Verify and upload the sketch into your Arduino Ethernet board.
-
Now, revisit the DEVICE LIST page. You can see the Device's STATE is changed to UP and highlighted:

Now, your Arduino Ethernet Shield's internal memory is correctly mapped with the NearBus cloud.
In the next section, we shall learn how to feed our solar panel voltage readings to the Xively and display the real time data on a graph.
Creating and configuring a Xively account
Xively (formerly known as Cosm and Pachube) is a cloud-based platform that provides remote access to devices like Arduino and many more. You can read condensed information about Xively by visiting https://en.wikipedia.org/wiki/Xively.
Using your web browser, visit http://xively.com/:
There is no link label to sign up in the web page, so type https://personal.xively.com/signup in your web browser's address bar and directly visit the Sign Up page.
After a successful sign up with Xively, you will get an e-mail with an activation link. Click on the activation link.
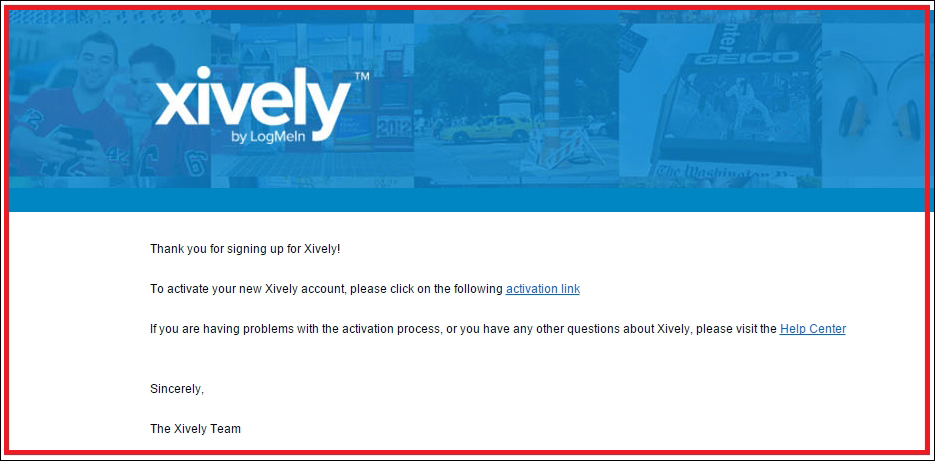
You will be redirected to the Welcome to Xively web page:
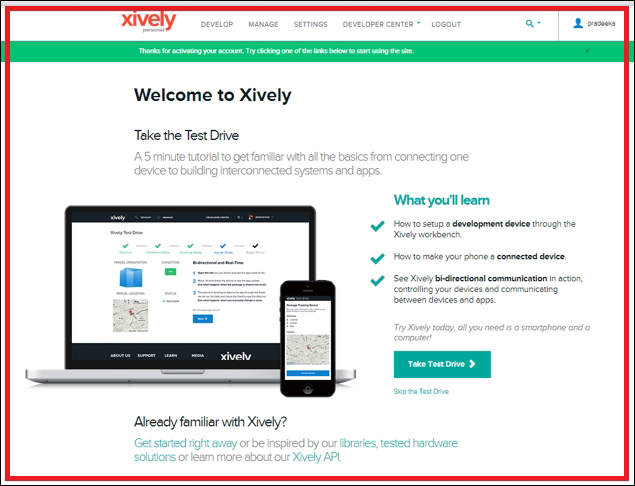
Click on DEVELOP from the top menu bar. The Development Devices page will appear:
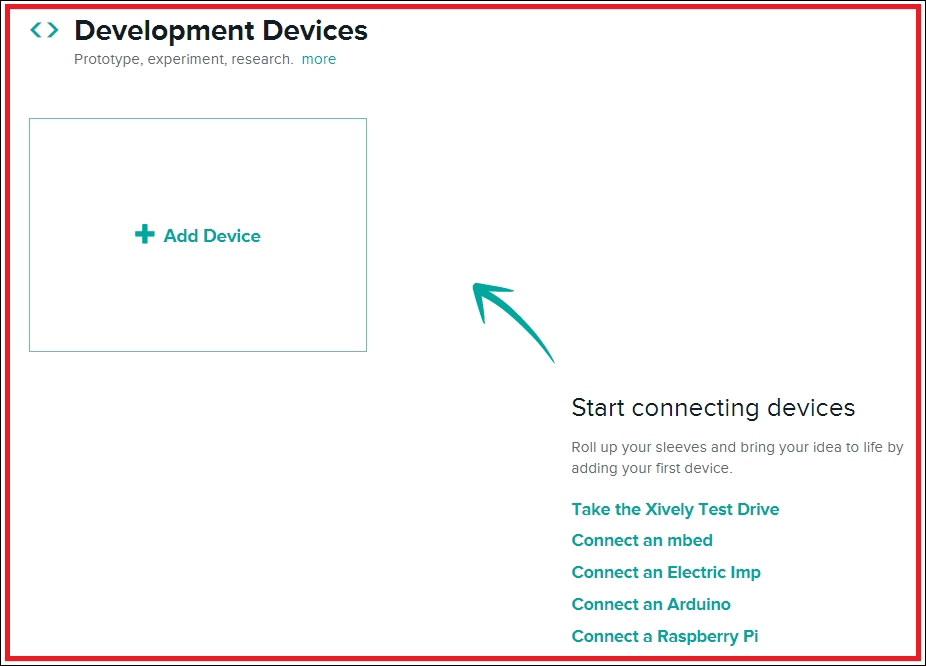
Click on +Add Device. The Add Device page will appear:
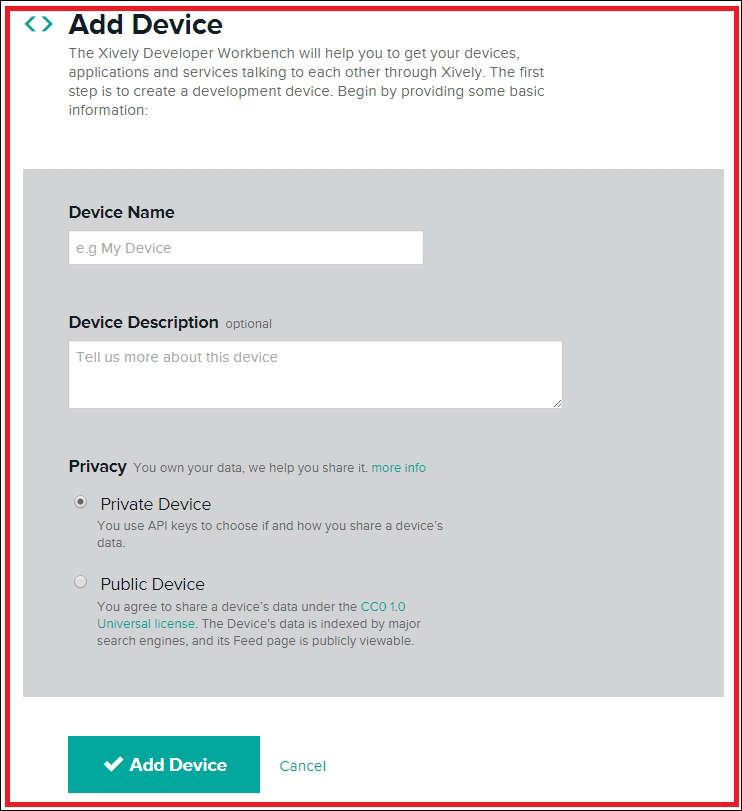
Fill the following textboxes with relevant information:
-
Device Name: Give a name for your device, for example, Voltage Logger.
-
Device Description: Give a brief description of your device, for example, Logging solar panel voltage.
-
Click on the Private Device option radio button.
-
Click on the Add Device button. The following web page will appear:
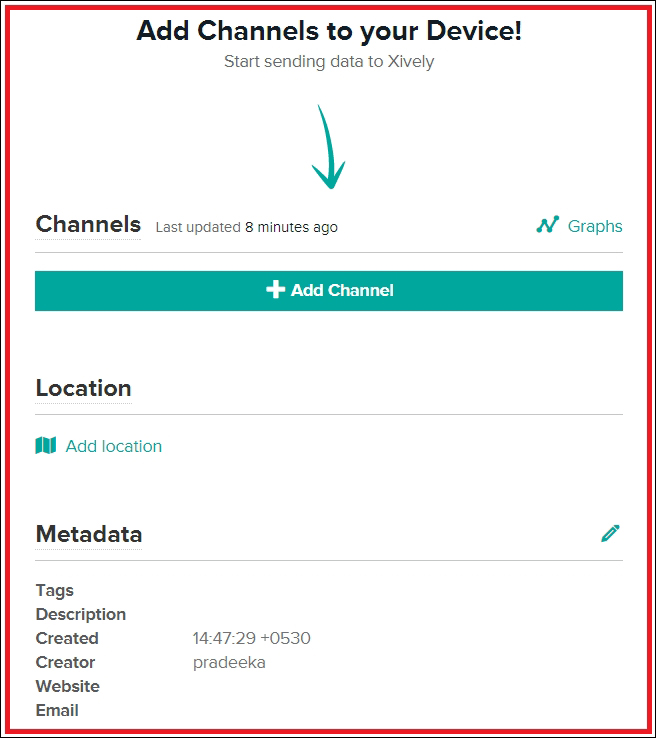
Click on the +Add Channel button:

To add a channel, follow these steps:
-
Fill in the following information:
-
-
Channel ID: 1 (but you can use any name, for example, sensor1 or logger1)
-
Units: Volts
-
Symbol: V
-
Current Value: Leave it blank or type 0
-
-
-
Click on the Save Channel button to save the channel.
-
On the right-hand side of the page, under API Keys, you can find out the Xively API Key and Feed ID for this device.

-
-
-
API Key: GE0sSoyHziZ3Pxxxxxxxxxxxxxxqb7adMUA5yaVUu5psjs
-
Feed ID: 1913539282
-
-
Configuring the NearBus connected device for Xively
Perform the following steps to configure the NearBus connected device for Xively:
-
Log in to your NearBus account.
-
Click on the DEVICE LIST menu. The DEVICE LIST page will appear:

-
From the drop-down menu, select COSM CONFIG.
-
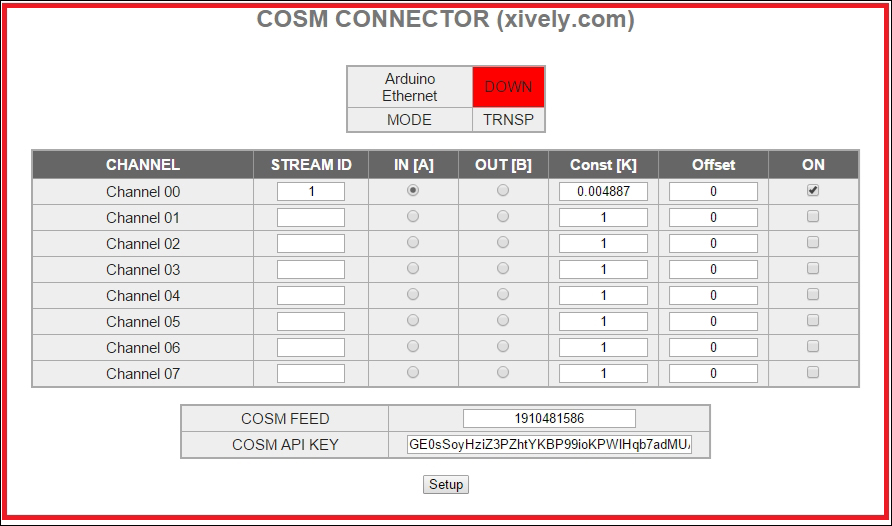
Click on the Setup button. The COSM CONNECTOR (xively.com) page will appear:
-
In this page, you have to enter some configuration settings in order to work your Arduino with NearBus and Xively. Here, we are using the NearBus channel 0 to communicate with our device. So, configure the following entries for the channel 0 entry using the CMOS CONNECTOR (xively.com) page:
-
-
STREAM ID: 1.
-
IN[A]: Click to enable.
-
Const[K]: 0.004887 (Arduino analog input can accept values from 0-1023, so we need to map the input voltage (in this case 5v) with it). Divide 5V by 1024, then you will get 0.0048828125. Copy and paste it to the Const[K] textbox.
-
Offset: 0.
-
ON: Click on the checkbox to check.
-
COSM FEED: Type the Feed ID generated by the Xively.
-
COSM API KEY: Type the API Key generated by the Xively.
-
-
-
Click on the Setup button.
-
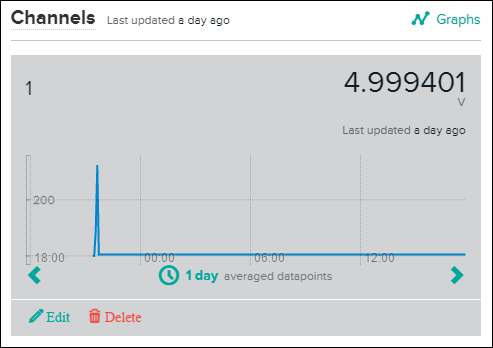
Now, switch to your Xively web page. On the left-hand side of the page, you can see a graph displaying your solar cell voltage with time. If you can't see the graph, click on the channel ID to expand the graph:
Developing a web page to display the real-time voltage values
Use the following chart to find the time zone for your device. The following two examples will show you how to find the correct time zone value:
-
Example 1: Let's assume your device is located in Sri Jayawardenepura, the time zone is 5.5, that is, UTC +05:30 (Chennai, Kolkata, Mumbai, New Delhi, Sri Jayawardenepura)
-
Example 2: If it is located in Newfoundland, the time zone is -3.5, that is, UTC -03:30 Newfoundland
|
Zone |
Place names |
|
UTC -11:00 |
International Date Line West, Midway Island, Samoa |
|
UTC -10:00 |
Hawaii |
|
UTC -09:00 |
Alaska |
|
UTC -08:00 |
Pacific Time (US & Canada), Tijuana |
|
UTC -07:00 |
Arizona, Chihuahua, Mazatlan, Mountain Time (US & Canada) |
|
UTC -06:00 |
Central America, Central Time (US & Canada), Guadalajara, Mexico City, Monterrey, Saskatchewan |
|
UTC -05:00 |
Bogota, Eastern Time (US & Canada, Indiana (East)), Lima, Quito |
|
UTC -04:30 |
Caracas |
|
UTC -04:00 |
Atlantic Time (Canada), La Paz, Santiago |
|
UTC -03:30 |
Newfoundland |
|
UTC -03:00 |
Brasilia, Buenos Aires, Georgetown, Greenland |
|
UTC -02:00 |
Mid-Atlantic |
|
UTC -01:00 |
Azores, Cape Verde Is. |
|
UTC +00:00 |
Casablanca, Dublin, Edinburgh, Lisbon, London, Monrovia |
|
UTC +01:00 |
Amsterdam, Belgrade, Berlin, Bern, Bratislava, Brussels, Budapest, Copenhagen, Ljubljana, Madrid, Paris, Prague, Rome, Sarajevo, Skopje, Stockholm, Vienna, Warsaw, West Central Africa, Zagreb |
|
UTC +02:00 |
Athens, Bucharest, Cairo, Harare, Helsinki, Istanbul, Jerusalem, Kyev, Minsk, Pretoria, Riga, Sofia, Tallinn, Vilnius |
|
UTC +03:00 |
Baghdad, Kuwait, Moscow, Nairobi, Riyadh, St. Petersburg, Volgograd |
|
UTC +03:30 |
Tehran |
|
UTC +04:00 |
Abu Dhabi, Baku, Muscat, Tbilisi, Yerevan |
|
UTC +04:30 |
Kabul |
|
UTC +05:00 |
Ekaterinburg, Islamabad, Karachi, Tashkent |
|
UTC +05:30 |
Chennai, Kolkata, Mumbai, New Delhi, Sri Jayawardenepura |
|
UTC +05:45 |
Kathmandu |
|
UTC +06:00 |
Almaty, Astana, Dhaka, Novosibirsk |
|
UTC +06:30 |
Rangoon |
|
UTC +07:00 |
Bangkok, Hanoi, Jakarta, Krasnoyarsk |
|
UTC +08:00 |
Beijing, Chongqing, Hong Kong, Irkutsk, Kuala Lumpur, Perth, Singapore, Taipei, Ulaan Bataar, Urumqi |
|
UTC +09:00 |
Osaka, Sapporo, Seoul, Tokyo, Yakutsk |
|
UTC +09:30 |
Adelaide, Darwin |
|
UTC +10:00 |
Brisbane, Canberra, Guam, Hobart, Melbourne, Port Moresby, Sydney, Vladivostok |
|
UTC +11:00 |
Magadan, New Caledonia, Solomon Is. |
|
UTC +12:00 |
Auckland, Fiji, Kamchatka, Marshall Is., Wellington |
|
UTC +13:00 |
Nuku'alofa |
Displaying data on a web page
Now, we will look at how to display the temperature data on a web page using HTML and JavaScript by connecting to the Xively cloud.
-
Copy the following index.html file from the code folder of Chapter 5 to your computer's hard drive.
-
Using a text editor (Notepad or Notepad++), open the file and edit the highlighted code snippets using your NearBus and Xively device configuration values. Modify the device ID, user, and password:
var device_id = "NB101706"; // Your device ID
var user = "****"; // Your NearBus Web user
var pass = "****"; // Your NearBus Web password
Following are the variables:
-
-
-
device_id: Your NearBus device ID
-
user: Your NearBus user name
-
pass: Your NearBus password
-
-
-
Replace 1 with your NearBus channel ID:
ret = NearAPIjs( "ADC_INPUT", device_id ,
1
, 0, "RONLY" );
-
Replace 1910481586 with your Xively device Feed ID, 1.png with your NearBus channel ID (only replace the number part) and 5.5 with your time zone.
<div id="div_temp_chart_cm"> <img src="https://api.cosm.com/v2/feeds/
1910481586
/datastreams/
1
.png?width=750&height=400&colour=%23f15a24&duration=3hours&show_axis_labels=true&detailed_grid=true&timezone=
5.5
" > </div>
You can also modify the cosm to Xively in the preceding URL because both are working. The modified URL can be written as follows:
<div id="div_temp_chart_cm"> <img src="https://api.
xively
.com/v2/feeds/
1910481586
/datastreams/
1
.png?width=750&height=400&colour=%23f15a24&duration=3hours&show_axis_labels=true&detailed_grid=true&timezone=
5.5
" > </div>
-
Now, save and close the file. Then, open the file using your preferred web browser. You will see a graph displaying the real-time voltage values against the time which is continuously updating.
-
Also, you can copy the file into your smart phone's SD card or its internal memory, and then open it with the mobile web browser to see the real time graph.
-
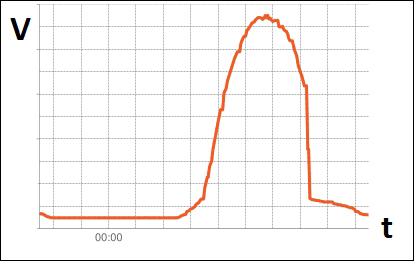
The following image shows a real time graph that is plotting the output voltage of a solar cell, where the x axis represents the time (t) and the y axis represents the voltage (V):
Summary
In this chapter, you have learned how to log your solar cell voltage using the NearBus and Xively cloud platforms and access them remotely from anywhere in the world using a mobile device. You can modify this project to log data from any type of sensor and also add more channels to display multiple data streams on a single graph.
