Data Science Dumps For EMC- E20-007
Posted by Superadmin on November 10 2018 00:08:12


Question ID 6258

You are using MADlib for Linear Regression analysis. Which value does the statement return? SELECT (linregr(depvar, indepvar)).r2 FROM zeta1;

Option A

Goodness of fit

Option B

Coefficients

Option C

Standard error

Option D

P-value

Correct Answer A

Description 
Update Date and Time 2017-04-28 06:18:11


Question ID 6259

Which data asset is an example of quasi-structured data?

Option A

Webserver log

Option B

XML data file

Option C

Database table

Option D

News article

Correct Answer A

Description 
Update Date and Time 2017-04-28 06:19:49


Question ID 6260

What would be considered "Big Data"?

Option A

An OLAP Cube containing customer demographic information about 100,000,000 customers 

Option B

Daily Log files from a web server that receives 100,000 hits per minute

Option C

Aggregated statistical data stored in a relational database table

Option D

Spreadsheets containing monthly sales data for a Global 100 corporation

Correct Answer B
Description 
Update Date and Time 2017-04-28 06:21:46


Question ID 6261

A data scientist plans to classify the sentiment polarity of 10, 000 product reviews collected from the Internet. What is the most appropriate model to use? Suppose labeled training data is available.

Option A

Naïve Bayesian classifier

Option B

Linear regression

Option C

Logistic regression

Option D

K-means clustering

Correct Answer A

Description 
Update Date and Time 2017-04-28 06:24:16


Question ID 6262

In which lifecycle stage are test and training data sets created?

Option A

Model building

Option B

Model planning

Option C

Discovery

Option D

Data preparation

Correct Answer A
Description 
Update Date and Time 2017-04-28 06:25:59


Question ID 6263

When creating a presentation for a technical audience, what is the main objective?

Option A

Show that you met the project goals

Option B

Show how you met the project goals

Option C

Show if the model will meet the SLA

Option D

Show the technique to be used in the production environment

Correct Answer B

Description 
Update Date and Time 2017-04-28 06:29:31


Question ID 6264

Your company has 3 different sales teams. Each team's sales manager has developed incentive offers to increase the size of each sales transaction. Any sales manager whose incentive program can be shown to increase the size of the average sales transaction will receive a bonus.

Data are available for the number and average sale amount for transactions offering one of the incentives as well as transactions offering no incentive.

The VP of Sales has asked you to determine analytically if any of the incentive programs has resulted in a demonstrable increase in the average sale amount. Which analytical technique would be appropriate in this situation?

Option A

One-way ANOVA

Option B

Multi-way ANOVA

Option C

Student's t-test

Option D

Wilcoxson Rank Sum Test

Correct Answer A
Description 
Update Date and Time 2017-04-28 06:31:04


Question ID 6265

In data visualization, what is used to focus the audience on a key part of a chart?

Option A

Emphasis colors

Option B

Detailed text

Option C

Pastel colors

Option D

A data table

Correct Answer A

Description 
Update Date and Time 2017-04-28 06:32:32


Question ID 6266

Which word or phrase completes the statement? Data-ink ratio is to data visualization as .

Option A

Confusion matrix is to classifier

Option B

Data scientist is to big data

Option C

Seasonality is to ARIMA

Option D

K-means is to Naive Bayes

Correct Answer A
Description 
Update Date and Time 2017-04-28 06:37:27


Question ID 6267

Consider a database with 4 transactions:

Transaction 1: {cheese, bread, milk}

Transaction 2: {soda, bread, milk}

Transaction 3: {cheese, bread}

Transaction 4: {cheese, soda, juice}

You decide to run the association rules algorithm where minimum support is 50%. Which rule has a confidence at least 50%?

Option A

{cheese} => {bread}

Option B

{juice} => {cheese}

Option C

{milk} => {soda}

Option D

{soda} => {milk}

Correct Answer A

Description 
Update Date and Time 2017-04-28 06:41:49


Question ID 6268

You are using the Apriori algorithm to determine the likelihood that a person who owns a home has a good credit score. You have determined that the confidence for the rules used in the algorithm is > 75%. You calculate lift = 1.011 for the rule, "People with good credit are homeowners". What can you determine from the lift calculation?

Option A

Support for the association is low

Option B

Leverage of the rules is low

Option C

The rule is coincidental

Option D

The rule is true

Correct Answer C

Description 
Update Date and Time 2017-04-28 06:45:45


Question ID 6269

Consider a database with 4 transactions:

Transaction 1: {cheese, bread, milk}

Transaction 2: {soda, bread, milk}

Transaction 3: {cheese, bread}

Transaction 4: {cheese, soda, juice}

The minimum support is 25%. Which rule has a confidence equal to 50%?

Option A

{bread,milk} => {cheese}

Option B

{bread} => {milk}

Option C

{juice} => {soda}

Option D

{bread} => {cheese}

Correct Answer D

Description 
Update Date and Time 2017-04-28 06:48:40


Question ID 6270

Under which circumstance do you need to implement N-fold cross-validation after creating a regression model?

Option A

There is not enough data to create a test set.

Option B

The data is unformatted.

Option C

There are missing values in the data.

Option D

There are categorical variables in the model.

Correct Answer A
Description 
Update Date and Time 2017-04-28 06:50:10


Question ID 6271

What is an appropriate data visualization to use in a presentation for an analyst audience? 

Option A

Pie chart

Option B

Area chart

Option C

Stacked bar chart

Option D

ROC curve

Correct Answer D

Description 
Update Date and Time 2017-04-28 06:52:03


Question ID 6272

When would you use GROUP BY ROLLUP clause in your OLAP query?

Option A

where all subtotals and grand totals are to be included in the output

Option B

where only the subtotals are to be included in the output

Option C

where only the grand totals are to be included in the output

Option D

where only specific subtotals and grand totals for a combination of variables are to be included in the output                                                       

Correct Answer A
Description 
Update Date and Time 2017-04-28 06:54:14


Question ID 6273

where only specific subtotals and grand totals for a combination of variables are to be included in the output

Option A

Probability

Option B

A p-value

Option C

Any integer

Option D

Any real number

Correct Answer A

Description 
Update Date and Time 2017-04-28 06:55:37


Question ID 6274

Your colleague, who is new to Hadoop, approaches you with a question. They want to know how best to access their data. This colleague has a strong background in data flow languages and programming.

Which query interface would you recommend?

Option A

Pig

Option B

Hive

Option C

Howl

Option D

HBase

Correct Answer A
Description 
Update Date and Time 2017-04-28 06:58:07


Question ID 6275

The web analytics team uses Hadoop to process access logs. They now want to correlate this data with structured user data residing in a production single-instance JDBC database. They collaborate with the production team to import the data into Hadoop. Which tool should they use?

Option A

Sqoop

Option B

Pig

Option C

Chukwa

Option D

Scribe

Correct Answer A

Description 
Update Date and Time 2017-04-28 06:59:19


Question ID 6276

What does the R code z <- f[1:10, ]

do?

Option A

Assigns the first 10 rows of f to the vector z

Option B

Assigns the 1st 10 columns of the 1st row of f to z

Option C

Assigns a sequence of values from 1 to 10 to z

Option D

Assigns the 1st 10 columns to z

Correct Answer A
Description 
Update Date and Time 2017-04-28 11:02:38


Question ID 6277

In R, functions like plot() and hist() are known as what?

Option A

generic functions

Option B

virtual methods

Option C

virtual functions

Option D

generic methods

Correct Answer B

Description 
Update Date and Time 2017-04-28 11:04:20


Question ID 6278

Review the following code:

SELECT pn, vn, sum(prc*qty) FROM sale

GROUP BY CUBE(pn, vn) ORDER BY 1, 2, 3;

Which combination of subtotals do you expect to be returned by the query?

Option A

(pn,vn)

Option B

( (pn,vn),(pn) )

Option C

( (pn,vn),(pn),(vn) )

Option D

( (pn,vn),(pn),(vn),( ) )

Correct Answer D
Description 
Update Date and Time 2017-04-28 11:05:47


Question ID 6279

In MADlib what does MAD stand for? 

Option A

Magnetic,Agile,Deep

Option B

Machine Learning,Algorithms for Databases

Option C

Mathematical Algorithms for Databases

Option D

Modular,Accurate,Dependable

Correct Answer C

Description 
Update Date and Time 2017-04-28 11:06:55


Question ID 6280

The web analytics team uses Hadoop to process access logs. They now want to correlate this data with structured user data residing in their massively parallel database. Which tool should they use to export the structured data from Hadoop?

Option A

Sqoop

Option B

PigPig

Option C

Chukwa

Option D

Scribe

Correct Answer A
Description 
Update Date and Time 2017-04-28 11:08:45


Question ID 6281

When would you prefer a Naive Bayes model to a logistic regression model for classification?

Option A

When you are using several categorical input variables with over 1000 possible values each .

Option B

When you need to estimate the probability of an outcome,not just which class it is in.

Option C

When all the input variables are numerical.

Option D

When some of the input variables might be correlated.

Correct Answer A

Description 
Update Date and Time 2017-04-28 11:09:59


Question ID 6282

Before you build an ARMA model, how can you tell if your time series is weakly stationary? 

Option A


There appears to be a constant variance around a constant mean.


Option B

The mean of the series is close to 0.

Option C

The series is normally distributed.

Option D

There appears to be no apparent trend component.

Correct Answer A
Description 
Update Date and Time 2017-04-28 11:12:03


Question ID 6283

What is an example of a null hypothesis?

Option A

that a newly created model does not provide better predictions than the currently existing model

Option B

that a newly created model provides a prediction of a null sample mean 

Option C

that a newly created model provides a prediction of a null population mean

Option D

that a newly created model provides a prediction that will be well fit to the null distribution

Correct Answer A

Description 
Update Date and Time 2017-04-28 11:13:30


Question ID 16112

If your intention is to show trends over time, which chart type is the most appropriate way to
depict the data?

Option A

 Line chart

Option B

Bar chart

Option C

Stacked bar chart

Option D

Histogram

Correct Answer A

Description 
Update Date and Time 2017-12-14 02:53:12


Question ID 16113

Refer to the exhibit.

The exhibit shows four graphs labeled as Fig A thorough Fig D. Which figure represents
the entropy function relative to a Boolean classification and is represented by the formula
shown in Exhibit?

Option A

 Fig-A

Option B

Fig-B

Option C

Fig-C

Option D

Fig-D

Correct Answer A

Description 
Update Date and Time 2017-12-14 02:55:51


Question ID 16114

Assume that you have a data frame in R. Which function would you use to display
descriptive statistics about this variable?

Option A

summary

Option B

str

Option C

attributes

Option D

levels

Correct Answer A

Description 
Update Date and Time 2017-12-14 02:56:23


Question ID 16115

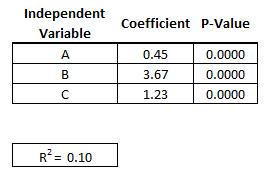
Refer to the exhibit.

You are asked to write a report on how specific variables impact your clients sales using a
data set provided to you by the client. The data includes 15 variables that the client views
as directly related to sales, and you are restricted to these variables only.
After a preliminary analysis of the data, the following findings were made:
1. Multicollinearity is not an issue among the variables
2. Only three variablesA, B, and Chave significant correlation with sales
You build a linear regression model on the dependent variable of sales with the
independent variables of A, B, and C. The results of the regression are seen in the exhibit.
Which interpretation is supported by the analysis?

Option A

 Variables A, B, and C are significantly impacting sales, but are not effectively estimating sales

Option B

Variables A, B, and C are significantly impacting sales and are effectively estimating sales

Option C

Due to the R2 of 0.10, the model is not valid the linear regression should be re-run with all 15 variables forced into the model to increase the R2

Option D

Due to the R2 of 0.10, the model is not valid a different analytical model should be attempted

Correct Answer A
Description 


Question ID 16116

The web analytics team uses Hadoop to process access logs. They now want to correlate
this data with structured user data residing in their massively parallel database. Which tool
should they use to export the structured data from Hadoop?

Option A

Sqoop

Option B

Pig

Option C

Chukwa

Option D

Scribe

Correct Answer A
Description 
Update Date and Time 2017-12-14 02:58:10


Question ID 16117

What is the output format from the Map function of MapReduce?

Option A

Key-value pairs

Option B

Binary representation of keys concatenated with structured data

Option C

Compressed index

Option D

Unique key record and separate records of all possible values

Correct Answer A

Description 
Update Date and Time 2017-12-14 03:11:00


Question ID 16118

What is the purpose of the process step "parsing" in text analysis?

Option A

imposes a structure on the unstructured/semi-structured text for downstream analysis

Option B

performs the search and/or retrieval in finding a specific topic or an entity in a document

Option C

executes the clustering and classification to organize the contents

Option D

computes the TF-IDF values for all keywords and indices

Correct Answer A
Description 
Update Date and Time 2017-12-14 03:11:45


Question ID 16119

A data scientist plans to classify the sentiment polarity of 10, 000 product reviews collected
from the Internet. What is the most appropriate model to use? Suppose labeled training
data is available.

Option A

Naïve Bayesian classifier

Option B

 Linear regression

Option C

Logistic regression

Option D

K-means clustering

Correct Answer A

Description 
Update Date and Time 2017-12-14 03:12:15


Question ID 16120

Your company has 3 different sales teams. Each team's sales manager has developed
incentive offers to increase the size of each sales transaction. Any sales manager whose
incentive program can be shown to increase the size of the average sales transaction will
receive a bonus.
Data are available for the number and average sale amount for transactions offering one of
the incentives as well as transactions offering no incentive.
The VP of Sales has asked you to determine analytically if any of the incentive programs
has resulted in a demonstrable increase in the average sale amount. Which analytical
technique would be appropriate in this situation?

Option A

One-way ANOVA

Option B

 Multi-way ANOVA

Option C

Student's t-test

Option D

Wilcoxson Rank Sum Test

Correct Answer A
Description 
Update Date and Time 2017-12-14 03:12:48


Question ID 16121

What describes the use of UNION clause in a SQL statement?

Option A

Operates on queries and potentially increases the number of rows

Option B

Operates on queries and potentially decreases the number of rows

Option C

Operates on tables and potentially decreases the number of columns

Option D

Operates on both tables and queries and potentially increases both the number of rows and columns

Correct Answer A

Description 
Update Date and Time 2017-12-14 03:13:22


Question ID 16122

The web analytics team uses Hadoop to process access logs. They now want to correlate
this data with structured user data residing in a production single-instance JDBC database.
They collaborate with the production team to import the data into Hadoop. Which tool
should they use?

Option A

Sqoop

Option B

Pig

Option C

Chukwa

Option D

Scribe


Correct Answer A
Description 
Update Date and Time 2017-12-14 03:14:26


Question ID 16123

You are performing a market basket analysis using the Apriori algorithm. Which measure is
a ratio describing the how many more times two items are present together than would be
expected if those two items are statistically independent?

Option A

Lift

Option B

Leverage

Option C

Support

Option D

Confidence

Correct Answer A

Description 
Update Date and Time 2017-12-14 03:24:27


Question ID 16124

Your organization has a website where visitors randomly receive one of two coupons. It is
also possible that visitors to the website will not receive a coupon. You have been asked to
determine if offering a coupon to visitors to your website has any impact on their purchase
decision.
Which analysis method should you use?

Option A

K-means clustering

Option B

Association rules

Option C

Student T-test

Option D

One-way ANOVA

Correct Answer D
Description 
Update Date and Time 2017-12-14 03:25:04


Question ID 16125

Which word or phrase completes the statement?
Theater actor is to "Artistic and Expressive" as Data Scientist is to ________________

Option A

 "Communicative and Collaborative"

Option B

"Introverted and Technical"

Option C

"Logical and Steadfast"

Option D

 "Independent and Intelligent"

Correct Answer A

Description 
Update Date and Time 2017-12-14 03:25:38


Question ID 16126

Which SQL OLAP extension provides all possible grouping combinations?

Option A

CUBE

Option B

ROLLUP

Option C

UNION ALL

Option D

CROSS JOIN

Correct Answer A
Description
Update Date and Time 2017-12-14 03:26:13


Question ID 16127

If R factors are categorical variables, which data classification level are they most closely
related?

Option A

 Nominal

Option B

 Ordinal

Option C

 Interval

Option D

Ratio

Correct Answer A
Description
Update Date and Time 2017-12-14 03:26:54


Question ID 16128

If R factors are categorical variables, which data classification level are they most closely
related?

Option A

 Nominal

Option B

 Ordinal

Option C

 Interval

Option D

Ratio

Correct Answer A
Description
Update Date and Time 2017-12-14 03:26:57


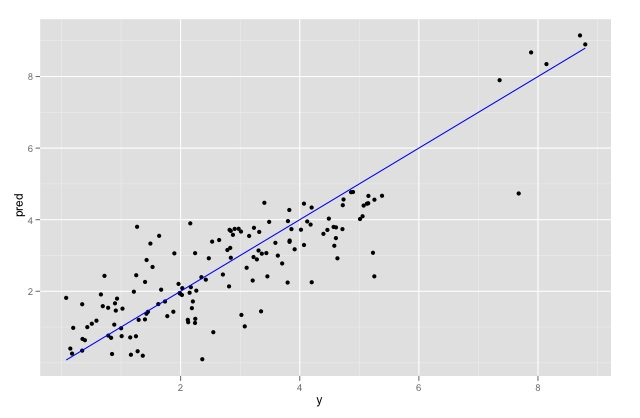
Question ID 16129

Refer to the exhibit.

You have run a linear regression model against your data, and have plotted true outcome
versus predicted outcome. The R-squared of your model is 0.75. What is your assessment
of the model?

Option A

The R-squared may be biased upwards by the extreme-valued outcomes. Remove them and refit to get a better idea of the model's quality over typical data.

Option B

The R-squared is good. The model should perform well.

Option C

The extreme-valued outliers may negatively affect the model's performance. Remove them to see if the R-squared improves over typical data.

Option D

The observations seem to come from two different populations, but this model fits them both equally well.

Correct Answer A

Description
Update Date and Time 2017-12-14 03:28:02


Question ID 16130

You are studying the behavior of a population and are provided with multi-dimensional data
at the individual level. You have identified four specific individuals who are valuable to your
study. You would like to find all users who are most similar to each individual.
Which algorithm is most appropriate for this study?

Option A

 K-means clustering

Option B

Linear regression

Option C

Association rules

Option D

Decision trees

Correct Answer A
Description
Update Date and Time 2017-12-14 03:28:35


Question ID 16131

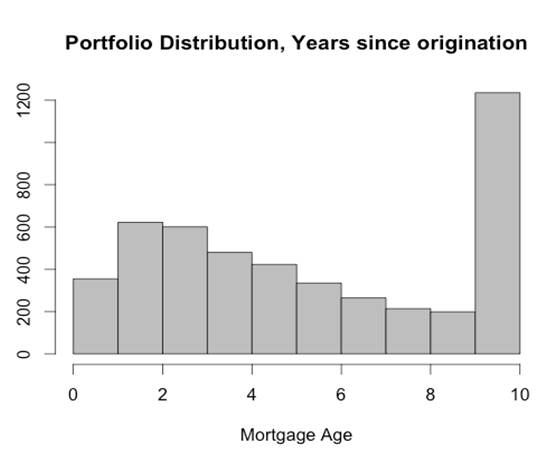
Refer to the exhibit.

Which type of data issue would you suspect based on the exhibit?

Option A

 "Saturated" data, indicating potential issues with data definitions

Option B

Incomplete data, indicating potential issues with data transmission

Option C

 Mis-scaled data, indicating potential issues with data entry

Option D

The exhibit does not raise any obvious concerns with the data.

Correct Answer A
Description
Update Date and Time 2017-12-14 03:29:33


Question ID 16132

Which word or phrase completes the statement? Business Intelligence is to monitoring
trends as Data Science is to ________ trends.

Option A

Predicting

Option B

 Discarding

Option C

Driving

Option D

Optimizing

Correct Answer A
Description
Update Date and Time 2017-12-14 03:30:03


Question ID 16133

The average purchase size from your online sales site is $17, 200. The customer
experience team believes a certain adjustment of the website will increase sales. A pilot
study on a few hundred customers showed an increase in average purchase size of $1.47,
with a significance level of p=0.1.
The team runs a larger study, of a few thousand customers. The second study shows an
increased average purchase size of $0.74, with a significance level of 0.03. What is your
assessment of this study?

Option A

The change in purchase size is not practically important, and the good p-value of the second study is probably a result of the large study size.

Option B

The change in purchase size is small, but may aggregate up to a large increase in profits over the entire customer base.

Option C

The difference in the change in purchase size between the two studies is troubling; The team should run another, larger study.

Option D

The p-value of the second study shows a statistically significant change in purchase size. The new website is an improvement.

Correct Answer A
Description
Update Date and Time 2017-12-14 03:37:42


Question ID 16134

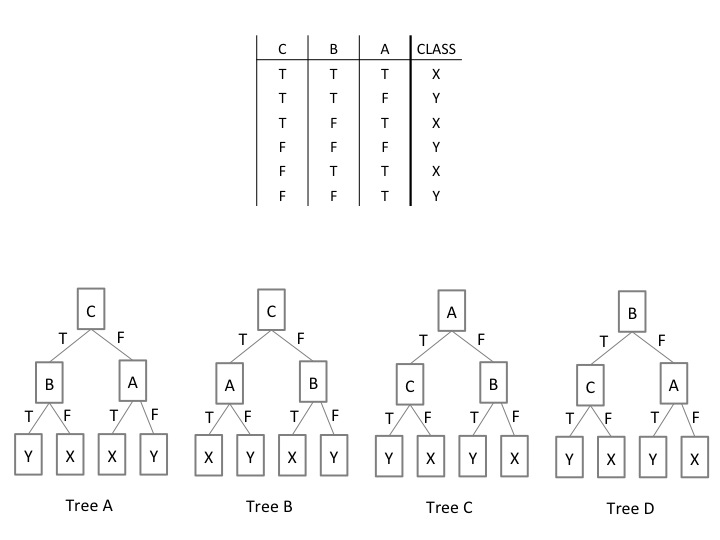
Refer to the Exhibit.

In the Exhibit, the table shows the values for the input Boolean attributes "A", "B", and "C".
It also shows the values for the output attribute "class". Which decision tree is valid for the
data?

Option A

Tree B

Option B

Tree A

Option C

Tree C

Option D

Tree D

Correct Answer A
Description
Update Date and Time 2017-12-14 04:06:38


Question ID 16135

What is the primary bottleneck in text classification?

Option A

The availablilty of tagged training data.

Option B

The ability to parse unstructured text data.

Option C

The high dimensionality of text data.

Option D

 The fact that text corpora are dynamic.

Correct Answer A
Description
Update Date and Time 2017-12-14 04:07:09


Question ID 16136

Data visualization is used in the final presentation of an analytics project. For what else is
this technique commonly used?

Option A

Data exploration

Option B

Descriptive statistics

Option C

ETLT

Option D

Model selection

Correct Answer A
Description
Update Date and Time 2017-12-14 04:07:38


Question ID 16137

A Data Scientist is assigned to build a model from a reporting data warehouse. The
warehouse contains data collected from many sources and transformed through a
complex, multi-stage ETL process. What is a concern the data scientist should have about
the data?

Option A

 It is too processed

Option B

 It is not structured

Option C

It is not normalized

Option D

It is too centralized

Correct Answer A
Description
Update Date and Time 2017-12-14 04:08:17


Question ID 16138

In which phase of the analytic lifecycle would you expect to spend most of the project time?

Option A

Discovery

Option B

Data preparation

Option C

Communicate Results

Option D

Operationalize

Correct Answer B
Description
Update Date and Time 2017-12-14 04:30:49


Question ID 16139

What is required in a presentation for project sponsors?

Option A

The "Big Picture" takeaways for executive level stakeholders

Option B

Data warehouse design changes

Option C

Line by line review of the developed code

Option D

Detailed statistical basis for the modeling approach used in the project

Correct Answer A
Description
Update Date and Time 2017-12-14 04:31:21


Question ID 16141

In which phase of the data analytics lifecycle do Data Scientists spend the most time in a
project?

Option A

Discovery

Option B

Data Preparation

Option C

Model Building

Option D

Communicate Results

Correct Answer B


Description
Update Date and Time 2017-12-14 04:31:32


Question ID 16141

In which phase of the data analytics lifecycle do Data Scientists spend the most time in a
project?

Option A

Discovery

Option B

Data Preparation

Option C

Model Building

Option D

Communicate Results

Correct Answer B
Description
Update Date and Time 2017-12-14 04:32:03


Question ID 16142

In linear regression, what indicates that an estimated coefficient is significantly different
than zero?

Option A

A small p-value

Option B

R-squared near 1

Option C

R-squared near 0

Option D

The estimated coefficient is greater than 3

Correct Answer A
Description
Update Date and Time 2017-12-14 04:32:37


Question ID 16143

A data scientist wants to predict the probability of death from heart disease based on three
risk factors: age, gender, and blood cholesterol level.
What is the most appropriate method for this project?

Option A

Logistic regression

Option B

Linear regression

Option C

K-means clustering

Option D

Apriori algorithm

Correct Answer A

Description
Update Date and Time 2017-12-14 04:33:09


Question ID 16144

What is a property of windows functions in SQL commands?

Option A

 Used to calculate moving averages over various intervals

Option B

Group rows into a single output row

Option C

Used between the keywords FROM and WHERE in a SELECT command

Option D

Ordering data within a window is not required

Correct Answer A
Description
Update Date and Time 2017-12-14 04:57:30


Question ID 16145

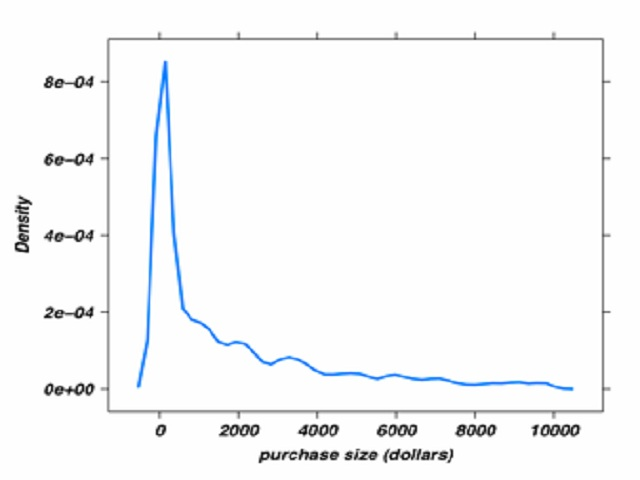
Refer to the exhibit.

You have created a density plot of purchase amounts from a retail website as shown. What
should you do next?

Option A

Recreate the plot using the barplot() function

Option B

Use the rug() function to add elements to the plot

Option C

Recreate the density plot using a log normal distribution of the purchase amount data

Option D

Reduce the sample size of the purchase amount data used to create the plot

Correct Answer C
Description
Update Date and Time 2017-12-14 04:58:40