Introduction to Performance Testing
Posted by Superadmin on March 03 2017 00:59:57
Why Performance testing?
Performance testing has proved itself to be crucial for the success of a business. Not only does a poor performing site face financial losses, it also could lead to legal repercussions at times.
No one wants to put up with a slow performing, unreliable site in cases of purchasing, online test taking, bill payment, etc. With the internet being so widely available, the alternates are immense. It is easier to lose clientele than gain them and performance is a key game changer.
Therefore, performance testing is no longer a name sake checkpoint before going live. It is indeed a comprehensive and detailed stage that would determine whether the performance of a site or an application meets the needs.
Introduction
The purpose of this test is to understand the performance of application under load, particularly users.

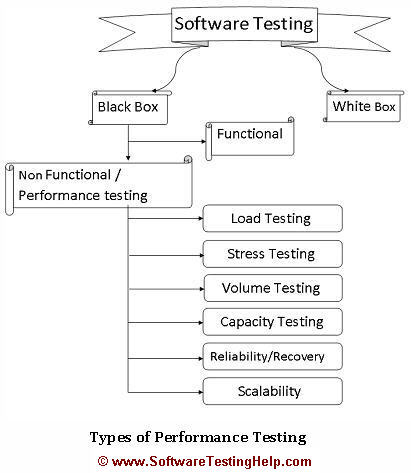
Load Testing
Load testing is a type of performance test where the application is tested for its performance on normal and peak usage. Performance of an application is checked with respect to its response to the user request, its ability to respond consistently within accepted tolerance on different user loads.
The key considerations are:
- What is the max load the application is able to hold before the application starts behaving unexpectedly?
- How much data the Database is able to handle before system slowness or the crash is observed?
- Are there any network related issues to be addressed?
Stress Testing
Stress testing is the test to find the ways to break the system. The test also gives the idea for the maximum load the system can hold.
Generally Stress testing has incremental approach where the load is increased gradually. The test is started with good load for which application has been already tested. Then slowly more load is added to stress the system and the point when we start seeing servers not responding to the requests is considered as a break point.
During this test all the functionality of the application are tested under heavy load and on back-end these functionality might be running complex queries, handling data, etc.
The following questions are to be addressed:
- What is the max load a system can sustain before it breaks down?
- How is the system break down?
- Is the system able to recover once it’s crashed?
- In how many ways system can break and which are the weak node while handling the unexpected load?
Volume Testing
Volume test is to verify the performance of the application is not affected by volume of data that is being handled by the application. Hence to execute Volume Test generally huge volume of data is entered into the database. This test can be incremental or steady test. In the incremental test volume of data is increased gradually.
Generally with the application usage, the database size grows and it is necessary to test the application against heavy Database. A good example of this could be a website of a new school or college having small data to store initially but after 5-10 years the data stores in database of website is much more.
The most common recommendation of this test is tuning of DB queries which access the Database for data. In some cases the response of DB queries is high for big database, so it needs to be rewritten in a different way or index, joints etc need to be included.
Capacity Testing
=> Is the application capable of meeting business volume under both normal and peak load conditions?
Capacity testing is generally done for future prospects. Capacity testing addresses the following:
- Will the application able to support the future load?
- Is the environment capable to stand for upcoming increased load?
- What are the additional resources required to make environment capable enough?
Capacity testing is used to determine how many users and/or transactions a given web application will support and still meet performance. During this testing resources such as processor capacity, network bandwidth, memory usage, disk capacity, etc. are considered and altered to meet the goal.
Online Banking is a perfect example of where capacity testing could play a major part.
Reliability/Recovery Testing
Reliability Testing or Recovery Testing – is to verify as to whether the application is able to return back to its normal state or not after a failure or abnormal behavior- and also how long does it take for it to do so(in other words, time estimation).
An online trading site if experience a failure where the users are not able to buy/sell shares at a certain point of the day (peak hours) but are able to do so after an hour or two. In this case, we can say the application is reliable or recovered from the abnormal behavior.
In addition to the above sub-forms of performance testing, there are some more fundamental ones that are prominent:
Smoke Test:
- How is the new version of the application performing when compared to previous ones?
- Is any performance degradation observed in any area in the new version?
- What should be the next area where developers should focus to address performance issues in the new version of application?
Component Test:
- Whether the component is responsible for the performance issue?
- Whether the component is doing what is expected and component optimization has been done?
Endurance Test:
- Whether the application will able to perform well enough over the period of time.
- Any potential reasons that could slow the system down?
- Third party tool and/or vendor integration and any possibility that the interaction makes the application slower.
How does Functional Testing differ from Performance Testing?

Identification of components for testing
In an ideal scenario, all components should be performance tested. However, due to time & other business constraints that may not be possible. Hence, the identification of components for testing happens to be one of the most important tasks in load testing.
The following components must be included in performance testing:
#1. Functional, business critical features
Components that have a Customer Service Level Agreement or those having complex business logic (and are critical for the business’s success) should be included.
Example: Checkout and Payment for an E-commerce site like eBay.
#2. Components that process high volumes of data
Components, especially background jobs are to be included for sure. Example: Upload and download feature on a file sharing website.
#3. Components which are commonly used
A component that is frequently used by end-users, jobs scheduled multiple times in a day, etc.
Example: Login and Logout.
#4. Components interfacing with one or more application systems
In a system involving multiple applications that interact with one another, all the interface components must be deemed as critical for performance test.
Example: E-commerce sites interface with online banking sites for payments, which is an external third party application. This should be definitely the part of Perf testing.
Tools for performance testing
Sure, you could have a million computers set up with a million different credentials and all of them could login at once and monitor the performance. Apparently it’s not practical and even if we do, do that, we still need some sort of monitoring infrastructure.
The best way this situation is handled is through – virtual user (VU). For all our tests the VU behave just the way a real user would.
For the creation of as many VUs as you would require and to simulate real time conditions, performance testing tools are employed. Not only that, Perf testing also tests for the peak load usage, breakdown point, long term usage, etc
To enable all with limited resources, fast and to obtain reliable results tools are often used for this process. There are a variety of tools available in the market- licensed, free wares and open sourced.
Few of the such tools are:
- HP LoadRunner,
- Jmeter,
- Silk Performer,
- NeoLoad,
- Web Load,
- Rational Performance Tester (RTP),
- VSTS,
- Loadstorm,
- Web Performance,
- LoadUI,
- Loadster,
- Load Impact,
- OpenSTA,
- QEngine,
- Cloud Test,
- Httperf,
- App Loader,
- Qtest,
- RTI,
- Apica LoadTest,
- Forecast,
- WAPT,
- Monitis,
- Keynote Test Perspective,
- Agile Load, etc.
The tool selection depends on budget, technology used, purpose of testing, nature of the applications, performance goals being validated, infrastructure, etc.
HP Load Runner captures majority of market due to:
- Versatility – can be used on windows as well as web based applications. It also works for many kinds of technologies.
- Test Results – It provides in-depth insights that can be used for tuning the application.
- Easy Integrations – works with diagnostics tool like HP Sitescope and HP Diagnostic.
- Analysis utility provides a variety of features which help in deep analysis.
- Robust Reports – LoadRunner has a good reporting engine and provides a variety of reporting formats.
- Comes with an Enterprise package too.
The only flip side is its license cost. It is a little bit on the expensive side – which is why other open source or affordably licensed tools that are specific to a technology, protocol and with limited analysis & reporting capabilities have emerged in the market.
Still, the HP LoadRunner is a clear winner.
Future in Performance Testing Career
Performance testing is easy to learn but need lots of dedication to master it. It’s like a mathematics subject where you have to build your concept. Once the concept is through, it can be applied to most of the tools irrespective of the scripting language being different, straight forward logic not being applicable, look and feel of the tool being different, etc. – the approach to Perf testing is almost always the same.
I would highly recommend this hot and booming technology and to enhance your skill by learning this. Mastering PT could be just what you are looking for to move ahead in your software testing career.
Load Runner is going to be our vehicle in the journey, but the destination we want to reach is to understand everything about performance testing.
Stay tuned!
How to Performance Test an Application – LoadRunner Training
Performance Testing Goals:
It is conducted to accomplish the following goals:
- Verify Application’s readiness to go live.
- Verify if the desired performance criteria are met
- Compare performance characteristics/configurations of the application to what is standard
- Identify Performance bottlenecks.
- Facilitate Performance Tuning.
How to Performance Test an Application – LoadRunner Training Tutorial Part 2
Posted In | Automation Testing, LoadRunner Tutorials, Software Testing Tools | Last Updated: "December 14, 2016"
This is the 2ndtutorial in our Performance testing with LoadRunner training series. With this, we are learning the exact performance test process so that we can easily get hold of the Load Testing with HP LoadRunner tutorials.
Check out the first tutorials in this series here: Performance Testing Introduction.
Performance Testing Goals:
It is conducted to accomplish the following goals:
- Verify Application’s readiness to go live.
- Verify if the desired performance criteria are met
- Compare performance characteristics/configurations of the application to what is standard
- Identify Performance bottlenecks.
- Facilitate Performance Tuning.
Key Activities in Performance Testing:

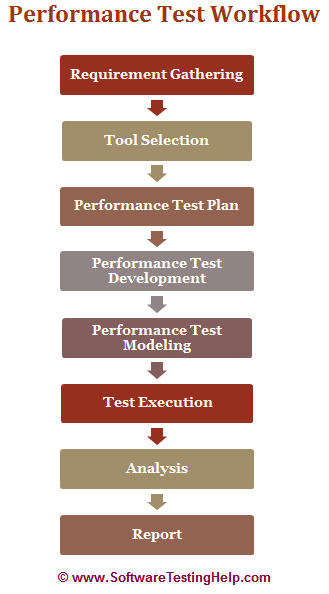
#1. Requirement Analysis/Gathering
Performance team interacts with the client for identification and gathering of requirement – technical and business. This includes getting information on application’s architecture, technologies and database used, intended users, functionality, application usage, test requirement, hardware & software requirements etc.
#2. POC/Tool selection
Once the key functionality are identified, POC (proof of concept – which is a sort of demonstration of the real time activity but in a limited sense) is done with the available tools. The list of available performance test tools depends on cost of tool, protocol that application is using, the technologies used to build the application, the number of users we are simulating for the test, etc. During POC, scripts are created for the identified key functionality and executed with 10-15 virtual users.
#3. Performance Test Plan & Design
Depending on the information collected in the preceding stages, test planning and designing is conducted.
Test Planning involves information on how the performance test is going to take place – test environment the application, workload, hardware, etc.
Test designing is mainly about the type of test to be conducted, metrics to be measured, Metadata, scripts, number of users and the execution plan.
During this activity, a Performance Test Plan is created. This serves as an agreement before moving ahead and also as a road map for the entire activity. Once created this document is shared to the client to establish transparency on the type of the application, test objectives, prerequisites, deliverable, entry and exit criteria, acceptance criteria etc.
Briefly, a performance test plan includes:
a) Introduction (Objective and Scope)
b) Application Overview
c) Performance (Objectives & Goals)
d) Test Approach (User Distribution, Test data requirements, Workload criteria, Entry & Exit criteria, Deliverable, etc.)
e) In-Scope and Out-of-Scope
f) Test Environment (Configuration, Tool, Hardware, Server Monitoring, Database, test configuration, etc.)
g) Reporting & Communication
h) Test Metrics
i) Role & Responsibilities
j) Risk & Mitigation
k) Configuration Management
#4. Performance Test Development
- Use cases are created for the functionality identified in the test plan as the scope of PT.
- These use cases are shared with the client for their approval. This is to make sure the script will be recorded with correct steps.
- Once approved, script development starts with a recording of the steps in use cases with the performance test tool selected during the POC (Proof of Concepts) and enhanced by performing Correlation (for handling dynamic value), Parameterization (value substitution) and custom functions as per the situation or need. More on these techniques in our video tutorials.
- The Scripts are then validated against different users.
- Parallel to script creation, performance team also keeps working on setting up of the test environment (Software and hardware).
- Performance team will also take care of Metadata (back-end) through scripts if this activity is not taken up by the client.
#5. Performance Test Modeling
Performance Load Model is created for the test execution. The main aim of this step is to validate whether the given Performance metrics (provided by clients) are achieved during the test or not. There are different approaches to create a Load model. “Little’s Law” is used in most cases.
#6. Test Execution
The scenario is designed according to the Load Model in Controller or Performance Center but the initial tests are not executed with maximum users that are in the Load model.
Test execution is done incrementally. For example: If the maximum number of users are 100, the scenarios is first run with 10, 25, 50 users and so on, eventually moving on to 100 users.
#7. Test Results Analysis
Test results are the most important deliverable for the performance tester. This is where we can prove the ROI (Return on Investment) and productivity that a performance testing effort can provide.

Some of the best practices that help the result analysis process:
a) A unique and meaningful name to every test result – this helps in understanding the purpose of the test
b) Include the following information in the test result summary:
- Reason for the failure/s
- Change in the performance of the application compared to the previous test run
- Changes made in the test from the point of application build or test environment.
- It’s a good practice to make a result summary after each test run so that analysis results are not compiled every time test results are referred.
- PT generally requires many test runs to reach at the correct conclusion.
- It is good to have the following points in result summary:
- Purpose of test
- Number of virtual users
- Scenario summary
- Duration of test
- Throughput
- Graphs
- Graphs comparison
- Response Time
- Error occurred
- Recommendations
There might be recommendations like configuration changes for the next test. Server logs also help in identifying the root cause of the problem (like bottlenecks) – Deep Diagnostic tools are used for this purpose.
In the final report, all the test summaries are consolidated.
#8. Report
Test results should be simplified so the conclusion is clearer and should not need any derivation. Development Team needs more information on analysis, comparison of results, and details of how the results were obtained.
Test report is considered to be good if it is brief, descriptive and to the point.
The following guidelines will smooth this step out:
- Use appropriate heading and summary
- Report should be presentable so that it can be used in the management meetings.
- Provide supporting data to support the results.
- Give meaningful names to the table headers.
- Share the status report periodically, even with the clients
- Report the issues with as much information and evidence as possible in order to avoid unnecessary correspondence
The final report to be shared with the client has the following information:
- Execution Summary
- System Under test
- Testing Strategy
- Summary of test
- Results Strategy
- Problem Identified
- Recommendations
Along with the final report, all the deliverable as per test plan should be shared with the client.
Performance Testing with LoadRunner Tutorial Summary
This is the first Performance testing introduction tutorial. By explaining Manual Performance Testing, we explained why it is difficult to do that. Discussed more on need of Automated Performance Testing.
The basic flow of Automated Performance Testing is explained below. This process is followed by almost all tools.
We are using HP LoadRunner load testing tool as it is widely used most powerful tool. For better understanding, we’ve explained how LoadRunner works with practical examples.
Following basic terminologies that are used in Performance testing are discussed in detail:
- Business Process
- Action, Scenario
- Transaction
- Virtual User (Vuser)
- Rendezvous point
- Check point.
It is important to know these as we will be using these most commonly.
Major components of LoadRunner
- Vugen
- Controller
- Load Generator
- Analysis
For performance testing, we are going to use these components.
Finally, we discussed the process that we need to follow for successful performance testing. This includes end to end performance testing.
VUGen Recording Options part I
Vugen Recording Options – Part I Tutorial Summary
This tutorial covers the Vugen Recording Options. Apart from this, it also covers:
- Script Section
- New Virtual User dialog
- Start Recording dialog
In Script Section, we discussed three sections of the script (vuser_init, Action, vuser_end) and running sequence.
On New Virtual User Dialog, we try to touch base with all the fields and their importance so that while selecting the protocol for scripting, user should know its significance. This is the first step for script creation. VuGen provides option to create Single Protocol and Multiple Protocol script.
On Start Recording Dialog, we discussed the fields with their valid input data. This is second step for script creation. From this dialog type of application, browser, URL, working directory, and “Record into Action” options are selected.
In Recording Option, we covered the following topics in detail:
- Scripts
- Protocol
- Recording
- Port Mapping
- Advanced Settings
- Correlation
- Code Generation
Script – This provides option to select the scripting language along with few settings related to the script. For Web (HTTP/HTML) protocol, the scripting language is C.
Protocol – This displays the protocol that we selected on New Virtual User Dialog box.
In the part-1, we have seen script sections and different dialogs. For Recording options, we have seen how to select scripting language and confirm the protocol that is going to be used while scripting.
VUGen Recording Options part II
Vugen Recording Options Part II Tutorial Summary
This tutorial covers the remaining Recording options. In part-1 we have seen Script and Protocol. The other options are:
- Recording – Selection of mode or http/html level can be done from this. We discussed in detail URL and HTMl mode of web (HTTP/HTML) protocol, which gives good understanding and idea about the major difference between them.
- Port Mapping– This provides option for Port Mapping.
- Advanced Settings– This covers few advanced settings related to script generation or script execution. We discussed each option available in detail.
- Correlation– This is related to Automated Correlation. Correlation rules are created and enabled from this. In short, we discussed the fields available for the users on this dialog.
- Code Generation– This enhance the data format capabilities of web protocol.
The part I and II tutorials explain all important fields on different dialog boxes related to recording options and protocol selection which user should know before using LoadRunner. This will make you ready for recording a script with all the required information for VuGen configuration.
VUGen Script Recording
Vugen Script Recording Tutorial Summary
This tutorial provides details of Vugen script recording.
- Protocol is the pre-requisite of script creation.
- Protocol Advisor is used to find the protocol that the application is using.
- Protocol Advisor is beneficial to performance testers by making the process of script creation faster and more focused. The tutorial covers how to use Protocol Advisor to find the protocol and jump to the scripting from there.
- We also discussed transaction and its significance, functions used to create a transaction and how to capture response time of a request through them.
- Transactions are created to capture request of each action going to the server during script recording.
- A verification point in the form of text check is inserted before closing the transaction to confirm that the server is responding with the correct response. In case response is not as expected, the text check will fail, and that will fail the transaction also.
- The sample application that comes along with Vugen is used for demoing – Protocol Advisor and script recording through Vugen.
- For scripting modular approach is taken as it gives more control over the script.
- During recording elements of the floating recording toolbar is discussed and used while recording.
After going through this tutorial, viewers will be able to have an exact idea what is required to start recording a script and how that can be achieved.
VUGen Runtime Settings
VuGen Runtime Settings Tutorial Summary
#1. Vugen runtime setting – allows Vugen with different settings which works on script execution.
#2. These helps testers in many ways:
- To emulate real user.
- Allow to get detailed information for the virtual user.
- Retrieve Performance stats for the graph.
- Automatic transaction
- Error handling
#3. Run Logic – using this the performance tester can play around with the sequence of running actions.
#4. Run Logic also has the option to have Block for looping and Properties which allow running the actins sequentially or randomly.
#5. Using pacing, script can be allowed to wait between the iteration.
#6. Log stores record of user activities. The tester has good control when and what to store. The tester can instruct Vugen how much information to store and situation when logging starts.
#7. Think Time helps in adding wait time in the script for the user`s wait time between the action on application. It helps the tester to get real actions from a virtual user.
#8. Using Additional Attributes, the tester can add a parameter to the script and has the flexibility to change the value for that through run time settings. These parameters are same as declared parameter within the script.
#9. Using miscellaneous options, the tester can configure settings related to Error Handling, Multithreading and Automatic Transaction.
#10. Configuration related to bandwidth can be done through Speed Simulation. Bandwidth can be either maximum or with limitations.
#11. Browser selection can be done through Browser Emulation. There are few setting of the browser which can affect the Performance of an application.
#12. Vugen also provides flexibility to use Proxy setting. Through the Proxy setting, custom proxy server can be set.
#13. Preference deals with the checkpoint, Performance graph and advanced setting.
#14. Using Download filter, unwanted request coming from any server or with a url can be blocked.
#15. Content Check is helpful in finding know errors anywhere in the script while execution.
Parameterization in LoadRunner
VuGen Parameterization Tutorial Summary:
What is Parameterization
- Replacing hard coded values in the script is called Parameterization.
- Parameterization helps in :
- Reducing script size
- Avoiding cache effect
Type of Parameters
#1. Date/Time – Whenever we have to replace a date value with a parameter, Date/Time parameter is used. Any post with past date is not valid. To keep it updated, Date/Time parameter provides flexibility to get the current or future date. If past date is needed, it handles that too.
#2. Group Name -We can generate a parameter on the basis of group that we select on controller for the script while execution. This parameter will only work while running the script on controller.
#3. Iteration Number – This replaces the parameter with current iteration number. This is generally used to build some logic. For example- when we want some code in script to be executed alternatively. For this, we will use the iteration number to check whether it is even or odd number and for one of the condition we will execute the function.
#4. Load Generator Name – We can also generate parameter while executing the script on controller on the basis of load generator name on which that script is running. This parameter only works while running the script on controller.
#5. Vuser ID – When we run the script on controller, it assigns a unique id to each virtual user that emulate during the execution. This parameter type is used –
- To print the Vuser ID in an external file for script-debugging purpose.
- To segregate transaction volume based on Vuser ID
#6. File – Some time we want to pass the specific value in the script. In such cases, we use file and enter the values that want to use during execution. LR provides options to run the script with provided list sequentially or randomly on next iteration.
In few cases we want to use a set of values passed to the script. In such cases, we can use same file for the other parameter value as well.
#7. Random Number – As per need, Vugen also generates random value from the provided range.
#9. Unique value – In few situations, script is not allowed to pass any duplicate value. In such cases, unique parameter is used to avoid failures due to duplicate value,.
#10. User Defined function – Such parameter calls a function whose return value replaces the parameter name.
#11. XML – XML Parameter Types are used for multiple valued data contained in an XML structure. XML parameters are widely used with Web Service scripts and with SOA services.
Correlation in LoadRunner:
VUGen Correlation Tutorial Summary:
- Correlation is done for the dynamic value or the value returned by server for any request.
- Parameterization differs from correlation in a way that former takes care of user input data whereas later takes care of data returned by server.
- Manual correlation and automated correlation follow the same steps.
- In Manual Correlation, we have to identify the dynamic value and capture it from the response of previous request. Replace dynamic value with parameter name manually everywhere in the script.
- Automated Correlation works with existing rules.
- WDiff is used to identify the dynamic value. With WDiff compare two scripts with identical steps and user input.
- WDiff does line by line comparison. Another tool available can also be used for word by word comparison.
- Correlation function web_reg_save_param is used for capturing the value for correlation. The other versions of correlation are web_reg_save_param_ex and web_reg_save_param_regexp.
- The mandatory attributes of correlation function web_reg_save_param are parameter name, left boundary (LB) and right boundary (RB).
- Correlation is not only done for dynamic values which change every time but also for data returned by server for different users. To identify such data record, use two scripts with different users (login credentials) keeping user input and steps same. Compare these scripts either with WDiff or any text comparison tool.
Test Result Analysis and Reports in LoadRunner
LoadRunner Results Analysis Tutorial Summary
#1. Analysis is the utility to analyses the LoadRunner results.
#2. LoadRunner results are saved in .lrr file and can be viewed using Analysis.
#3. Analysis gathers the result information from scenario results (lrr file) and stores the information in form of .lra file.
#4. LoadRunner result has “Log” folder which contains Vuser logs and saves snapshots on error.
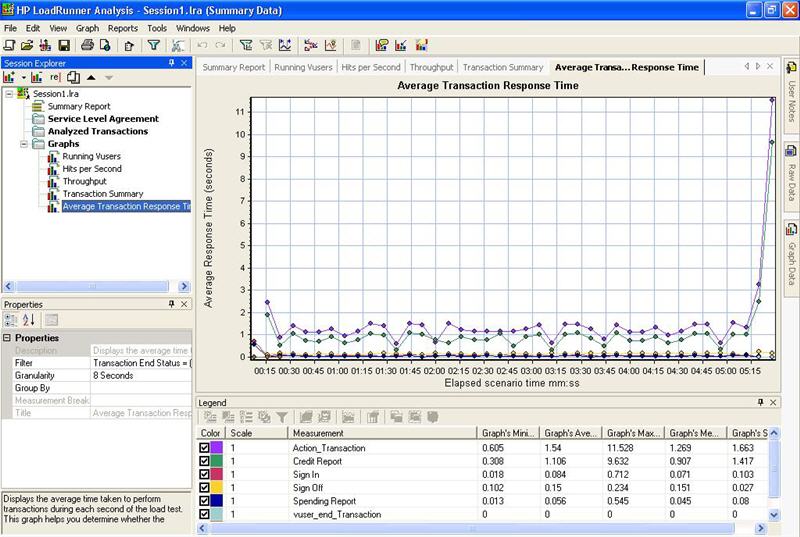
#5. Analysis generates Analysis Summary for the test which gives good idea about the test.
#6. Analysis generates graphs from the data collected during the test execution.
#7. Few of the graphs which are important for analysis of the results are Running Vusers, Hit per second, Throughput, Transaction Summary, Average Transaction Response Time, Error per second, etc.
#8. Analysis provides the raw data from which graphs are created.
#9. The granularity of graph should be such that it has maximized readability along with accurately represent important events.
#10. Analysis also provides facility to compare the results for the test.
#11. Analysis has good reporting mechanism which is helpful in sharing the test results.
#12. In Analysis, customized templates can be created to generate the same report for other test results.
#13. LoadRunner provides many formats to save the report.
https://www.youtube.com/watch?v=vFIxb_3cc1o
<object width="640" height="360">
<param name="movie" value="http://www.youtube.com/embed/yt-video-id?html5=1&rel=0&hl=en_US&version=3"/
<param name="allowFullScreen" value="true"/>
<param name="allowscriptaccess" value="always"/>
<embed width="640" height="360" src="http://www.youtube.com/embed/yt-video-id?html5=1&rel=0&hl=en_US&version=3" class="youtube-player" type="text/html" allowscriptaccess="always" allowfullscreen="true"/>
</object>
