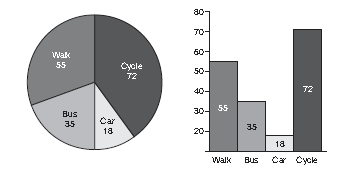
Data set 2: Means of travel to work
Posted by Superadmin on December 09 2015 14:40:37
The findings of a survey into how people travel to work (presented
as both a bar and a pie chart) are shown below.

Note:
1 in 8 of the people who cycled to work were found to be over 65 years of age.
1 in 3 of the cyclists stated that they travelled to work by bus on rainy days.
11. How many more respondents indicated that they walked to work rather than travelled by bus?
A 55
B 35
C 20
D 18
Answer ( )
12. How many more people indicated that they cycled to work compared with those who travelled by either bus or car?
A 72
B 35
C 18
D 19
Answer ( )
13. What is the total number of responses represented in the survey?
A 180
B 170
C 160
D 150
Answer ( )
14. The sum of which categories, if any, represents half the number of responses represented in the survey?
A Cycle and car
B Bus and car
C Walk and bus
D Walk and cycle
Answer ( )
15. How many degrees of arc in the pie chart represent each response in the survey results?
A 8°
B 6°
C 4°
D 2°
Answer ( )
16. Which of the following best represents the ratio of responses between car and cycle?
A 1:6
B 1:5
C 1:4
D 1:3
Answer ( )
17. What fraction most closely represents the segment of the pie labelled bus?
A 1/2
B 1/4
C 1/5
D 1/6
Answer ( )
18. Which of the following statements is true?
A Slightly fewer than twice as many people indicated that they travelled to work by bus than by car.
B Slightly more than twice as many people indicated that they travelled to work by bus than by car.
C Slightly more people indicated that they travelled to work by bus than by car.
D Slightly fewer people indicated that they travelled to work by car than by bus.
Answer ( )
19. How many respondents indicated that they cycled to work and were over 65 years old?
A 12
B 9
C 8
D Cannot tell
Answer ( )
20. How many people cycled on a rainy day?
A 24
B 48
C 72
D Cannot tell
Answer ( )
Data set 2
11. Answer C, 20
Explanation: The survey found that 55 walk and 35 travel by bus. The difference is 20.
12. Answer D, 19
Explanation: The total who travel by either bus or car = (35 +18)= 53; to find how many more cycled, calculate 72 – 53 = 19.
13. Answer A, 180
Explanation: The total number of responses represented is established by adding the responses to each category (55 + 35 + 18 + 72 = 180).
14. Answer A, Cycle and car; and C, Walk and bus
Explanation: You got this right only if you answered A and C (rather than A or C) as both the sum of (cycle and car) and (walk and bus) total 90 or half of the total responses represented in the survey.
15. Answer D, 2°
Explanation: There are a total of 360 degrees in the pie and the survey comprises 180 responses, so (360 ÷ 180 = 2); each response is represented by 2 degrees of arc in the pie.
16. Answer C, 1 : 4
Explanation: The number of responses for car is 18 while the number for cycle is 72. This gives us the ratio of 18 : 72 which simplifies to 1 : 4 (divide both sides by 18 to get 1 : 4).
17. Answer C, 1/5
Explanation: You can estimate this from the pie but it is safer to calculate it by working out how many times either 35 divides into 180 or 70 divides into 360 (70 is the number of degrees of arc that the bus segment represents); both divide 5 times with a small remainder.
18. Answer A, Slightly less than twice as many people indicated that they travelled to work by bus than by car
Explanation: 35 people indicated that they travelled to work by bus while 18 indicated they travelled by car; ×2 18 = 36 which is 1 more than 35.
19. Answer B, 9
Explanation: The note to the data set states that ‘1 in 8 of the people who cycled to work were found to be over 65 years of age’; from this we can calculate that 72 ÷ 8 = 9, the number of respondents aged over 65 who cycled to work.
20. Answer B, 48
Explanation: The note to the data states that ‘1 in 3 of the cyclists travelled to work by bus on rainy days’, so the number of cyclists on rainy days dropped to 2/3 of 72 = (72 ÷ 3 = 24 × 2) = 48.
