High Level Design
Overview
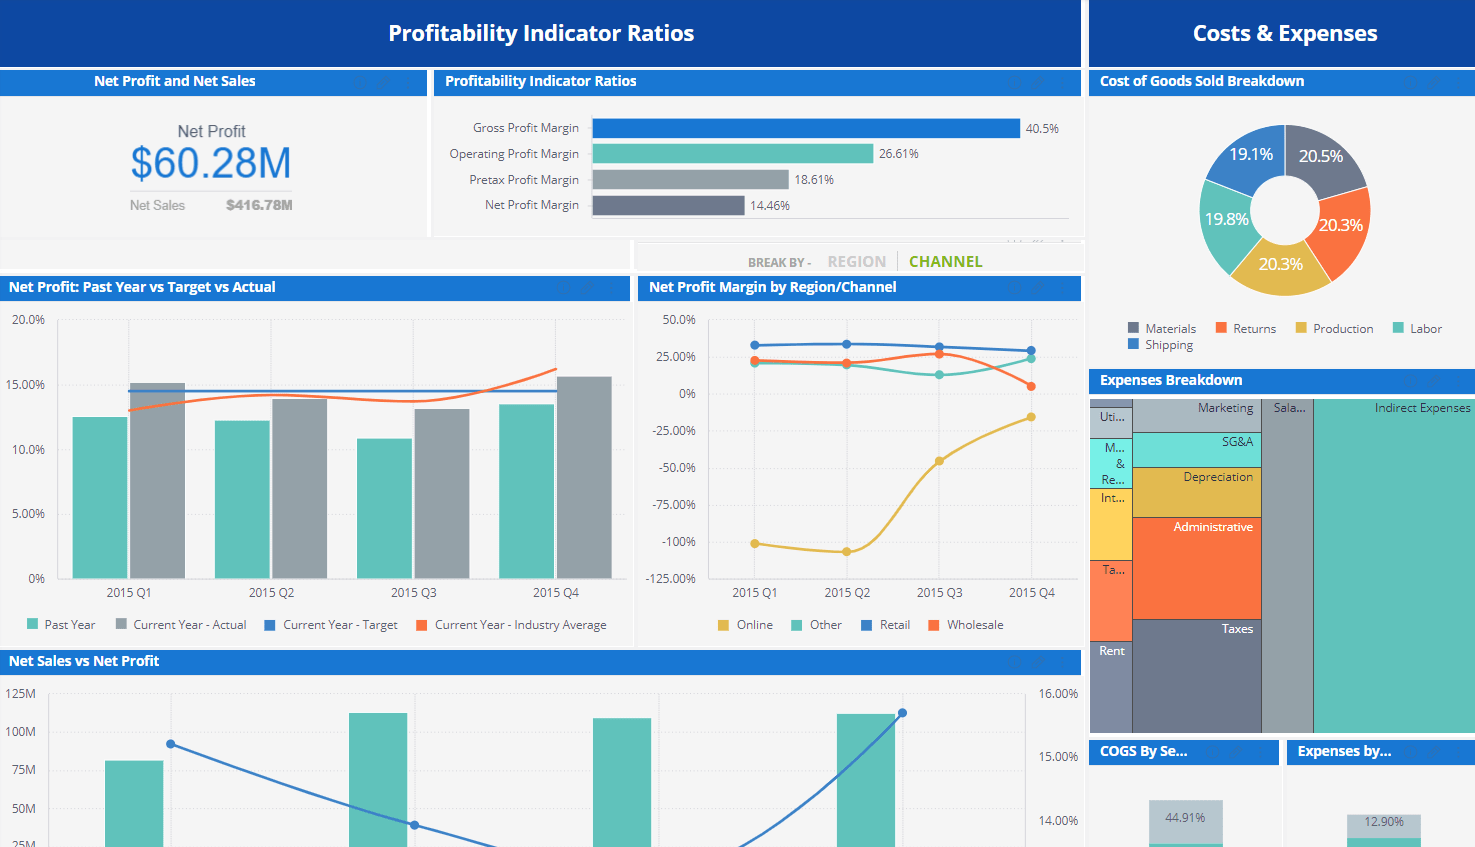
The Net Profit Margin KPI measures how effective your business is at generating profit on each dollar of revenue you bring in. This financial KPI is a measure of the profitability of the business and is instrumental in making long- and short-term financial decisions.Goals
- Allow the CFO of the company to compare the net profit margin over time and relative to other companies in the same sector.
- Allow investors to compare the net profit margin across industries to identify the most profitable and attractive sectors and companies to invest in
Objectives
Understand how much money a company makes for each dollar in sales
KPI Architecture
| Objectives | KPIs | Measures | Data Source |
|---|---|---|---|
| Understand how much money a company makes for each dollar in sales | Net Profit Margin = (Net profit / Net Sales Revenue)*100 | Net Profit | Income Statement / fact_Financial_Data |
| Net Sales | Income Statement / fact_Financial_Data |
Data Requirements
| # | Source | Table Name | Table Details (Type, #Rows, Key field/s) |
|---|---|---|---|
| 1 | Accounting data (income statement) | fact_Financial_Data | Transaction Table |
| 2 | Accounting data (income statement) | fact_Targets | Transaction Table |
Data Modeling (Elasticube Design)

Role
CFO C- level Executive, VP, Operation Manager, DirectorKPIs
Opex-to-Sales Dashboard
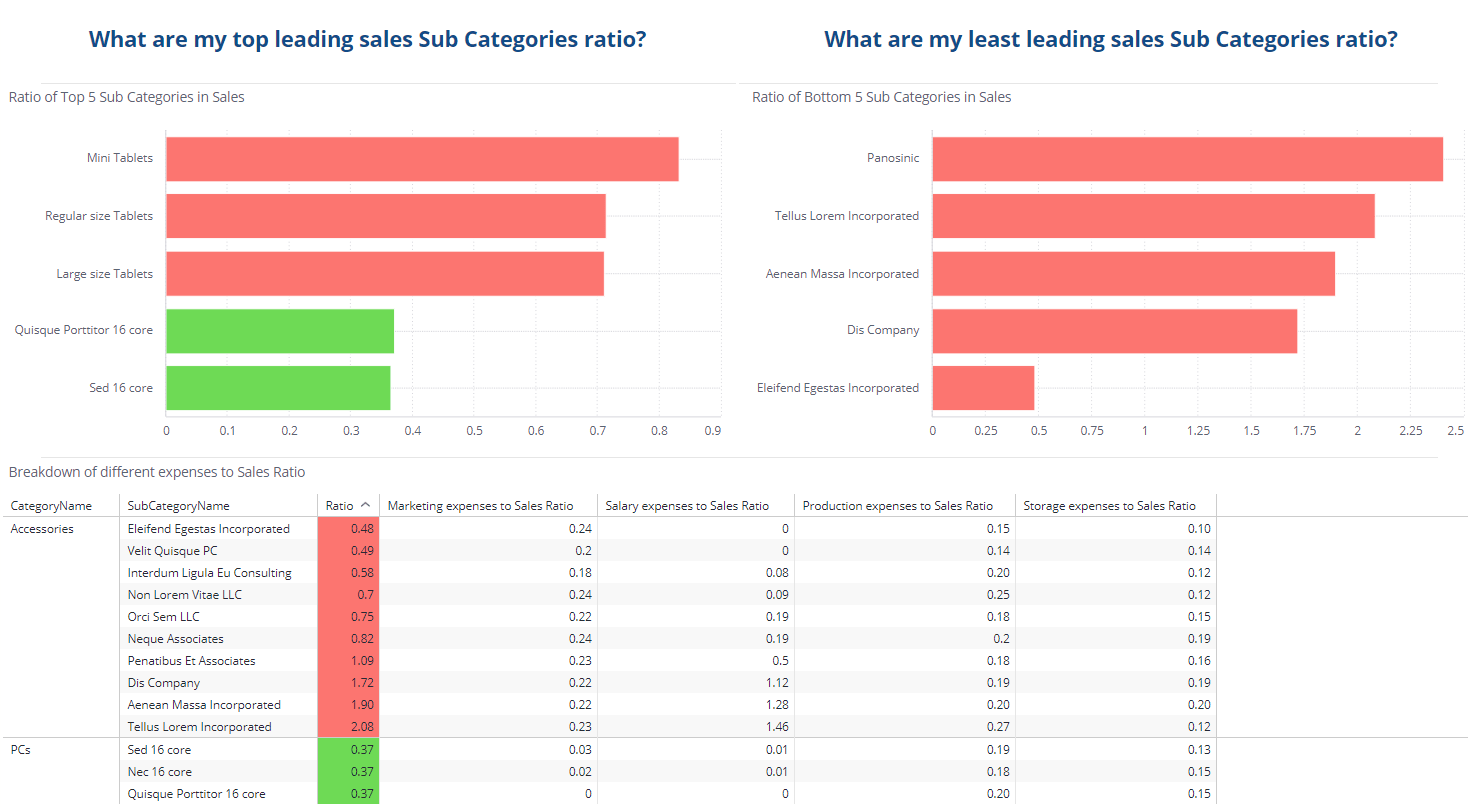
Companies often spend vast amounts of money on the products they sell, incurring expenses such as marketing, storage, manufacturing and salaries of workers. To maintain profitability, it is important to verify each product’s operational expenses (Opex) to Sales ratio is as low as possible. This dashboard is used to reduce a company’s Opex to Sales ratio.
High Level Design
Overview
Companies often spend vast amounts of money on the products they sell, incurring expenses such as marketing, storage, manufacturing and salaries of workers. To maintain profitability, it is important to verify each product’s operational expenses (Opex) to Sales ratio is as low as possible
Goals
Reduce Opex to Sales ratio.
KPI Architecture
| Objective | KPI’s | Measures | Data source |
| Reduce Opex to Sales ratio | Opex to Sales | (([Total MarketingCosts]+[Total Salary_loaded_per_SubCategoryMonthly]+[Total SubCategory_StorageCost]+[Total SubCategory_ProductionCost])/[Total SubCategory_LineTotal]) | MarketingCosts,
Fact_Sales
|
| Total expenses | ([Total MarketingCosts]+[Total Salary_loaded_per_SubCategoryMonthly]+[Total SubCategory_StorageCost]+[Total SubCategory_ProductionCost]) | MarketingCosts,
Fact_Sales
|
|
| Total Sales | [Total SubCategory_LineTotal] | Fact_Sales | |
| Opex to Sales Ratio Year over Year | (([Total MarketingCosts]+[Total Salary_loaded_per_SubCategoryMonthly]+[Total SubCategory_StorageCost]+[Total SubCategory_ProductionCost])/[Total SubCategory_LineTotal]) | MarketingCosts,
Fact_Sales, DimDate
|
|
| Ratio by Category | (([Total MarketingCosts]+[Total Salary_loaded_per_SubCategoryMonthly]+[Total SubCategory_StorageCost]+[Total SubCategory_ProductionCost])/[Total SubCategory_LineTotal]) | MarketingCosts,
Fact_Sales, DimCategory |
|
| 5 most/least leading subcategories in sales – their ratio | (([Total MarketingCosts]+[Total Salary_loaded_per_SubCategoryMonthly]+[Total SubCategory_StorageCost]+[Total SubCategory_ProductionCost])/[Total SubCategory_LineTotal]) | MarketingCosts,
Fact_Sales, DimCategory |
Data Modeling (Elasticube Design)

Department
Role
CFO C- level Executive, VP, Operation Manager, Director
Profit and Loss Dashboard
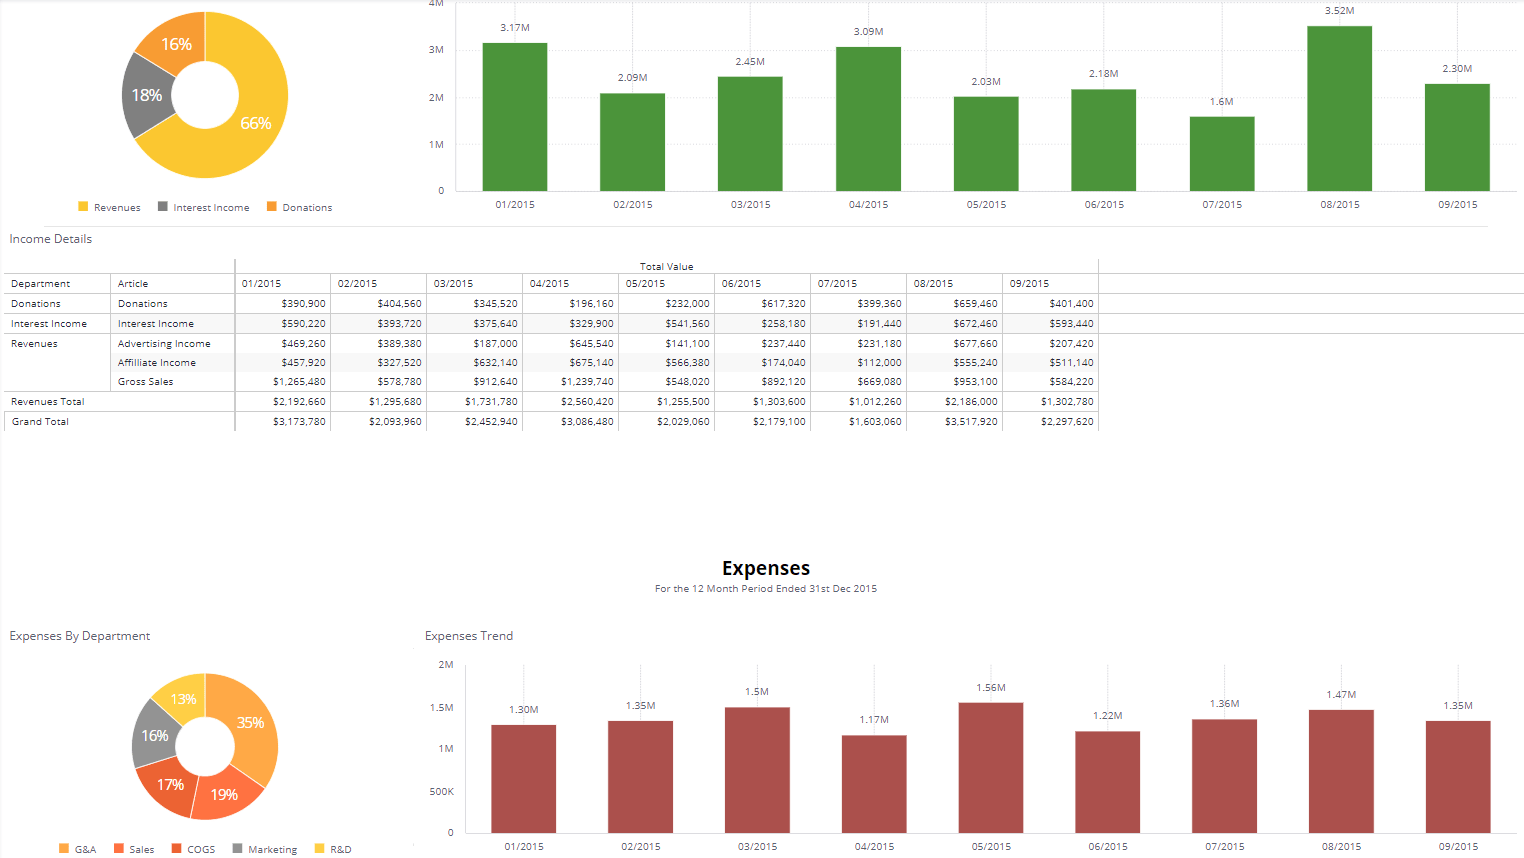
A profit and loss statement (P&L) is a financial statement that summarizes the revenues, costs and expenses incurred during a specific period of time, usually a fiscal quarter or year. The P&L report is prepared as frequently as managers need them, usually monthly or quarterly. A P&L report goes to the manager in charge of each profit center; these confidential profit reports do not circulate outside the business.
High Level Design
Overview
A profit and loss statement (P&L) is a financial statement that summarizes the revenues, costs and expenses incurred during a specific period of time, usually a fiscal quarter or year. The P&L report is prepared as frequently as managers need them, usually monthly or quarterly. A P&L report goes to the manager in charge of each profit center; these confidential profit reports do not circulate outside the business.Goals
Provide information about a company’s ability – or lack thereof – to generate profit by increasing revenue, reducing costs, or both.
Objectives
Show whether a business has made a PROFIT or LOSS over a financial year and describe how the profit or loss arose – e.g. categorising costs between “cost of sales” and operating costs
KPI Architecture
| Objectives | KPIs | Measures | Break by | Data Source |
|---|---|---|---|---|
| Income | ε $ Value Where Type = Operating Expenses Income or Non-Operating Income |
Quarter, Month, Department, Article | Expenses / income report | |
| Expenses | ε $ Value Where Type = Operating Expenses |
Quarter, Month, Department, Article | Expenses / Income Report | |
| Net Income | ε $ Value | Quarter, Month, Department, Article | Expenses / Income Report |
Data Modeling (Elasticube Design)

Department
Role
CFO C- level Executive, VP, Operation Manager, DirectorKPIs
Balance Sheet Analysis Dashboard
High Level Design
Overview
Financial statement analysis (or financial analysis) is the process of reviewing and analyzing a company's financial statements to make better managerial decisions to increase financial performance of company, to succeed in business environment.
In this BI solution we propose a method or process involving specific techniques for evaluating risks, performance, financial health, and prospects of company. It is aimed to allow employees authorized to make managerial decisions (a) to identify the current financial position of the company as of date as well as financial results for specific time frame; (b) allow to measure liquidity, profitability, leverage, recourses turnover, company-wide efficiency, and cash flow; (c) to define trends by comparing ratios across multiple periods and statement types etc.
Data sources are commonly used and can be official financial statement of the company (Balance Sheet, Profit & Loss Account, Cash flow Statements prepared based on the IFRS) as well as General ledger containing detailed list of all journal entries.
It is used by a variety of stakeholders, such as credit and equity investors, the government, the public, and decision-makers within the organization. These stakeholders have different interests and apply a variety of different techniques to meet their needs. For example, equity investors are interested in the long-term earnings power of the organization and perhaps the sustainability and growth of dividend payments. Creditors want to ensure the interest and principal is paid on the organization’s debt securities (e.g., bonds) when due.
Goals
Provide comprehensive analysis of company`s corporate finances aimed to make relevant disclosure enough to make managerial decisions related to financial, operational company`s business activity.
Objectives
The set of the objects below enables to reach out the goal above:
- To visualize balance sheet structure based on main parts as of reporting dates to see dynamics;
- Calculation of Debt`s utilization as of specific date (Total/Net/ST/LT Debt) as of reporting dates in dynamics;
- Estimate creditworthiness of company based on calculation debt load;
- Estimate Leverage and Gearing levels with the ability to have a look on trends;
- Assess the company`s possibility to repair all obligations in dynamic in dates;
- Analyze turnover of the company’s resources (AR, AP, Inventories, etc.) and how it influences on profitability efficiency available in time dynamics;
KPI Architecture
| Objectives | KPIs | Measures | Data Source |
| 1. | Balance Sheet Structure as of reporting dates | Balances of Current/Long-term
Assets/Liabilities per each quartal |
Fact.General_Ledger |
| 2.
|
Total Debt | Senior Bank Debt + Finance Lease + Subordinated Debt + Accrued interests (ST+LT) + Other Debt +
Short Term Debt + Current Portion of Long Term Debt (CPLTD) |
All from FACT.Balance_transpose |
| Net Debt | Senior Bank Debt + Finance Lease + Subordinated Debt + Accrued interests (ST+LT) + Other Debt – Cash & Marketable Securities | All from FACT.Balance_transpose | |
| Short Term Debt | Short Term Debt + Current Portion of Long Term Debt (CPLTD) | All from FACT.Balance_transpose | |
| Long Term Debt | Senior Bank Debt + Finance Lease + Subordinated Debt + Accrued interests (ST+LT) + Other Debt | All from FACT.Balance_transpose | |
| 3. | TOTAL DEBT/EBITDA | Senior Bank Debt + Finance Lease + Subordinated Debt + Accrued interests (ST+LT) + Other Debt +
Short Term Debt + Current Portion of Long Term Debt (CPLTD) / Sum(Sales)- Sum(CoS) – Sum(R&D Expense) – Sum(SG&A Expense) -Sum(Depreciation) + Sum(Other Operating Income/-Expenses) |
TOTAL DEBT – from FACT.Balance_transpose
EBITDA from FACT.P&L_transpose |
| NET DEBT/EBITDA | (Senior Bank Debt + Finance Lease + Subordinated Debt + Accrued interests (ST+LT) + Other Debt – Cash & Marketable Securities)
/ (Sum(Sales)- Sum(CoS) – Sum(R&D Expense) – Sum(SG&A Expense) -Sum(Depreciation) + Sum(Other Operating Income/-Expenses)) |
Net Debt – from Balance
EBITDA from FACT.P&L_transpose |
|
| LT DEBT/EBITDA | (Senior Bank Debt + Finance Lease + Subordinated Debt + Accrued interests (ST+LT) + Other Debt ) / (Sum(Sales)- Sum(CoS) – Sum(R&D Expense)
– Sum(SG&A Expense) -Sum(Depreciation) + Sum(Other Operating Income/-Expenses)) |
LT DEBT – from Balance
EBITDA from FACT.P&L_transpose |
|
| 4. | Leverage | (Total Liabilities) / (Equity – Goodwill – Intangibles) | All from FACT.Balance_transpose |
| Gross Gearing | (Senior Bank Debt + Finance Lease + Subordinated Debt + Accrued interests (ST+LT) + Other Debt +
Short Term Debt + Current Portion of Long Term Debt (CPLTD)) /(Equity – Goodwill – Intangibles) |
All from FACT.Balance_transpose | |
| Net Gearing | (Senior Bank Debt + Finance Lease + Subordinated Debt + Accrued interests (ST+LT) + Other Debt – Cash & Marketable Securities)
/(Equity – Goodwill – Intangibles) |
All from FACT.Balance_transpose | |
| 5. | Current Liquidity | (Current Assets)/(Current Liabilities) | All from FACT.Balance_transpose |
| Quick Liquidity | (Cash & Marketable Securities+ Accounts Receivable) / (Current Liabilities) | All from FACT.Balance_transpose | |
| Working Investments/Sales | (Current Assets – Cash & Marketable Securities) / (Current Liabilities – Short Term Debt – CPLTD) | All from FACT.Balance_transpose | |
| 6. | Days Payable | (Accounts Payables)/(Cost of Sales)*365 | Accounts Payables – from FACT.Balance_transpose
Cost of Sales from FACT.Balance_transpose |
| Days Receivable | (Account Receivables)/(Sales)*365 | Accounts Receivables – from FACT.Balance_transpose
Sales from FACT.Balance_transpose |
|
| Days Inventory | (Inventories)/(Cost of Sales)*365 | Inventories – from FACT.Balance_transpose
Cost of Sales from FACT.Balance_transpose |
|
| Sales/ Net Fixed Assets | (Sales)/ (Net Fixed Assets+ Net Finance Leases) | Sales – from FACT.P&L_transpose
Other from FACT.Balance_transpose |
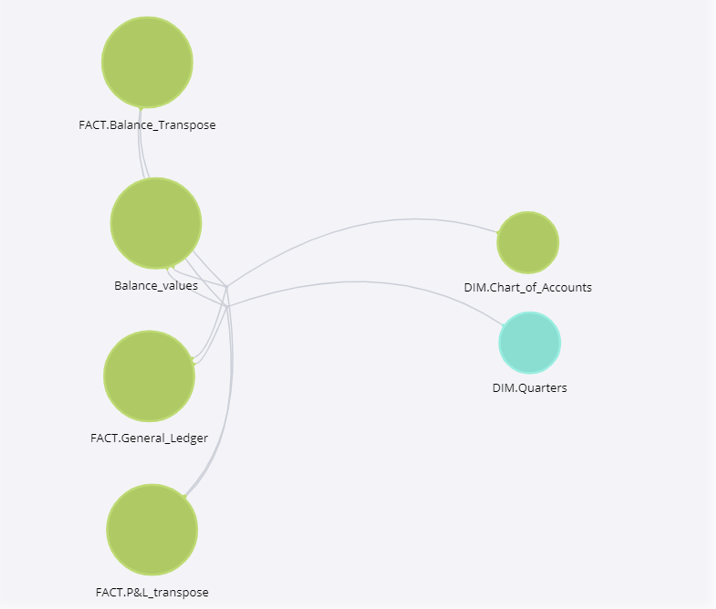
Entities Relationship Diagram

Data Requirements
| # | Source | Table Name | Table Details (Type, #Rows, Key field/s) |
| 1 | ERP or accounting systems
in Company |
General _Ledger | The list of all accounting journal entries during analyzed period |
| 2 | ERP or accounting systems
in Company |
Balance Sheet | Official finance reporting of the company prepared by accountant divisions |
| 3 | ERP or accounting systems
in Company |
Profit and Loss Statements | Official finance reporting of the company prepared by accountant divisions |
Plugins & Scripts Used
Department
Role
CFO, C- level Executive, VP, Operation Manager, DirectorKPIs
Cash Flow Statement Dashboard
High Level Design
Overview
A cash flow statement is a financial statement that provides aggregate data regarding all cash inflows a company receives from its ongoing operations and external investment sources, as well as all cash outflows that pay for business activities and investments during a given period. The cash flow statement (CFS) measures how well a company manages its cash position, meaning how well the company generates cash to pay its debt obligations and fund its operating expenses.In this BI solution we propose the method of using Sisense BI analytics in the assessment of the Cash Flow statement. In our CF analysis solution, we use cash basis accounting instead of accrual basis accounting. The purpose of this Industry analysis is to show where an entities cash is being generated (cash inflows), and where its cash is being spent (cash outflows), over a specific period (usually quarterly and annually). It is important for analyzing the liquidity and long-term solvency of a company.
We calculated Cash Flow by making adjustments to net income by adding or subtracting differences in revenue, expenses, and credit transactions (appearing on the balance sheet and income statement) resulting from transactions that occur from one period to the next. And we apply direct method of cash flow calculating (these figures are calculated by using the beginning and end balances of a variety of a business accounts and examining the net decrease or increase in the accounts).
Data sources are commonly used and can be General Ledger, Trial Balance, Balance sheet, P&L or Cash Flow Statement itself. It is used by a variety of stakeholders, such as credit and equity investors, the government, the public, and decision-makers within the organization. These stakeholders have different interests and apply a variety of different techniques to meet their needs. (For instance, CFS allows investors to understand how a company's operations are running. The CFS is important since it helps investors determine whether a company is on a solid financial footing).
Goals
Prepare comprehensive cash flow analysis to make proper disclosure for the liquidity and long-term solvency of a company and enable to make accurate managerial decisions for the effective liquidity management.
Objectives
The set of the objects below enables to reach out the goal above:
- Prepare Cash Flow Statements under IFRS based on available General Ledger, Balance Sheet, and Profit and Loss Account;
- Provide well-visualized dynamics of the major items of the cash flow statements;
- Investigate the possible gaps of liabilities repayment schedule to define the amount of required financing and time when it`s expected to be required;
- Analyze Net Change in Cash and Free Cash flow to define the company`s demand on financing during the operating period;
- Analyze Net Operating Cash Flow and Gross Operating Cash flow with the EBITDA disclosure that enables to see major risk in the financing of operating activity;
- Analyze amount Interest Accrued from one hand and Net Cash Flow from other hand to be able to find out whether it`s possible to repay debt during the analyzed period;
- Estimate the level of the company`s internal accruals that effect fin result but not effect cash flow;
KPIs Architecture
|
Objectives |
KPIs |
Measures |
Data Source |
|
1.Cash Flow Statements |
Cash Flow Statements |
Cash flow Statement prepared under IFRS |
Fact.General_Ledger |
|
2.Working investment changes |
Change in Inventory Change in Receivables Change in Payables Change in Accrued Liabilities |
Dynamics of major Cash Flow Operational items |
FACT.Cash_Flow |
|
3.Loan Default Analysis |
Repayment Ratio |
NOCF / Interest expense for current period |
FACT.Cash_Flow |
|
Net Operational Cash flow |
EBITDA – SUM (Change in Inventory, Change in Receivables, Change in Payables, Change in Accrued Liabilities) |
FACT.Cash_Flow |
|
|
4. NCC vs FCF (Debt Service) |
Net Change in Cash |
Resulting item in the Cash flow prepared by Direct method |
FACT.Cash_Flow |
|
EBITDA |
Sum(Sales)- Sum(CoS) – Sum(R&D Expense) – Sum(SG&A Expense) -Sum(Depreciation) + Sum(Other Operating Income/-Expenses) |
P&L_transpose |
|
|
FREE CASHFLOW A/DEBT SERVICE |
SUM (NET OPERATING CASHFLOW) – SUM (Investment Income (Interest / Dividend), Debt Repayments, Lease Expense, Other Income / Expense) |
FACT.Cash_Flow |
|
|
5. NOCF vs GOFT |
EBITDA (earnings before interest, tax, depreciation, amortization) |
Sum(Sales)- Sum(CoS) – Sum(R&D Expense) – Sum(SG&A Expense) -Sum(Depreciation) + Sum(Other Operating Income/-Expenses) |
Sales, Cost of Sales, SG&A Expenses, Other Operating Income – from FACT.P&L_transpose |
|
Net Operating Cash Flow |
GROSS OPERATING CASHFLOW – sum(changes in Inventory, AR, AP, AL, working investments) |
FACT.Cash_Flow |
|
|
Gross Operating Cash Flow |
Sum(Sales)- Sum(CoS) – Sum(R&D Expense) – Sum(SG&A Expense) -Sum(Depreciation) + Sum(Other Operating Income/-Expenses) – Cash Interest Paid – Taxes Paid. |
FACT.Cash_Flow – P&L.Transpose |
|
|
6. Net_CF vs Interest Accrued |
Net Cash Flow |
Resulting item in the Cash flow prepared by Direct method |
Fact.Cash_flow |
|
EBITDA (earnings before interest, tax, depreciation, amortization) |
Sum(Sales)- Sum(CoS) – Sum(R&D Expense) – Sum(SG&A Expense) -Sum(Depreciation) + Sum(Other Operating Income/-Expenses) |
P&L.Transpose |
|
|
Interest Accrued |
Interest accrued from Balance sheet and P&L |
Balance_sheet_values P&L_transpose |
|
|
7. Internal Accruals Analysis |
Depn/ Total CapEx & Acquisitions |
Depreciation (Balance Sheet analysis) / CapEx & Acquisitions (cash flow) ) |
FACT.Balance_sheet_values Cash_flow_transpose |
|
Depreciation/ Gross Fixed Assets |
Depreciation (Balance Sheet) Assets (balance sheet)
|
FACT.Balance_sheet_values |


