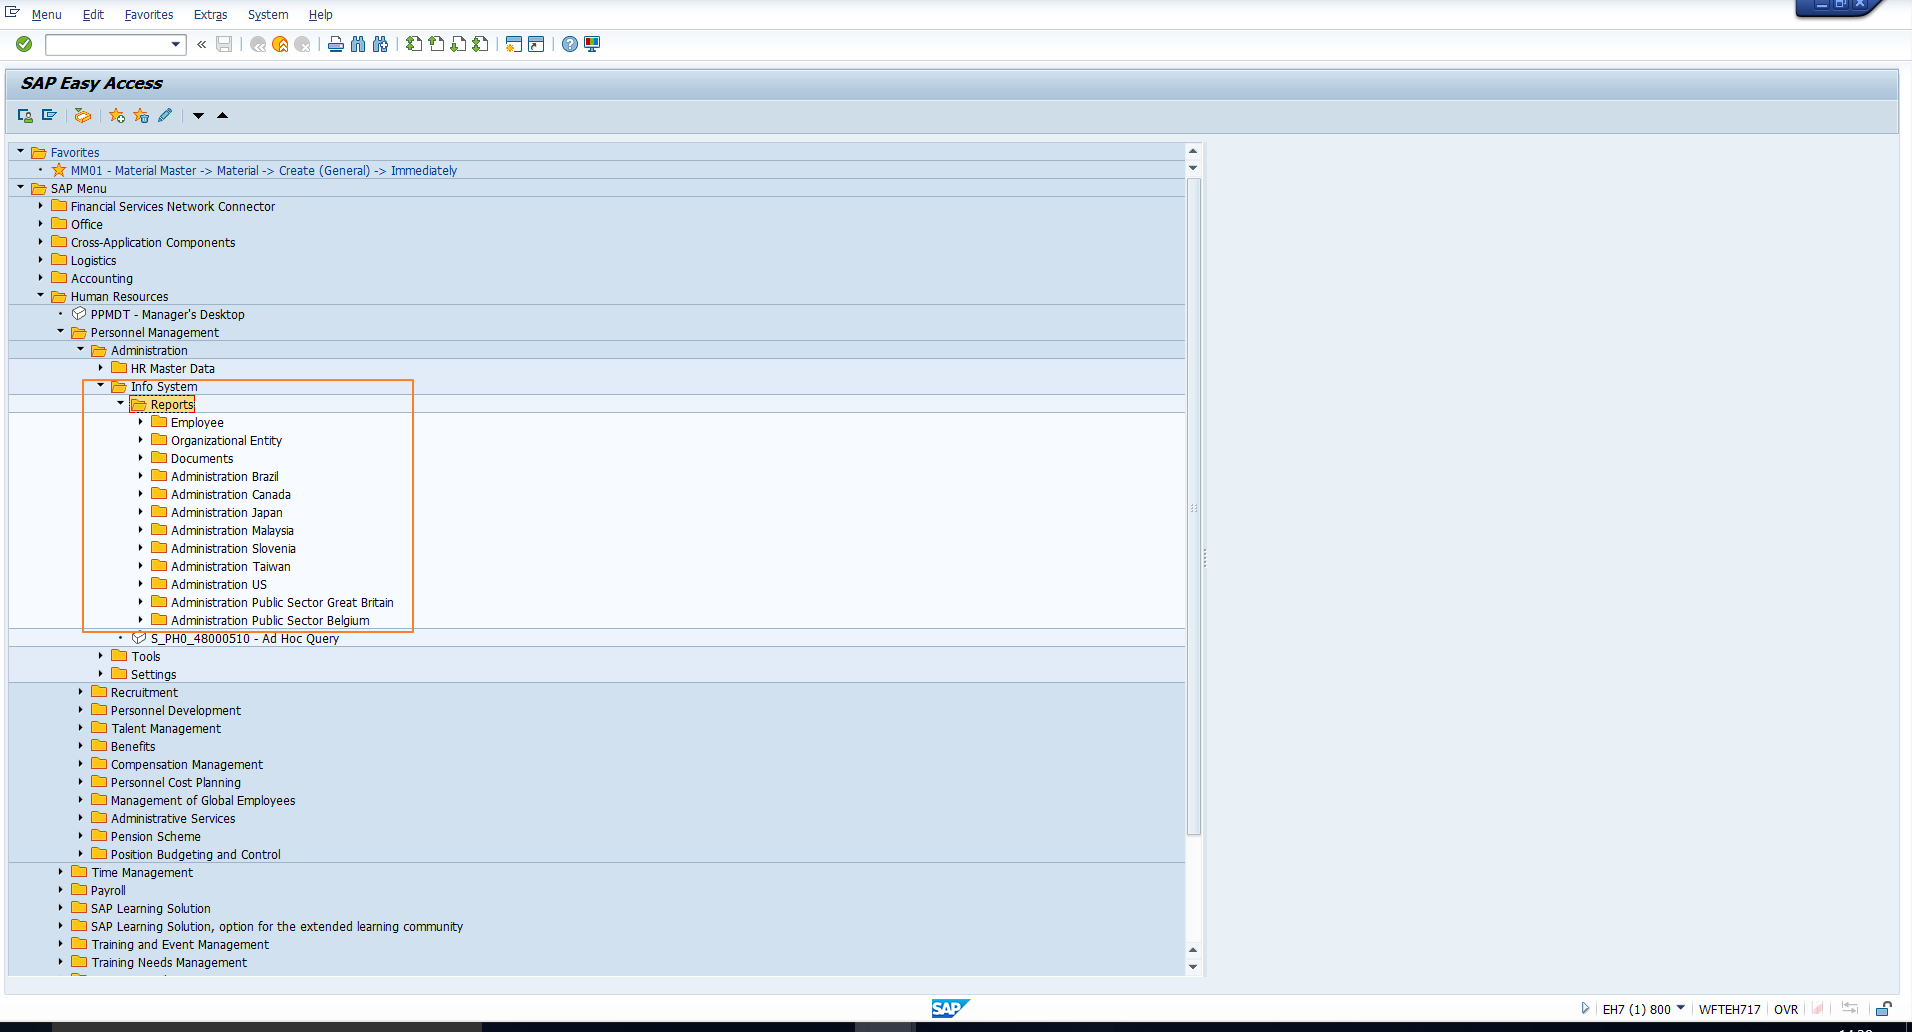
 Figure 1: Info System
Welcome to the tutorial on SAP Personnel Administration reports. One of the key functions of SAP HCM lies in its reporting capability. There are various standard reports which enable user-friendly, yet secure, extraction of information. We will go through some examples in this tutorial. This tutorial is part of our free SAP HCM course.
Reporting in SAP Personnel Administration comprises three activities:
Let’s discuss some of the most common SAP Personnel Administration reports that are available in any SAP ERP system.
All the standard reports in Personnel Administration can be accessed through a common path in the SAP Easy Access Menu as shown below, as well as in Figure 1.
Human Resources – Personnel Management – Administration – Info system – Reports
In this section, we will take you through some useful standard SAP Personnel Administration reports. Follow the path shown in Figure 2 to access all reports related to Employee information.
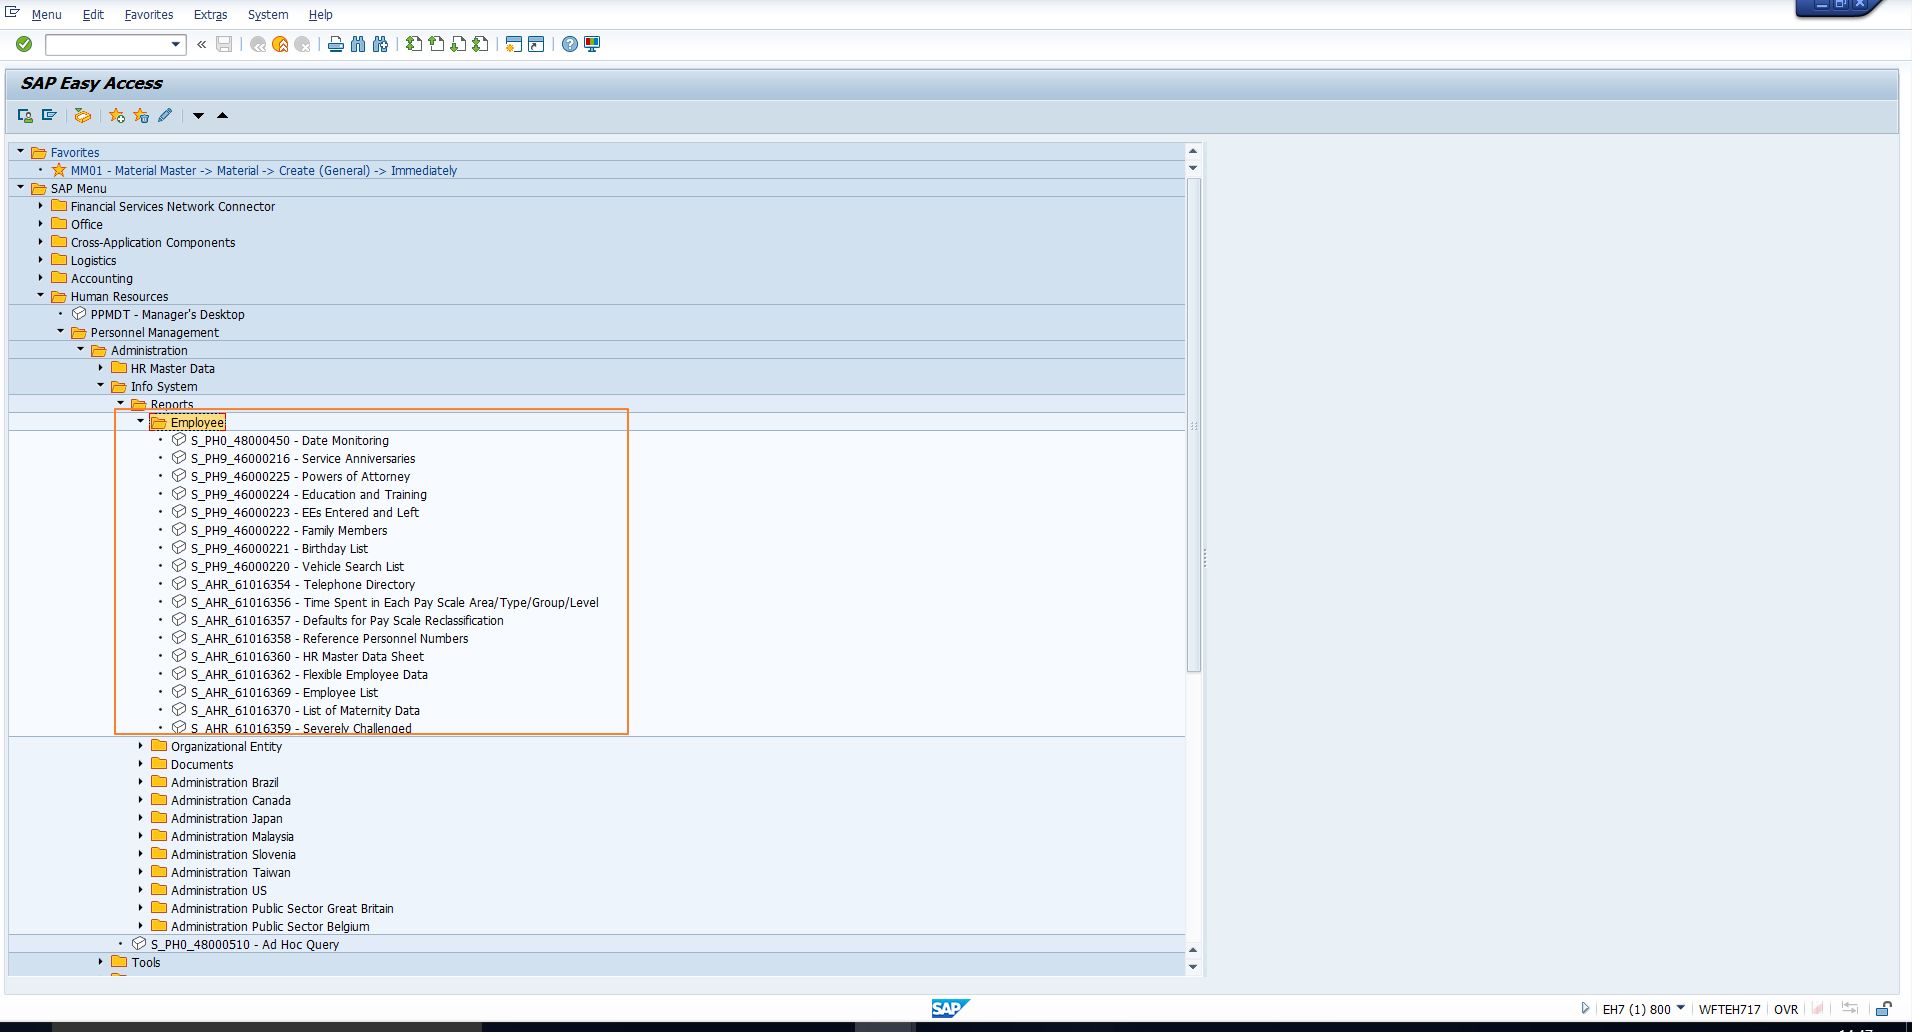 Figure 2: Info System – Employee
We will elaborate on a few useful SAP Personnel Administration reports here.
1. Education and Training Report
This report gives you an overview of the educational qualifications of employees based on the data stored in the Education Infotype. Follow the path in Figure 3 or enter the transaction code highlighted in Figure 3 to execute the Education and Training report.
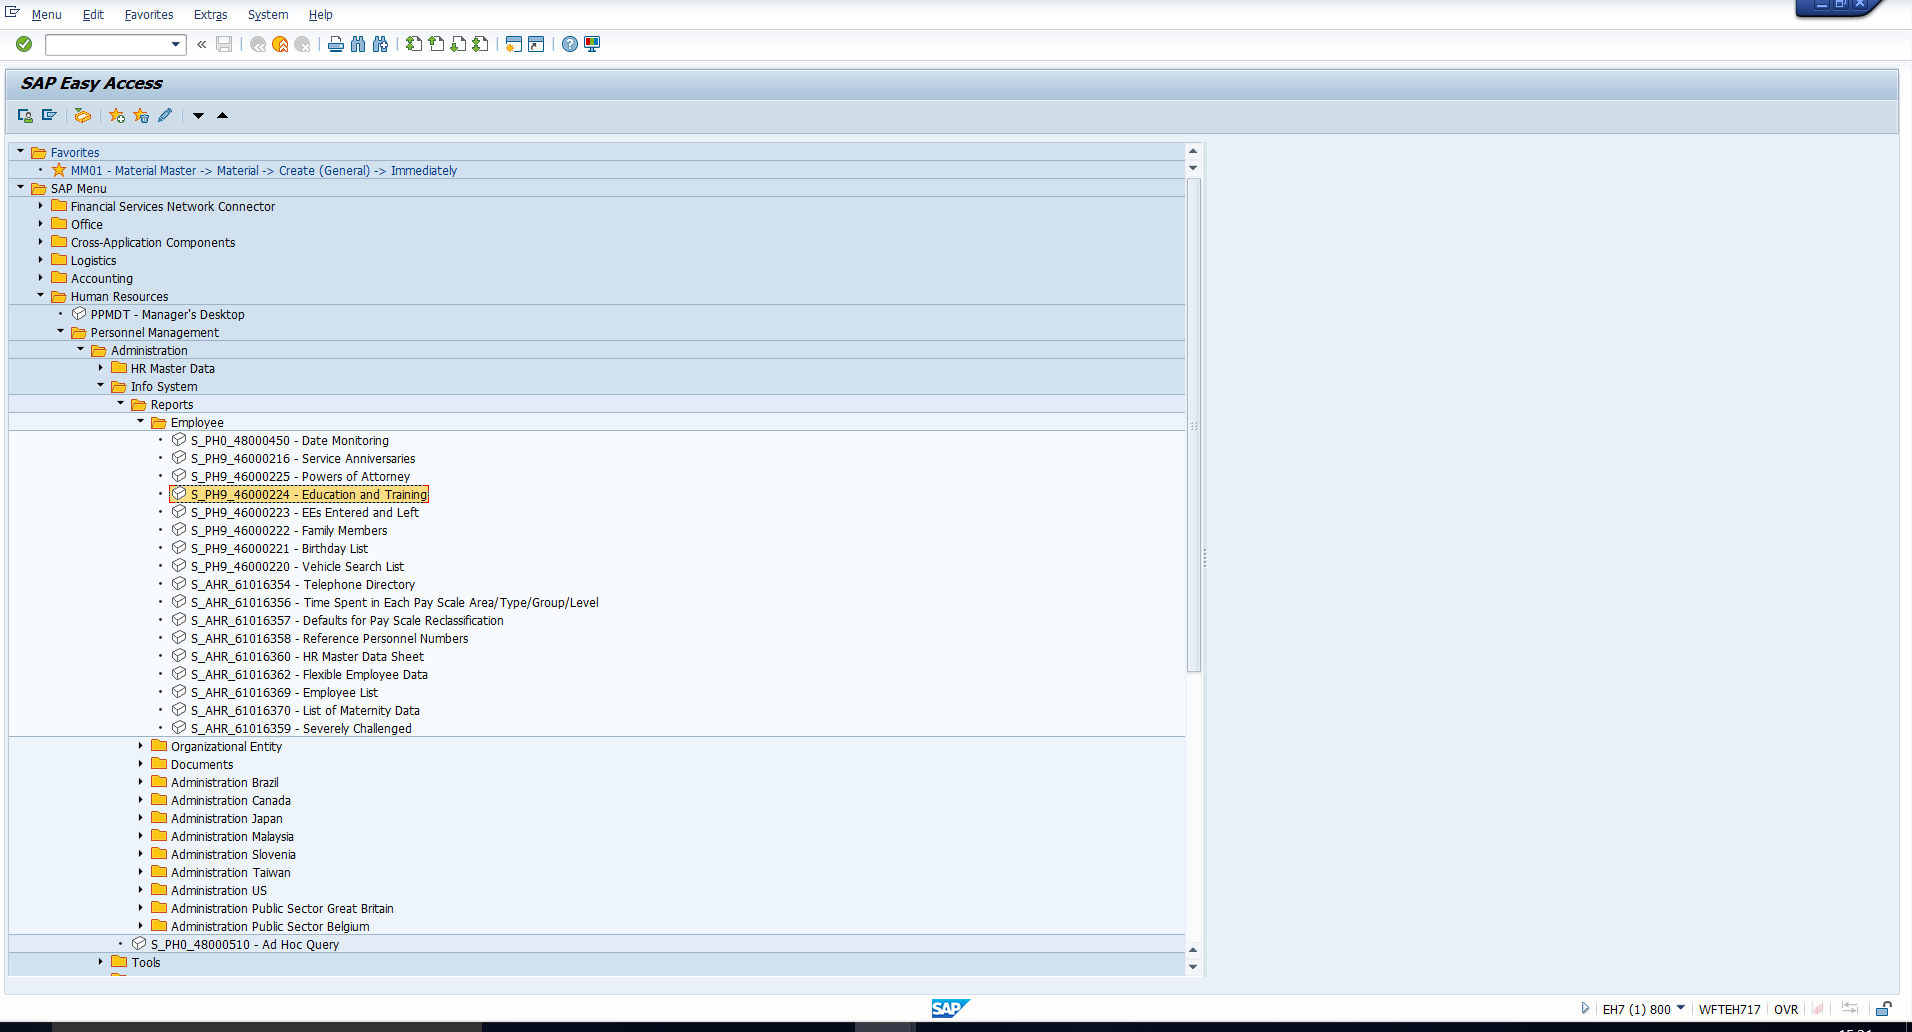 Figure 3: Education and Training
On double clicking on this report, you will see the screen in Figure 4 which is basically the report selection screen described earlier.
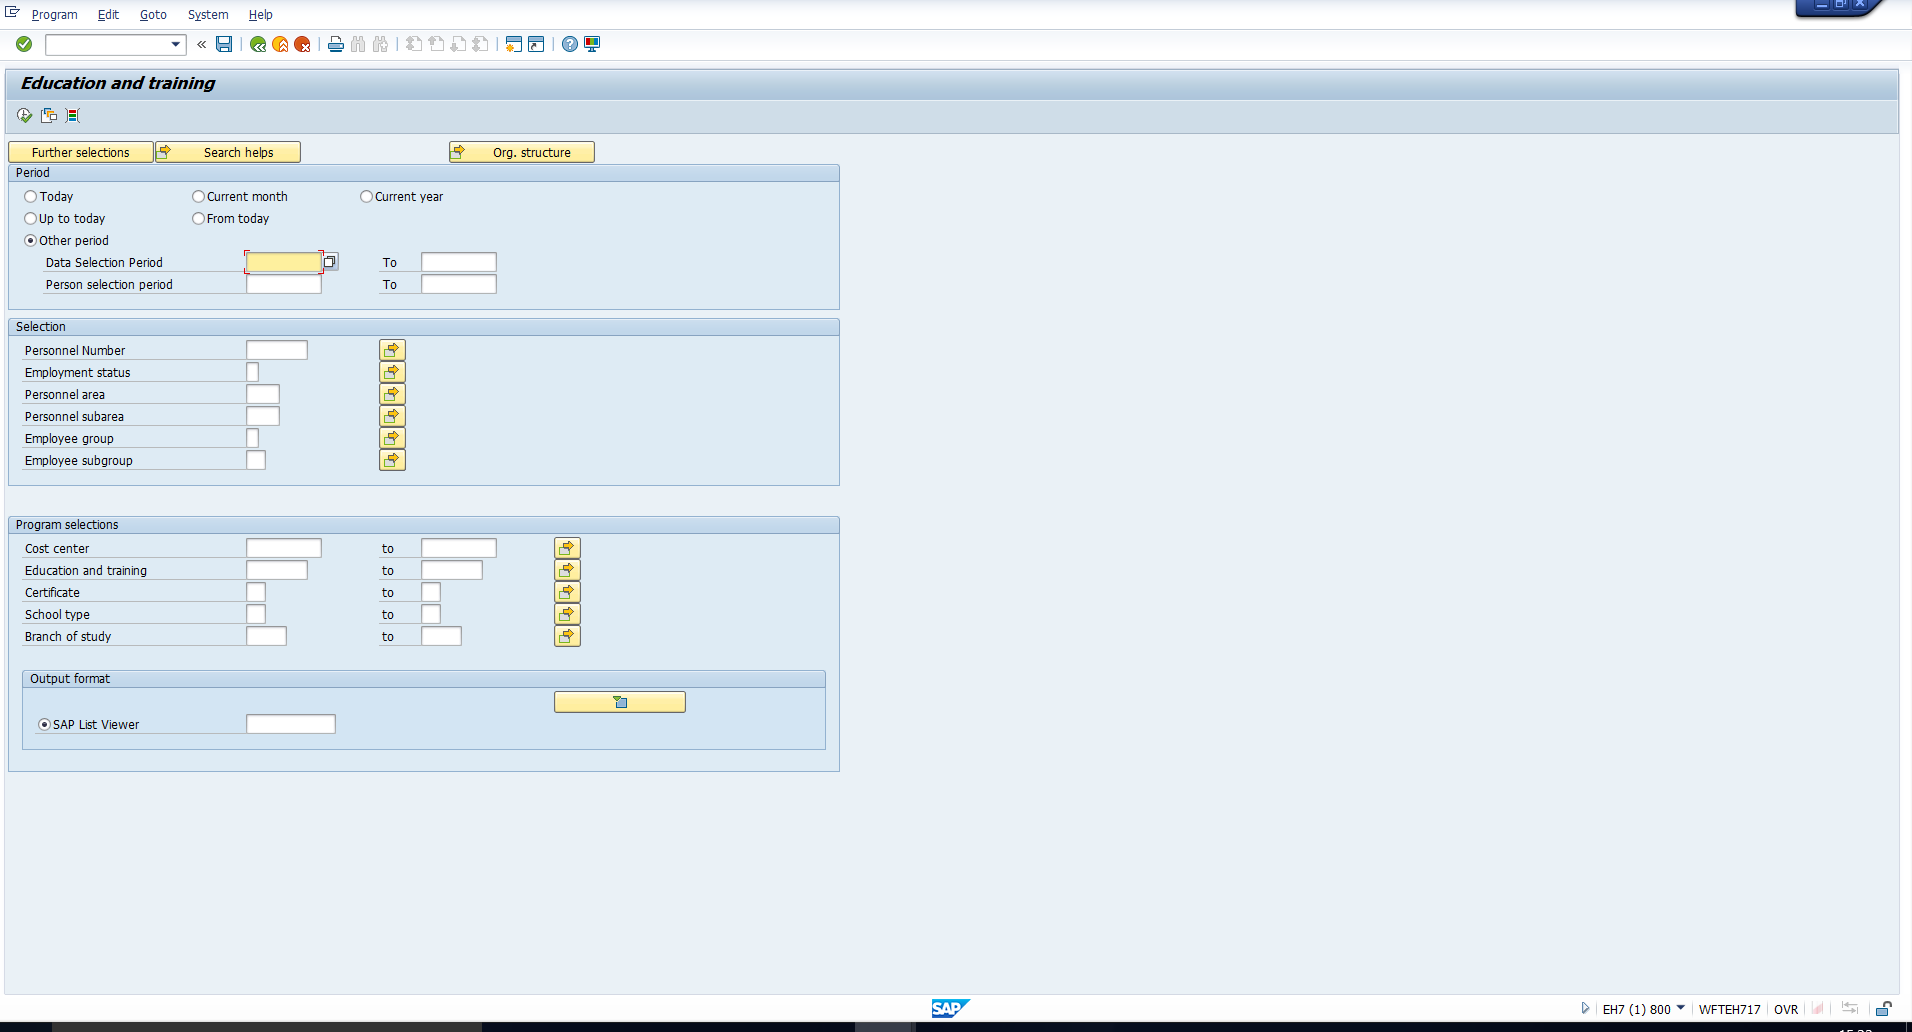 Figure 4: Education and Training selection screen
In this screen, you can restrict the report selection based on certain criteria. Let’s consider an example. Assume we want a list of all employees with a degree in B.Sc. Computer Science.
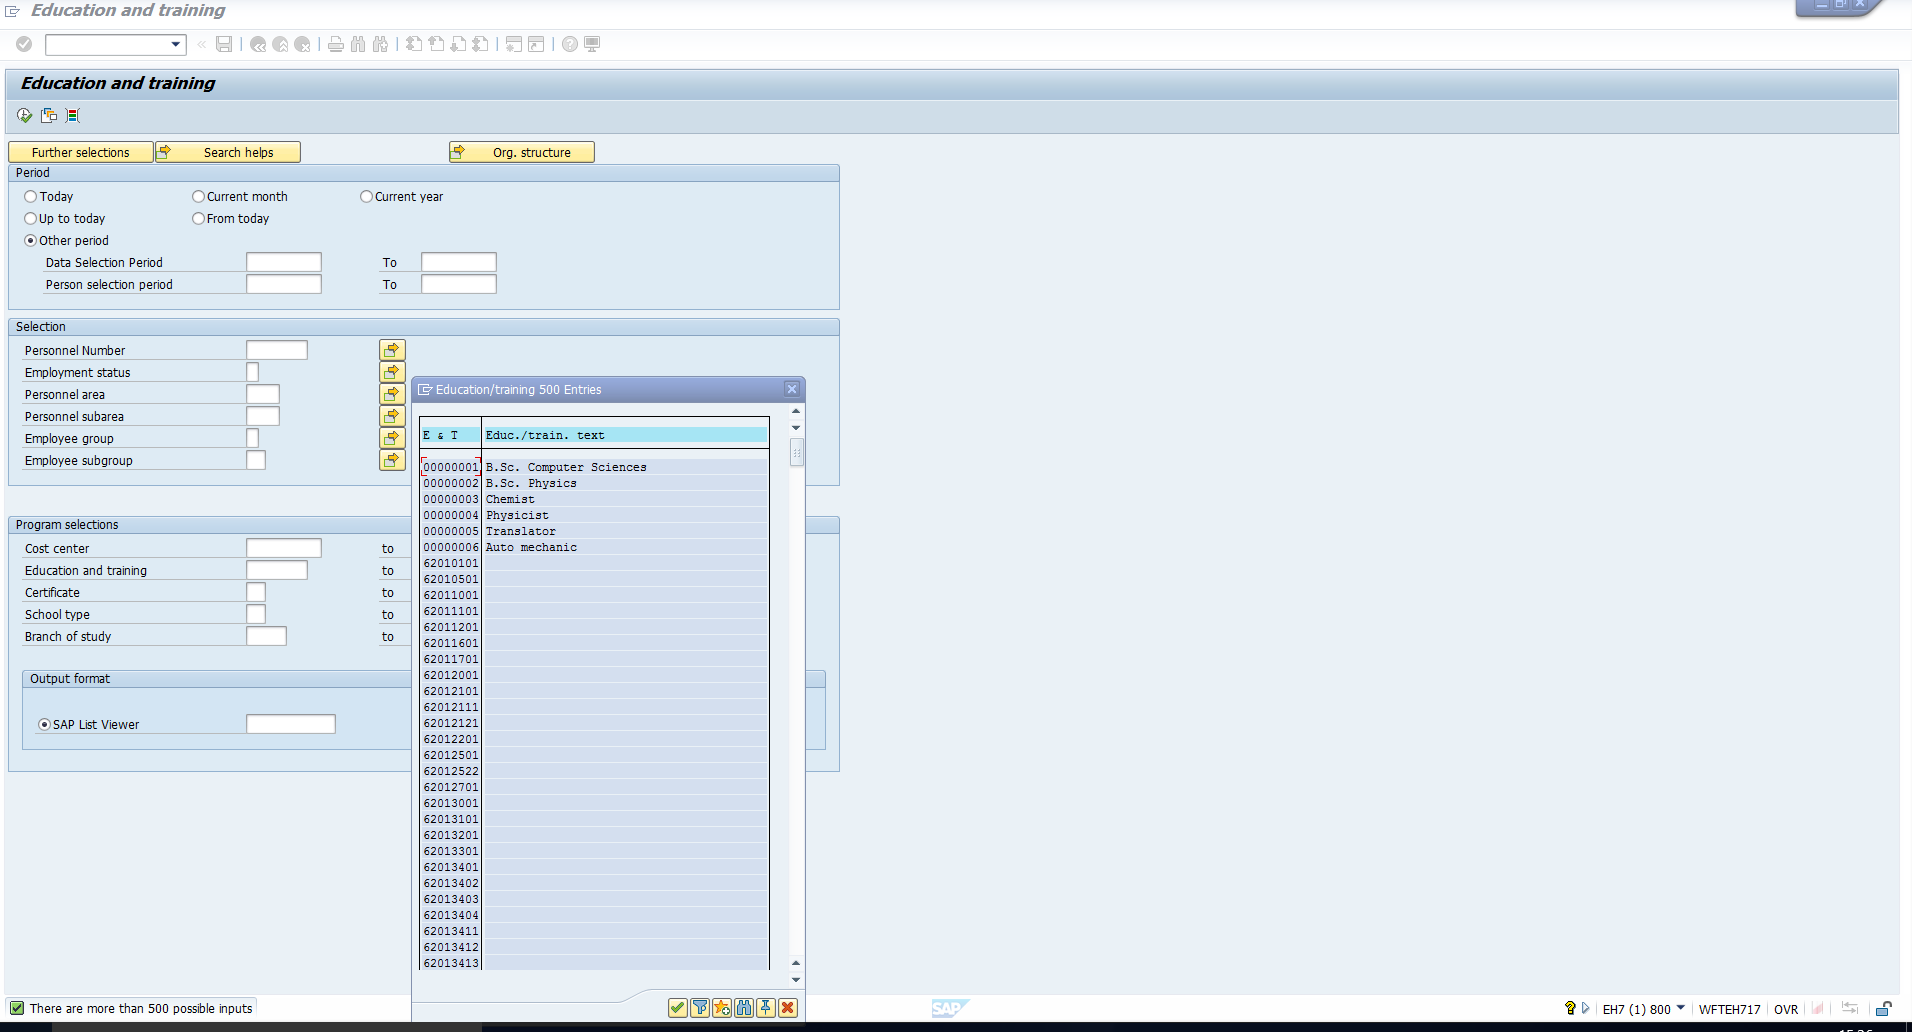 Figure 5: Select Education and Training from Dropdown List
Select the required value in the Education and training selection field. The list of values is shown in Figure 5. Once you select the value, your selection screen should look like that in Figure 6.
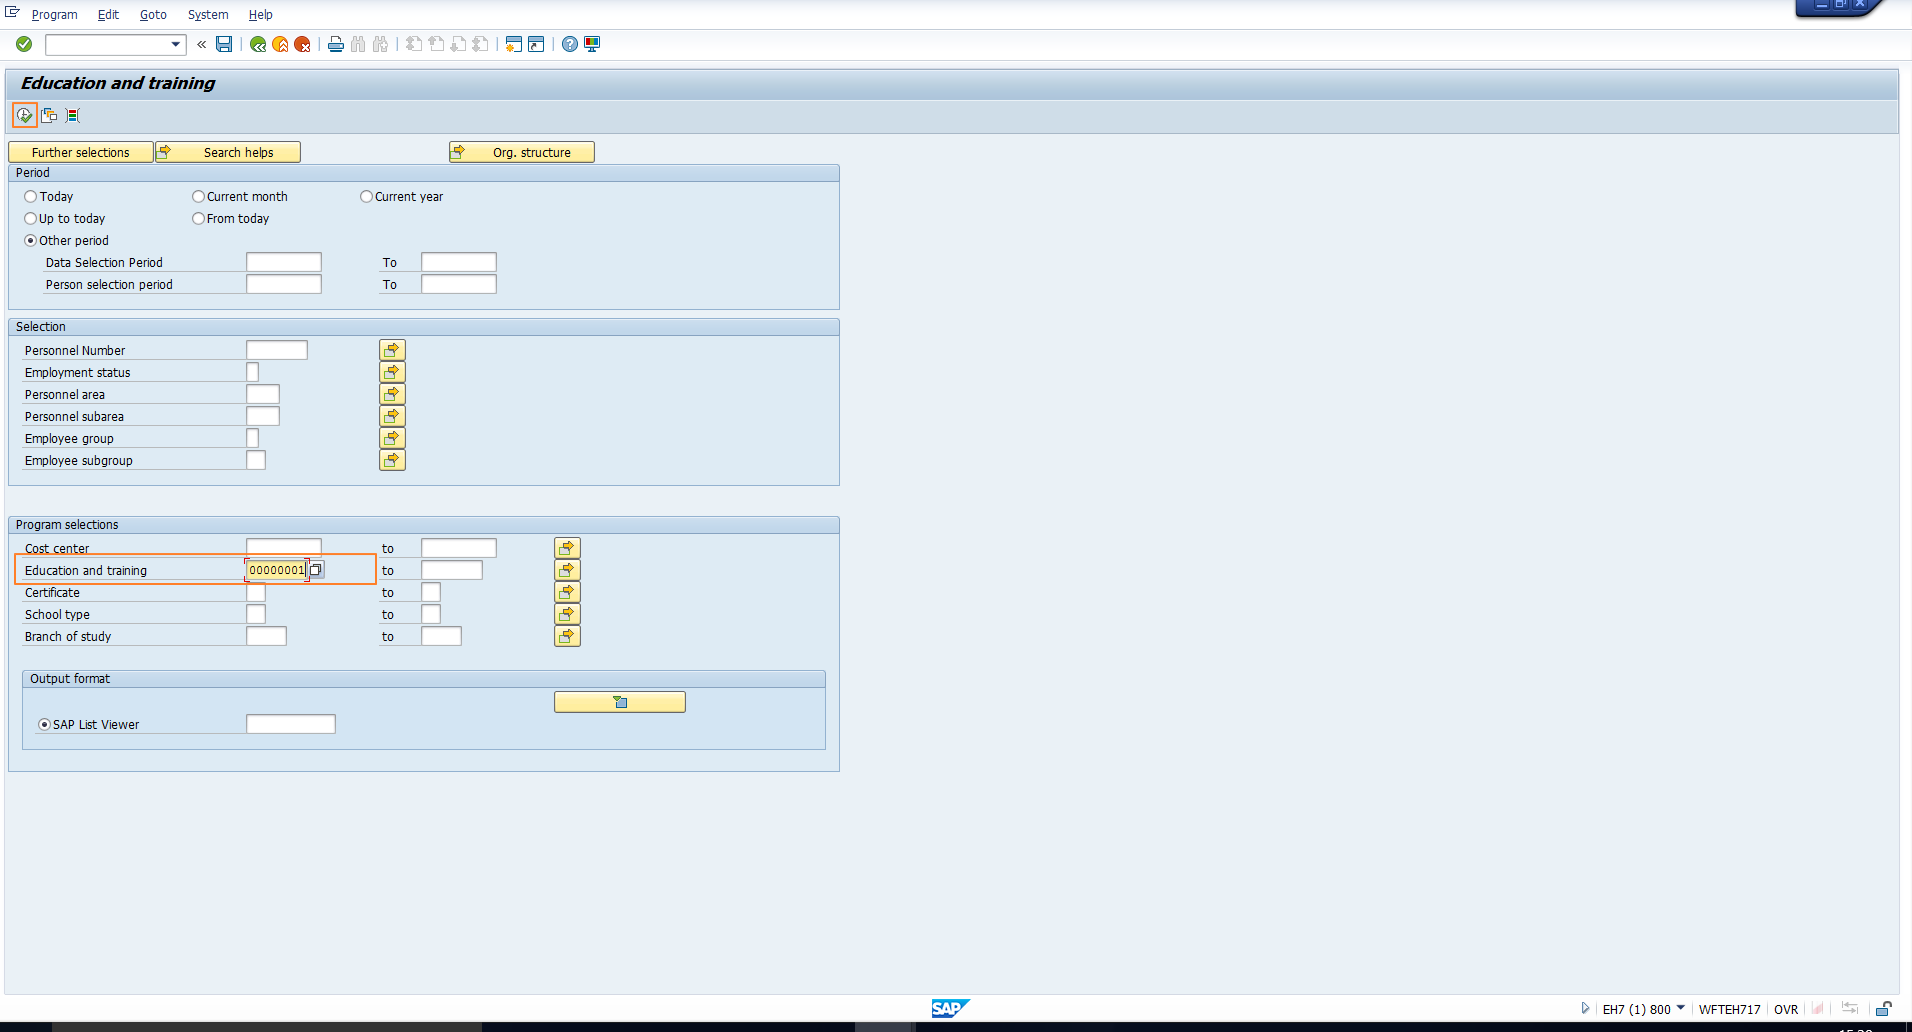 Figure 6: Enter Selection Value and Execute
You can then click on the ‘Execute’ icon. This will trigger processing of the data to read the Education infotype to select employees who satisfy the selection criterion. Once processing is completed, the output screen is displayed as shown in Figure 7.
You can then print this list with the help of the Print icon shown in Figure 8.
You can also extract the output to Excel as shown in Figures 9 and 10.
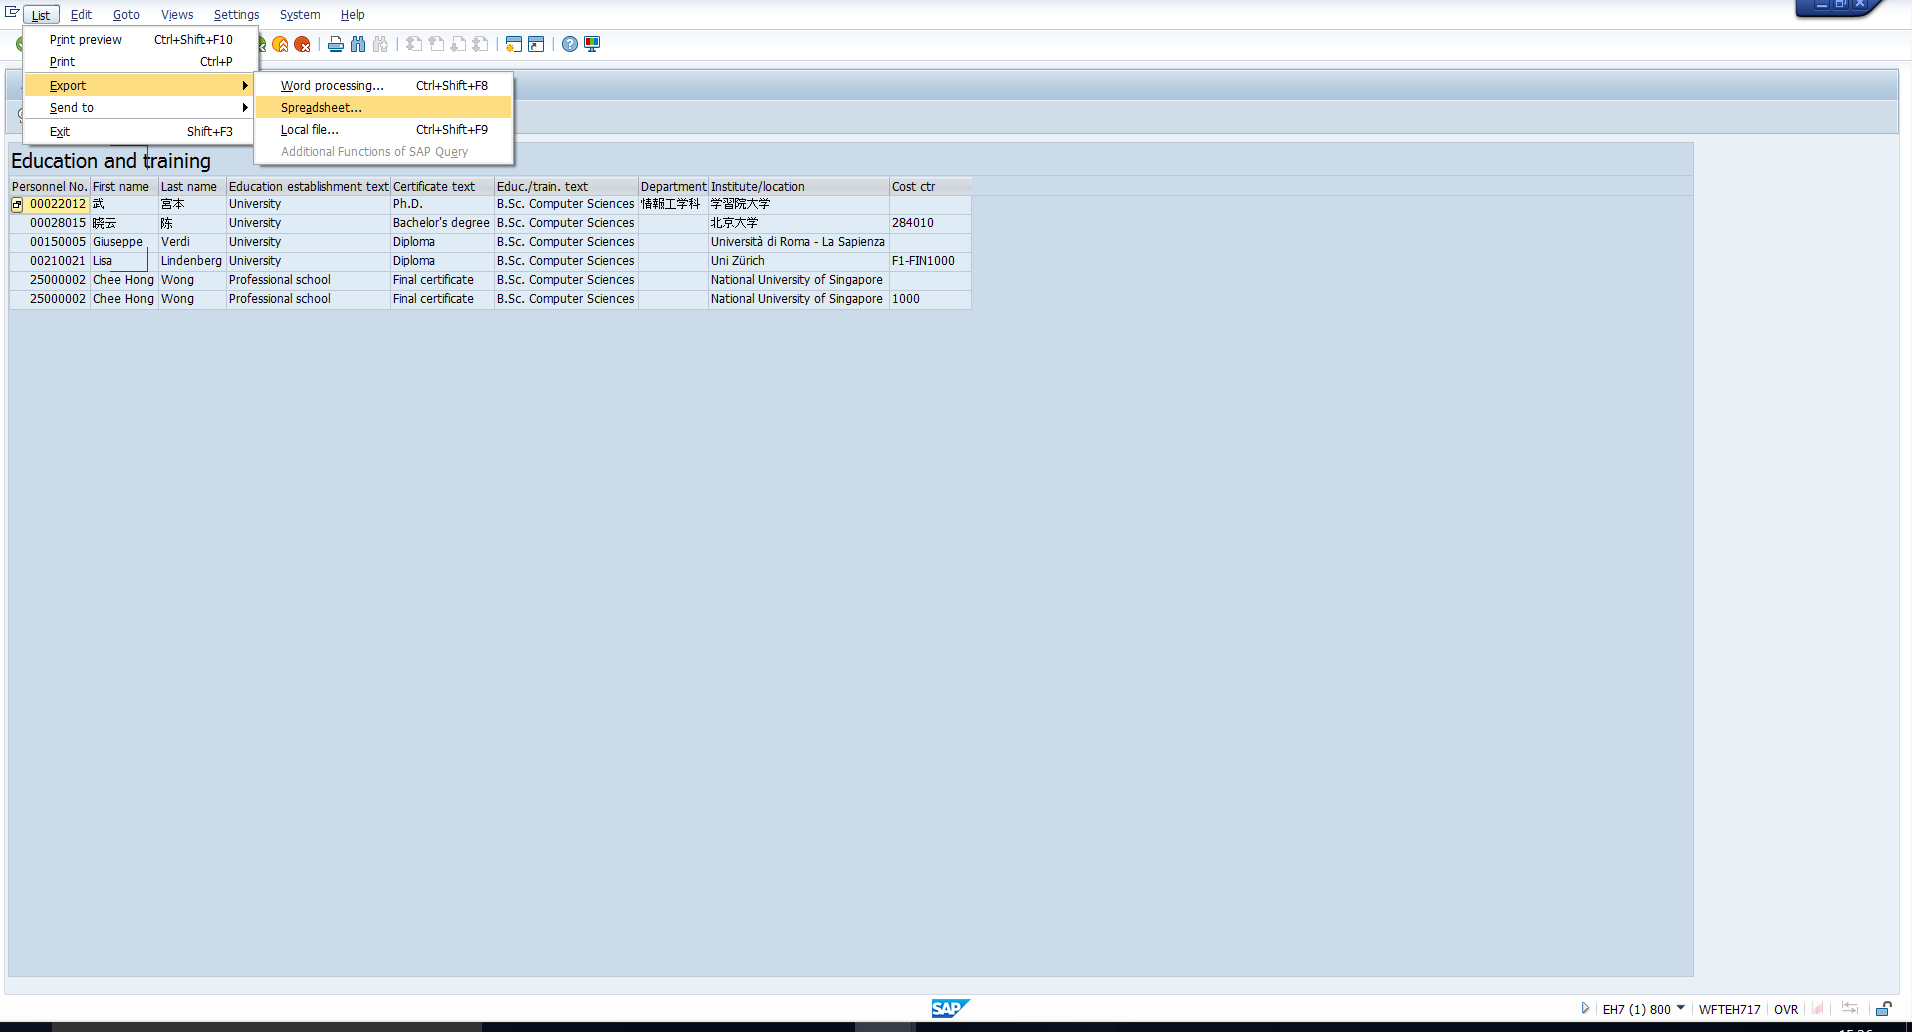 Figure 9: Export the Output to Excel
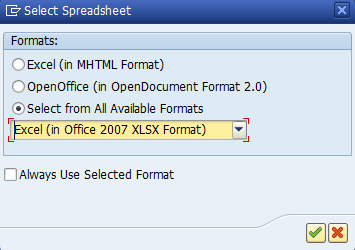 Figure 10: Export to Excel
Enter the file name and click on Save as shown in Figure 11.
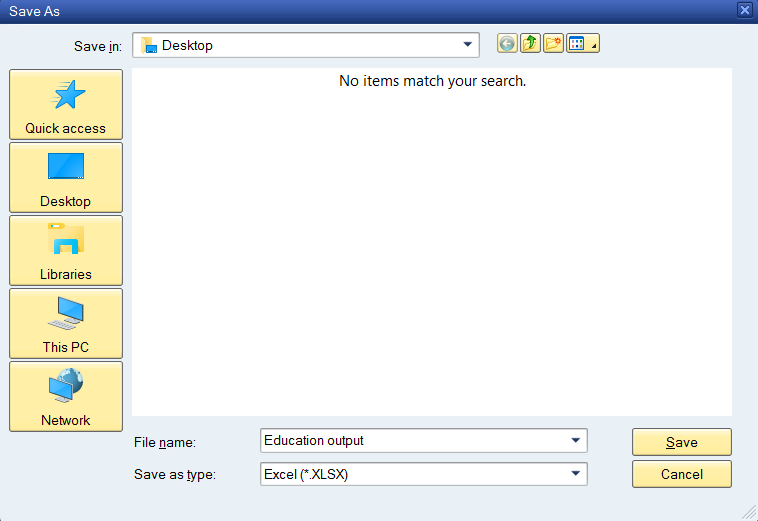 Figure 11: Save as Excel File
You can see the excel file as in Figure 12.
2. Employees Entered and Left Report
This report presents the details of employees who entered or separated from the organization within a specific period. Follow the path in Figure 13 or enter the transaction code highlighted in Figure 13 to execute this report.
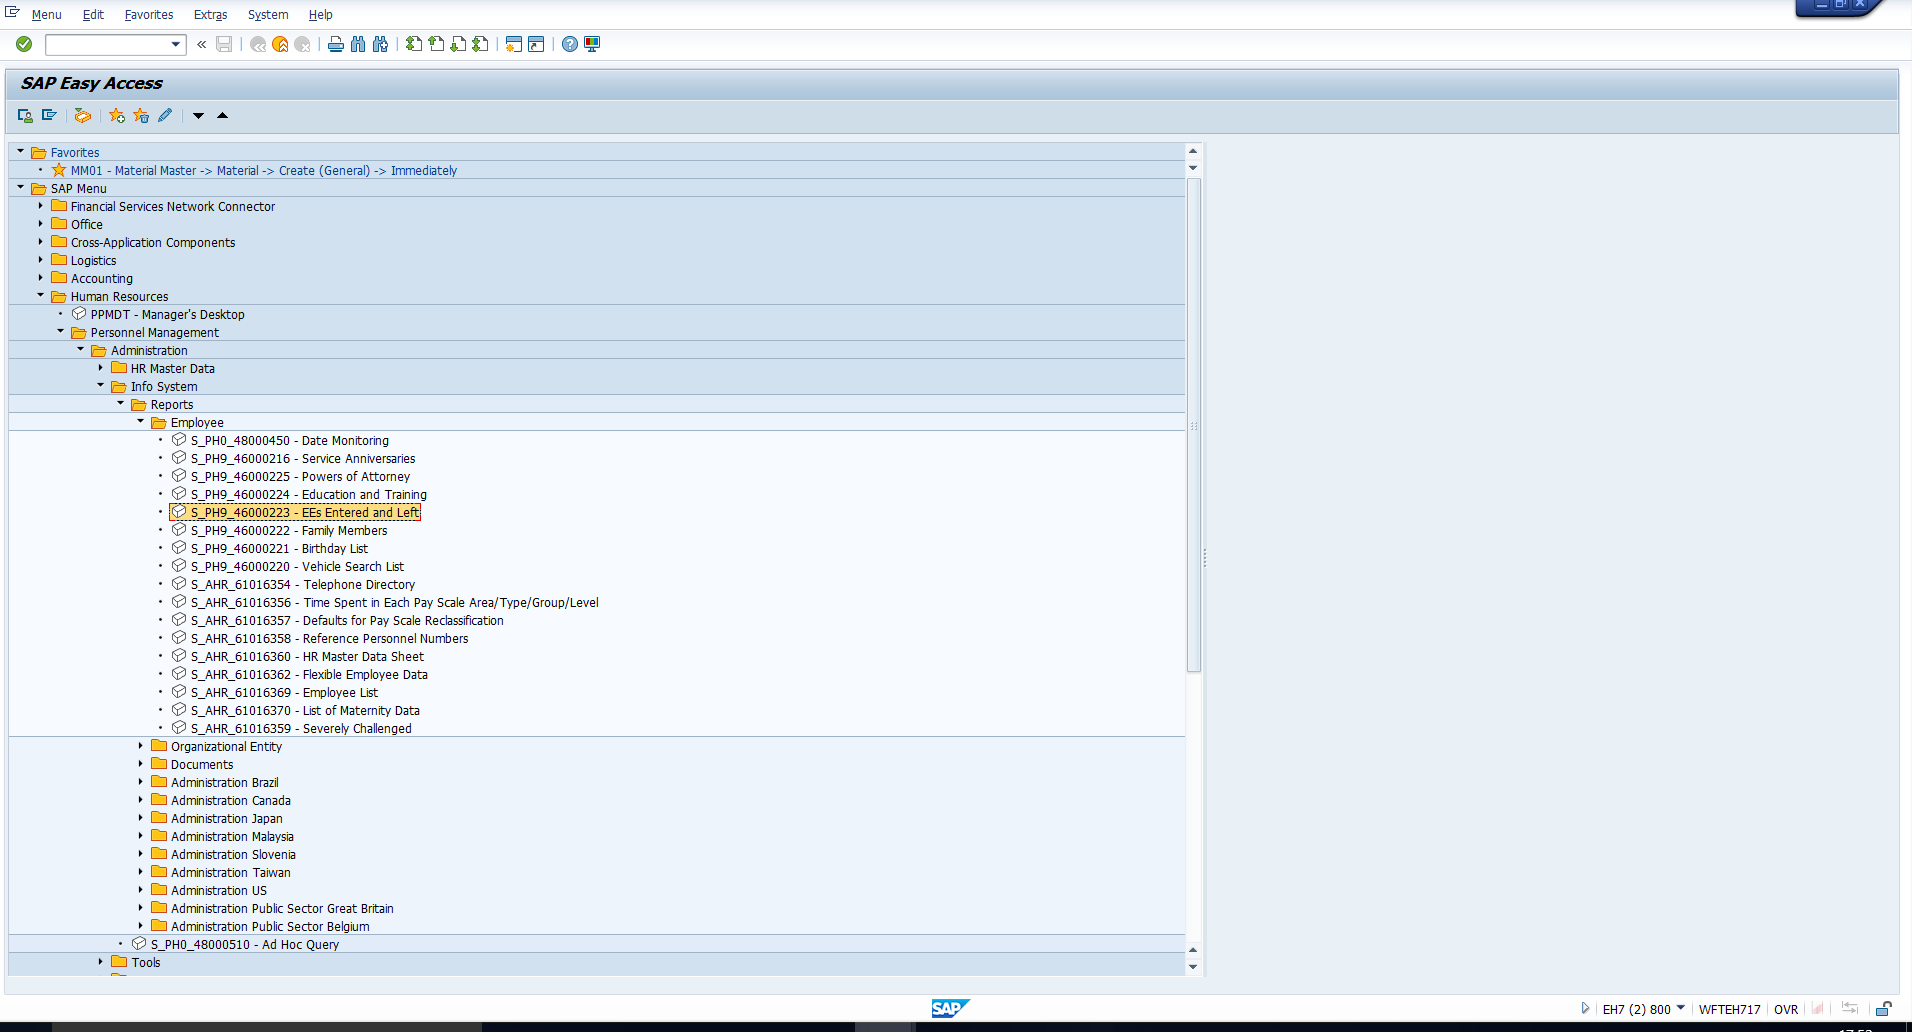 Figure 13:Employee Entered and Left
Assume that we want a list of Employees who joined the organization in Jan 2016. We can specify this entry period as shown in the selection screen in Figure 14.
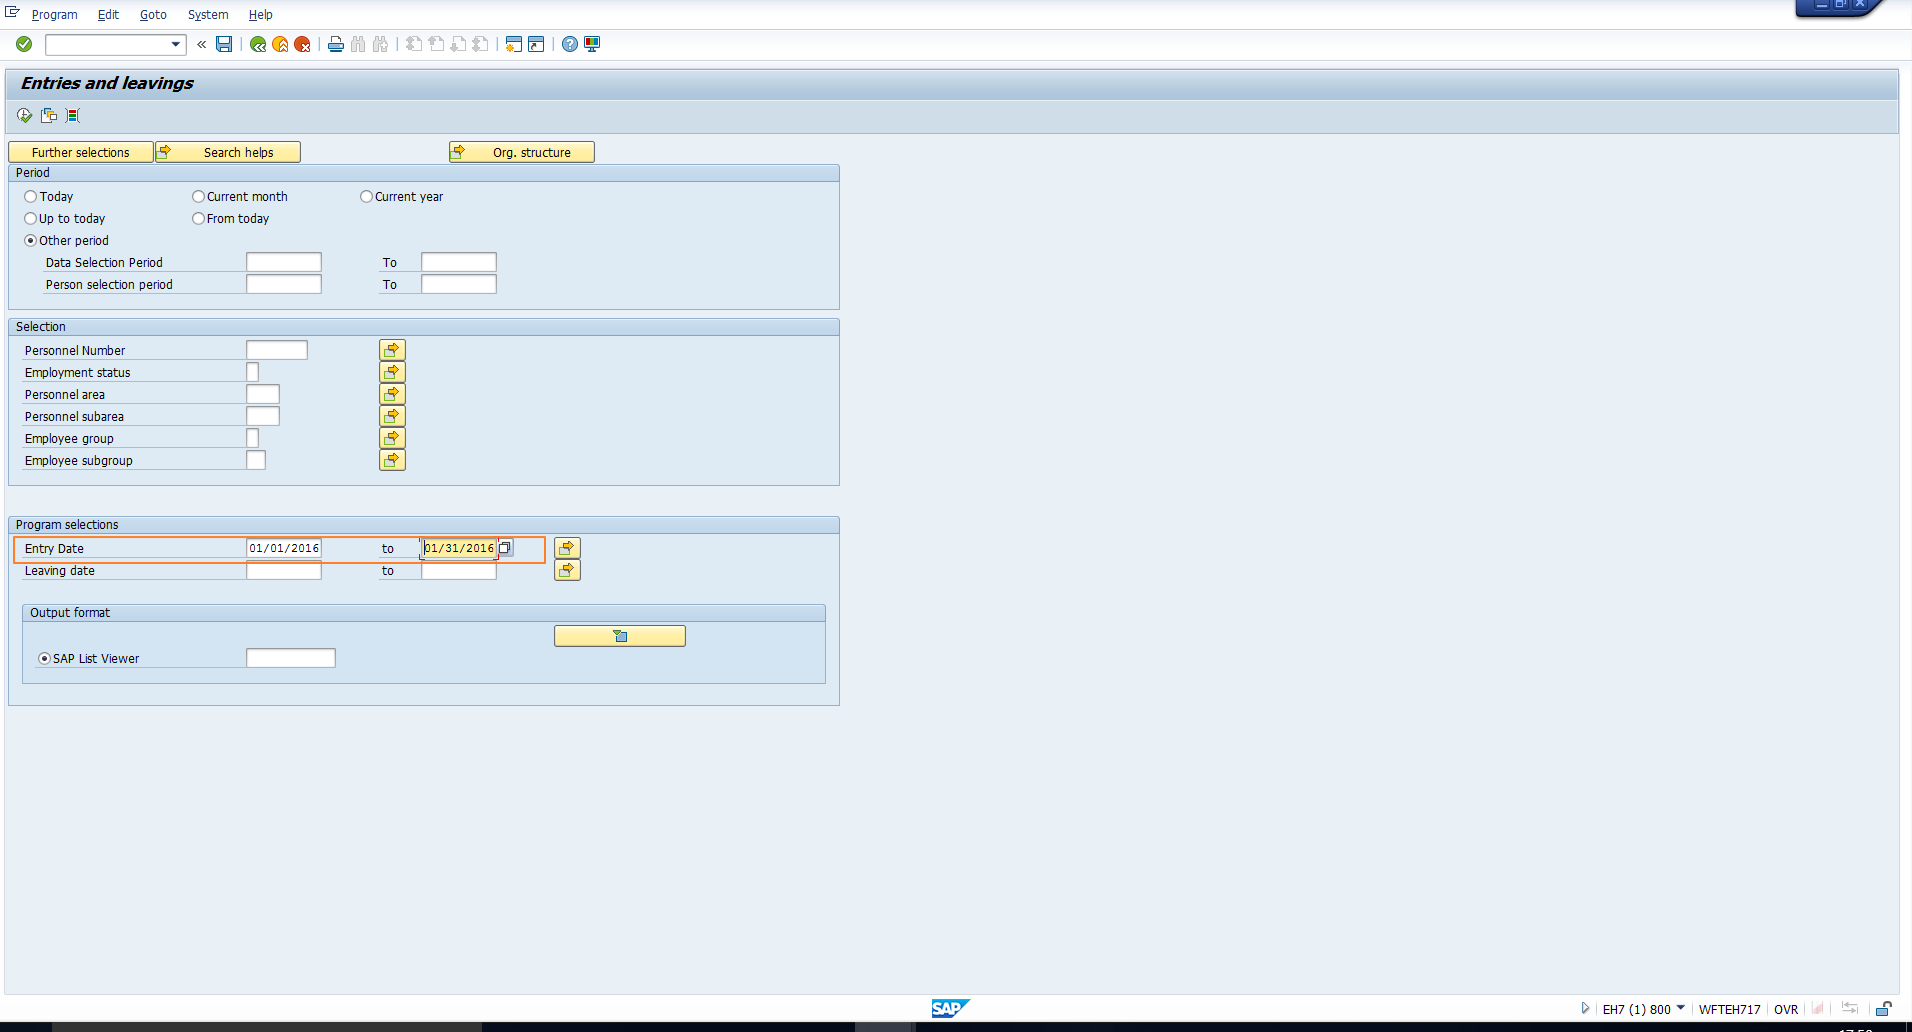 Figure 14: Employees Entered and Left – Selection Screen
On executing the report, the system displays a list of all employee whose entry date falls within the specified period as shown in Figure 15.
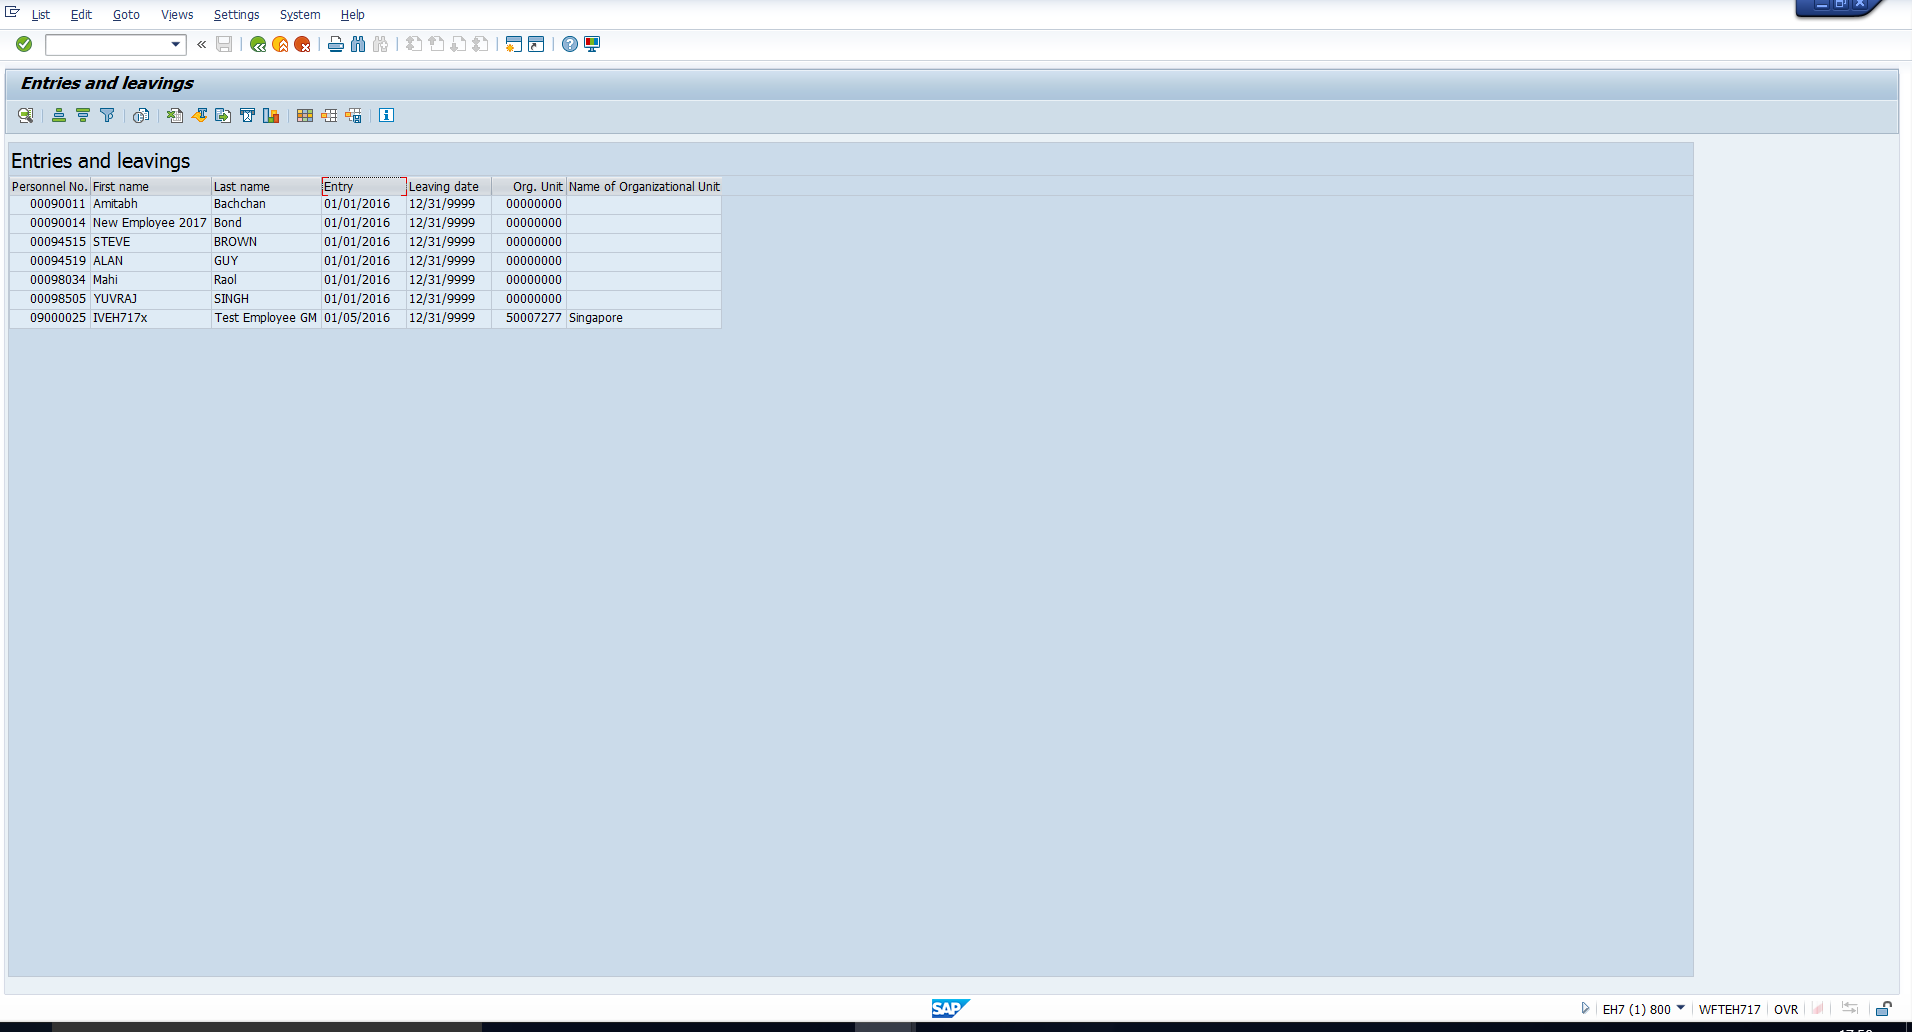 Figure 15: Employees Entered and Left – Output
3. Family Members Report
This report is used to extract information on employees’ family members as stored in the Family members/Dependants infotype. Follow the path in Figure 16 or enter the transaction code highlighted in Figure 16 to execute this report.
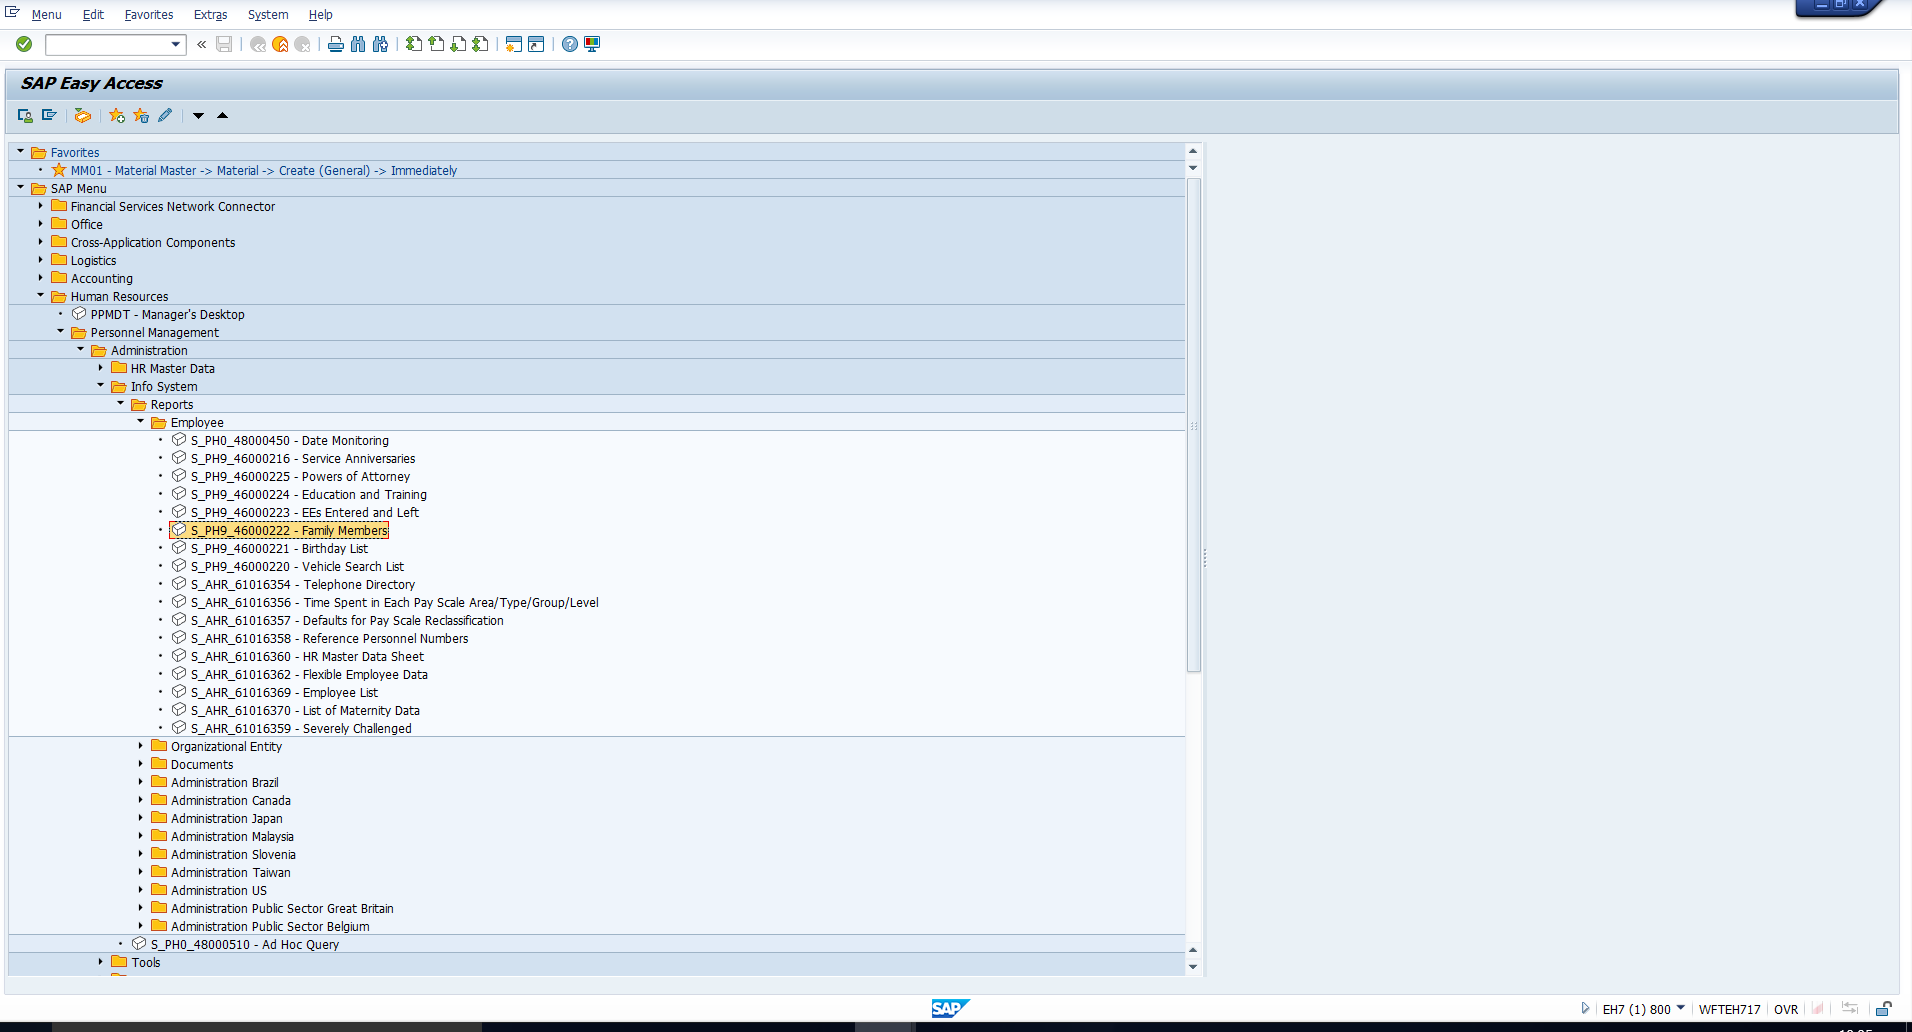 Figure 16: Family Members Report
For example, say we want to generate a list of spouses of all Retirees/Pensioners. We enter the appropriate selection field values – Employee group ‘Retiree /Pensioner’ as shown in Figure 17 and Type of family member ‘Spouse’ as shown in Figure 18.
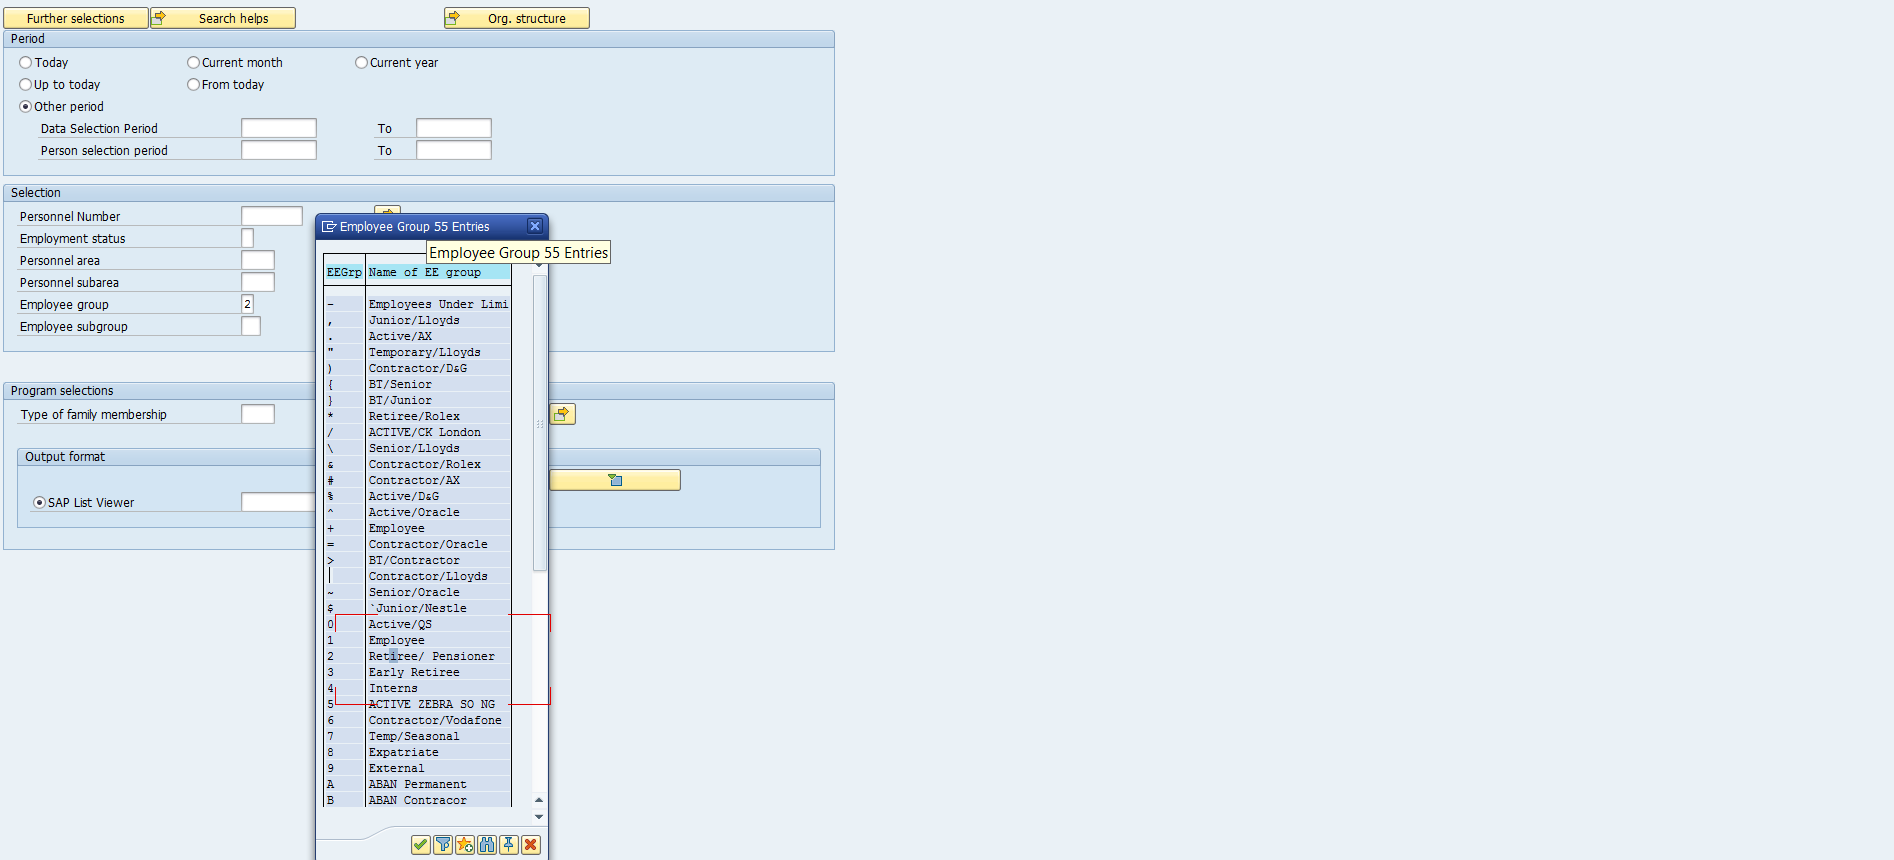 Figure 17: Family Members – Select Employee Group in Selection Screen
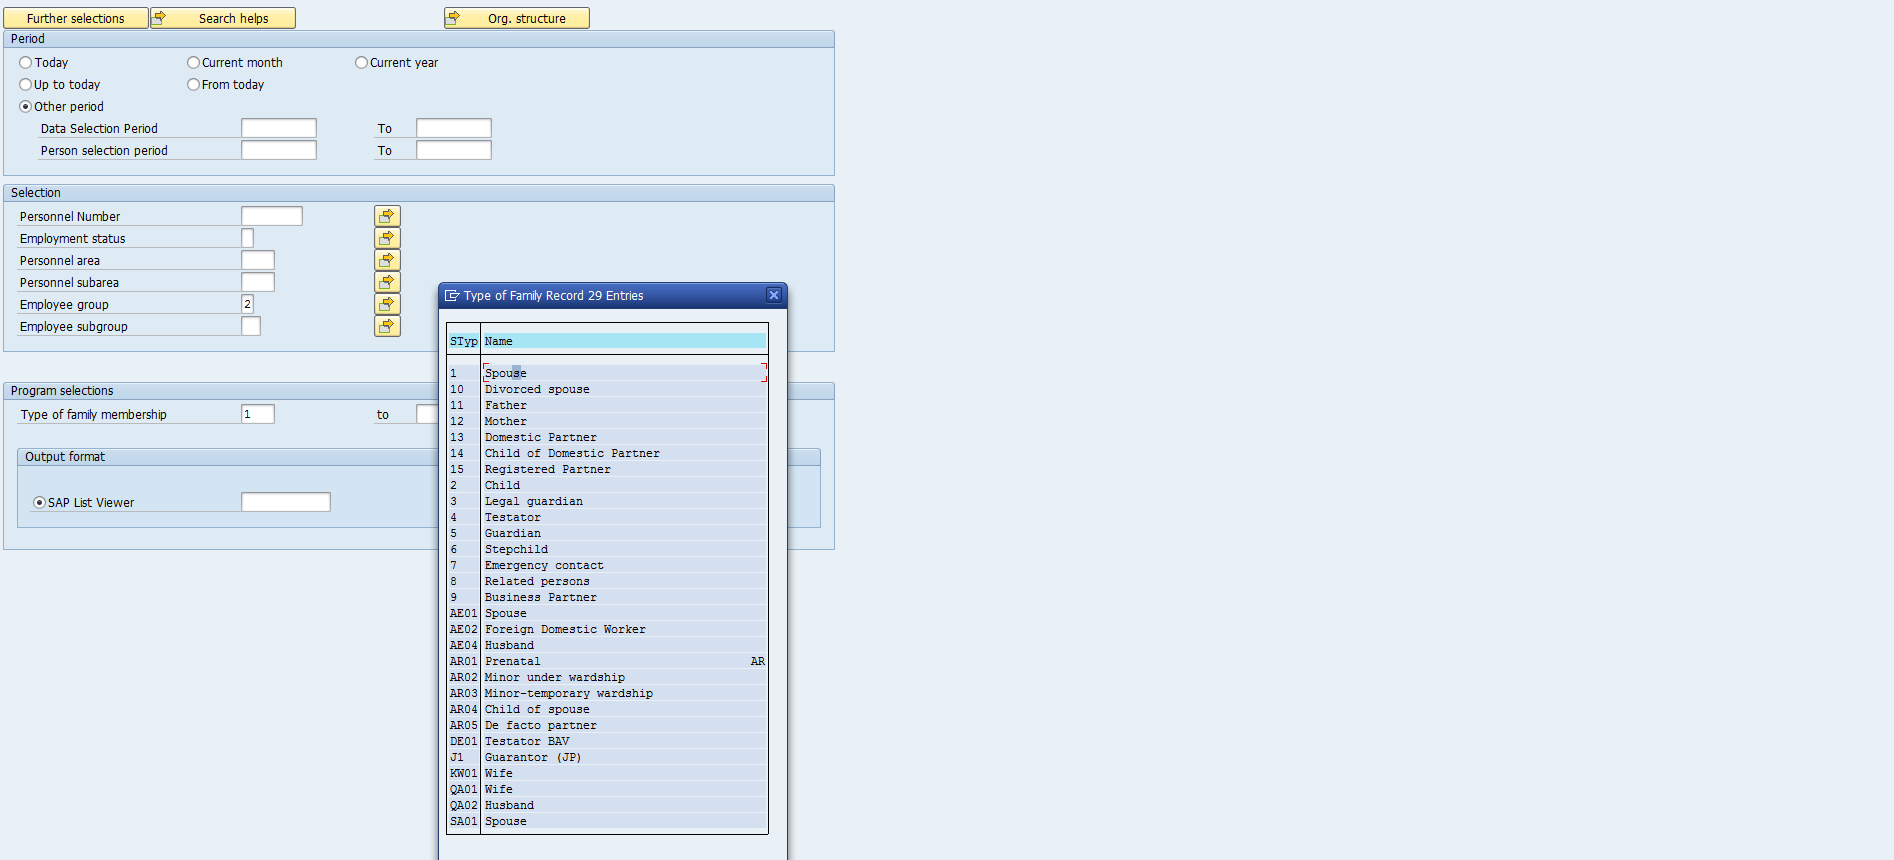 Figure 18: Select Type of Family Member in Selection Screen
On executing the report, we get the output displayed in Figure 19 which can then be extracted to Excel.
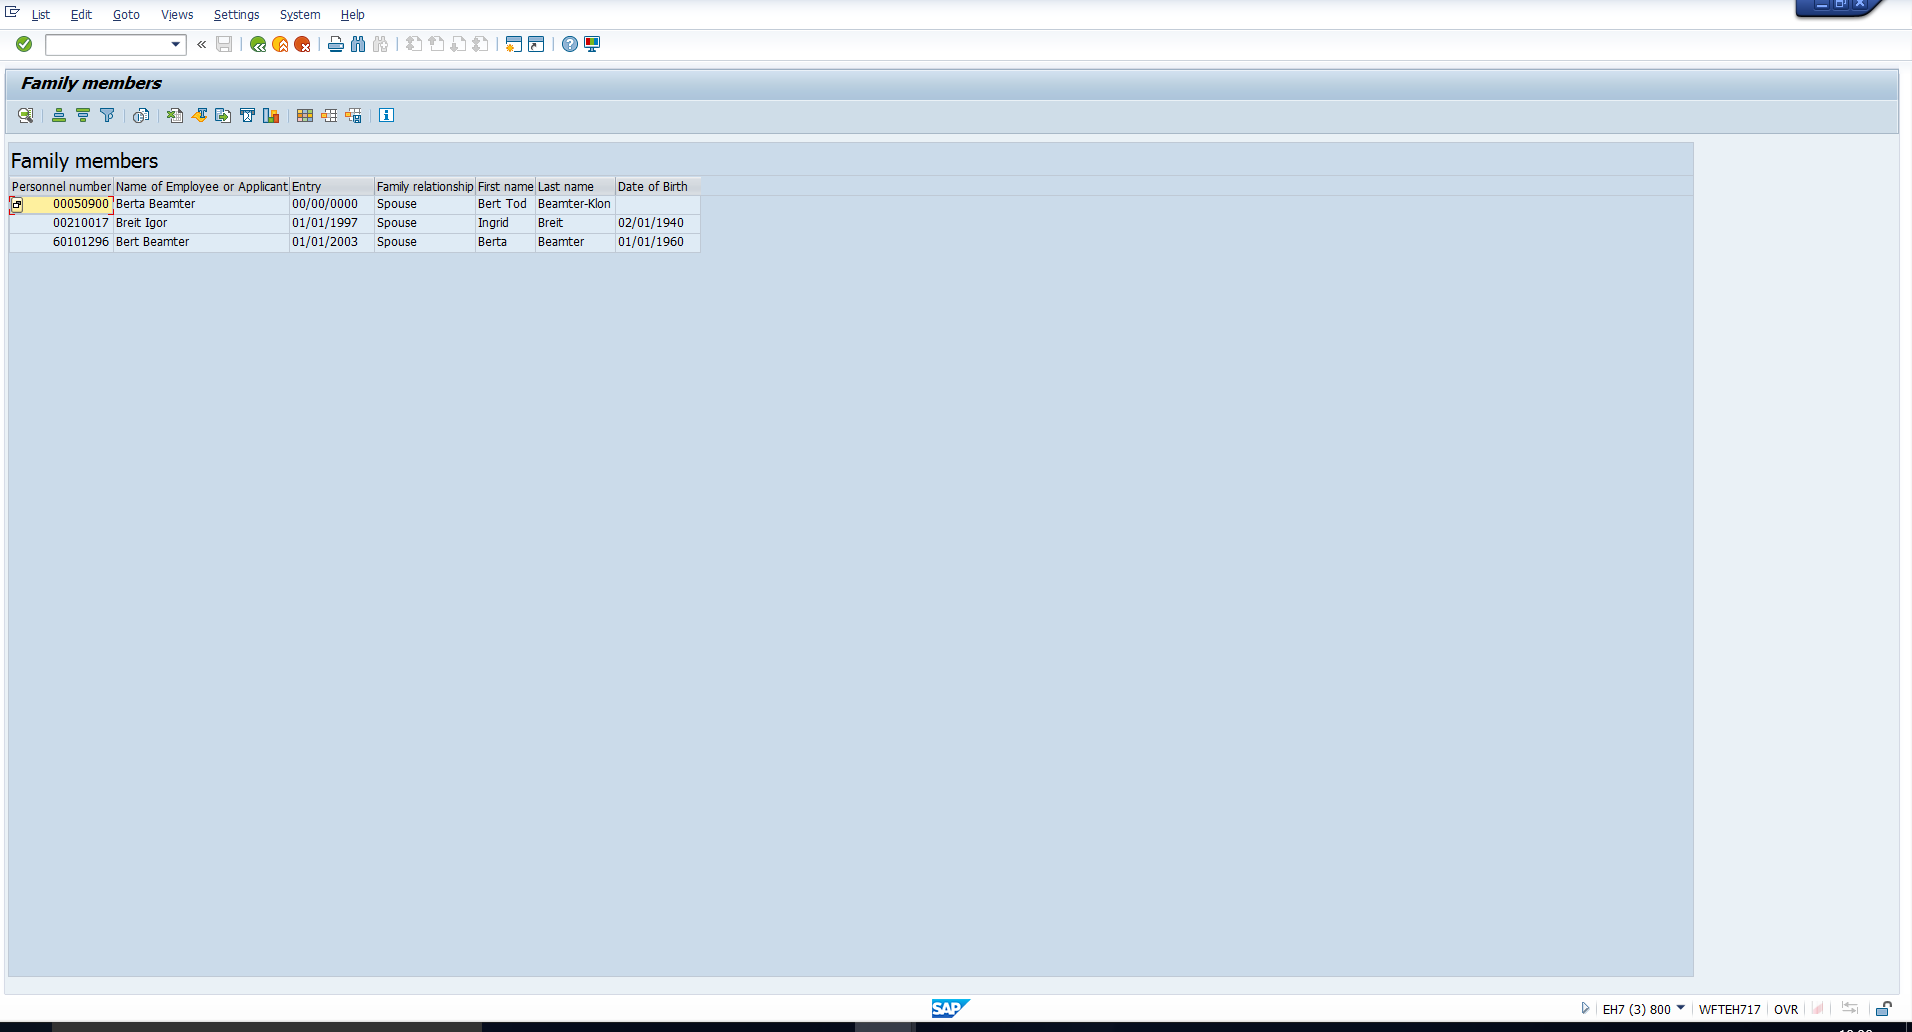 Figure 19: Family Members Output
4. Birthday List Report
We can obtain a list of employees’ birthdays using this report. Follow the path in Figure 20 or enter the transaction code highlighted in Figure 20 to execute this report.
As you can see in Figure 21, there are various selection criteria based on which you can fetch the birthday information. Assume that we want a list of all employees whose birthday is in January. So we enter ‘01’ in the Month of Birth field as shown in Figure 21.
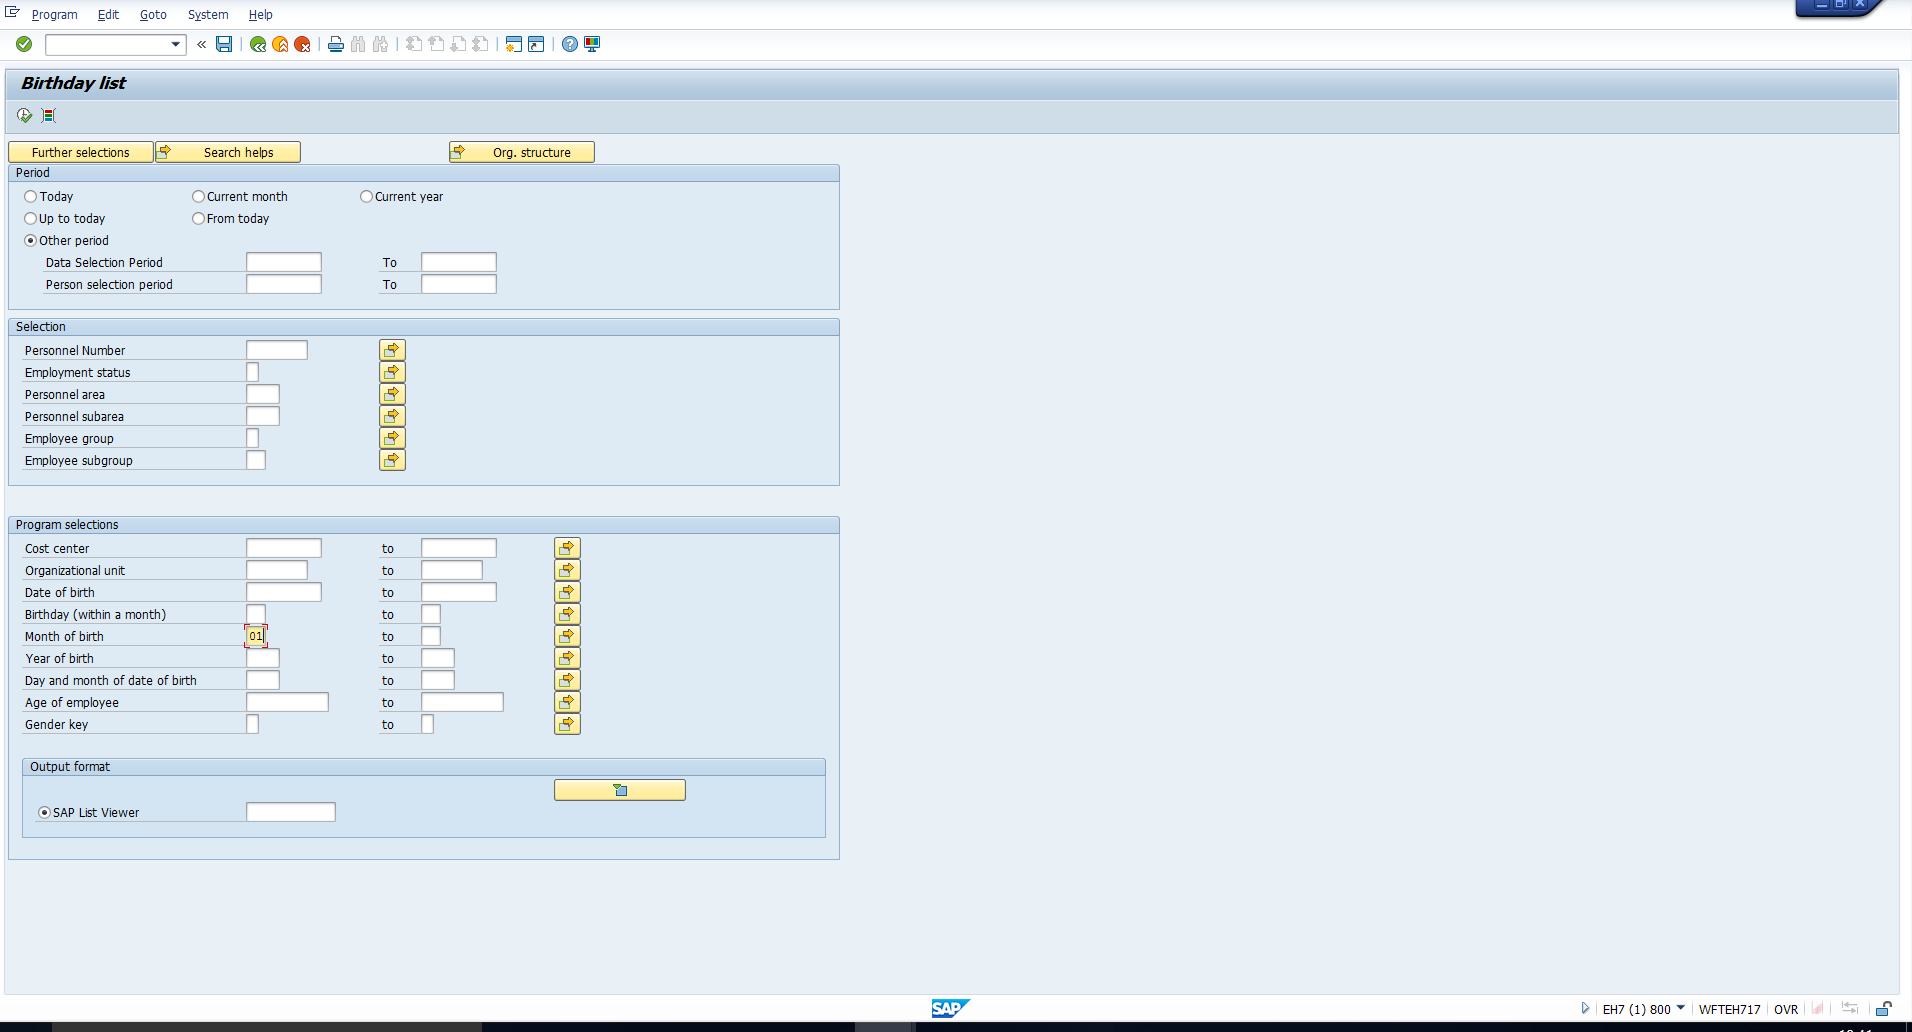 Figure 21: Birthday List Selection Screen
Executing this report gives us the desired list as shown in Figure 22.
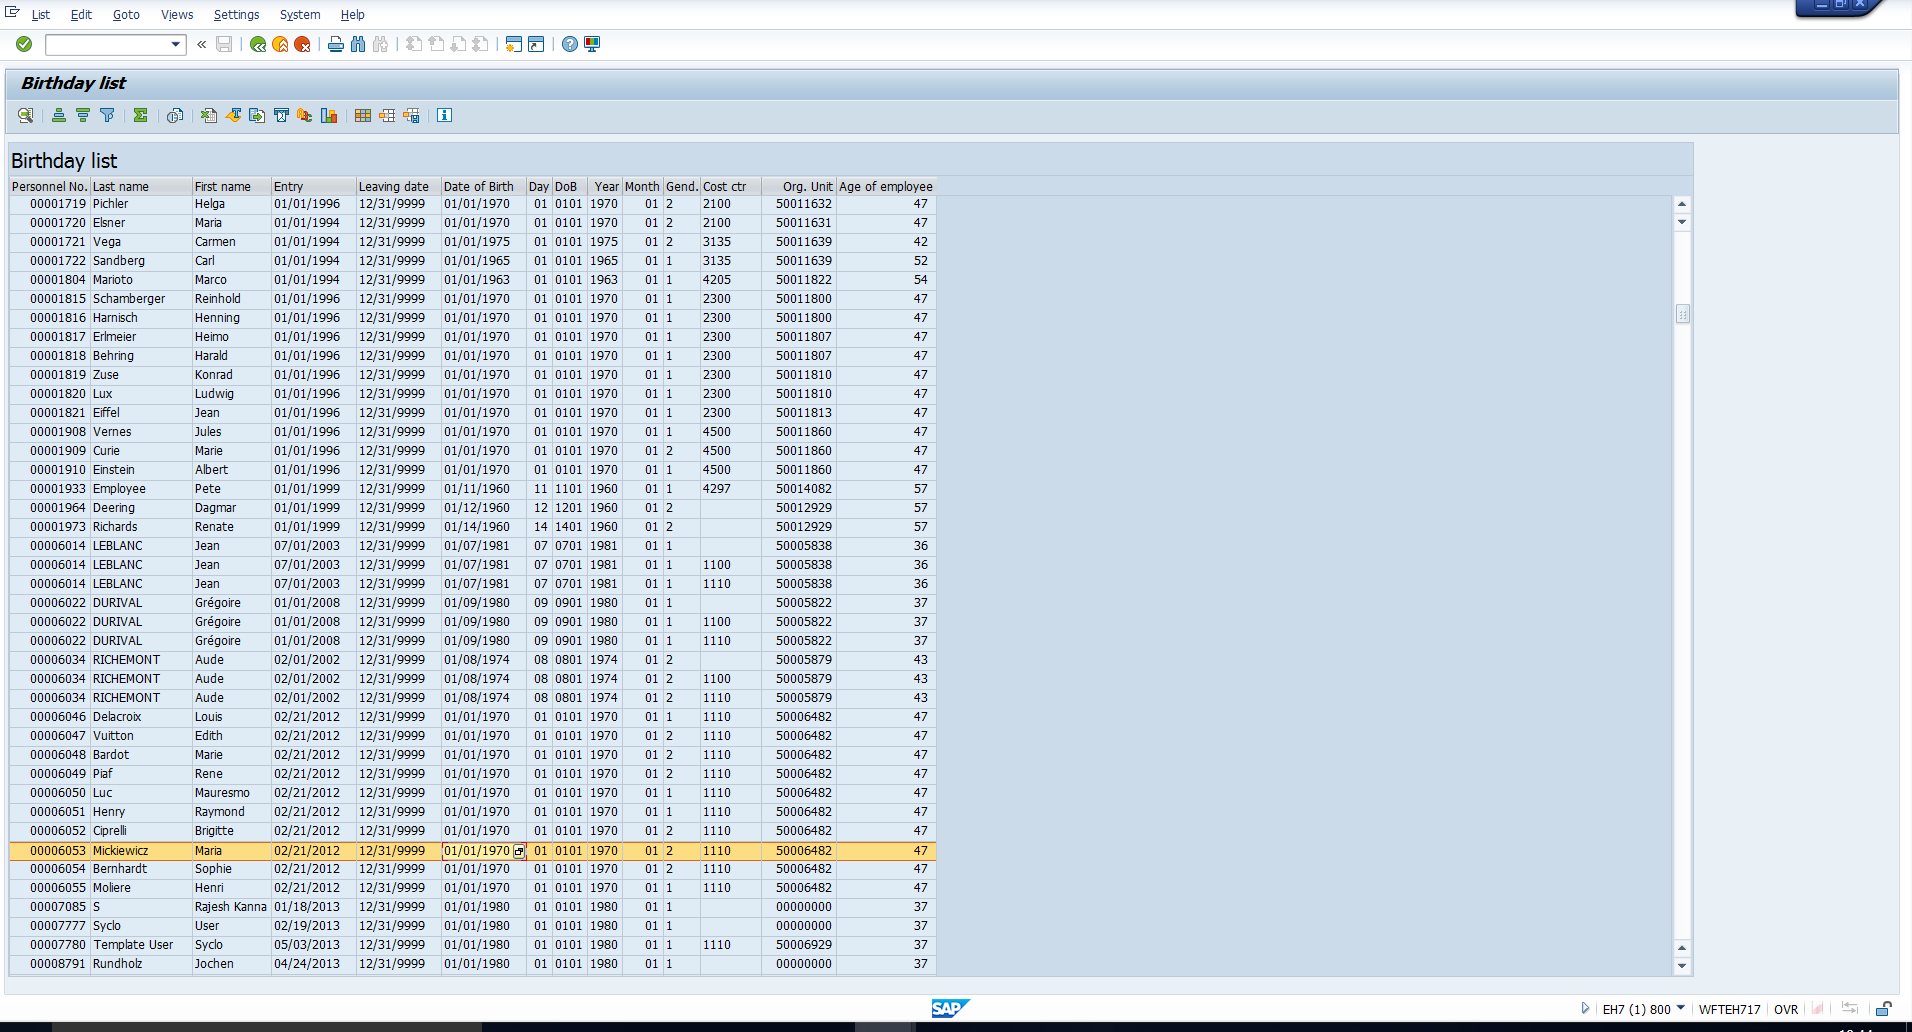 Figure 22: Birthday List Output
5. Flexible Employee Data Report
True to its name, this report allows a lot of flexibility in the choice of selection and output fields. Follow the path in Figure 23 or enter the transaction code highlighted in Figure 23 to execute this report.
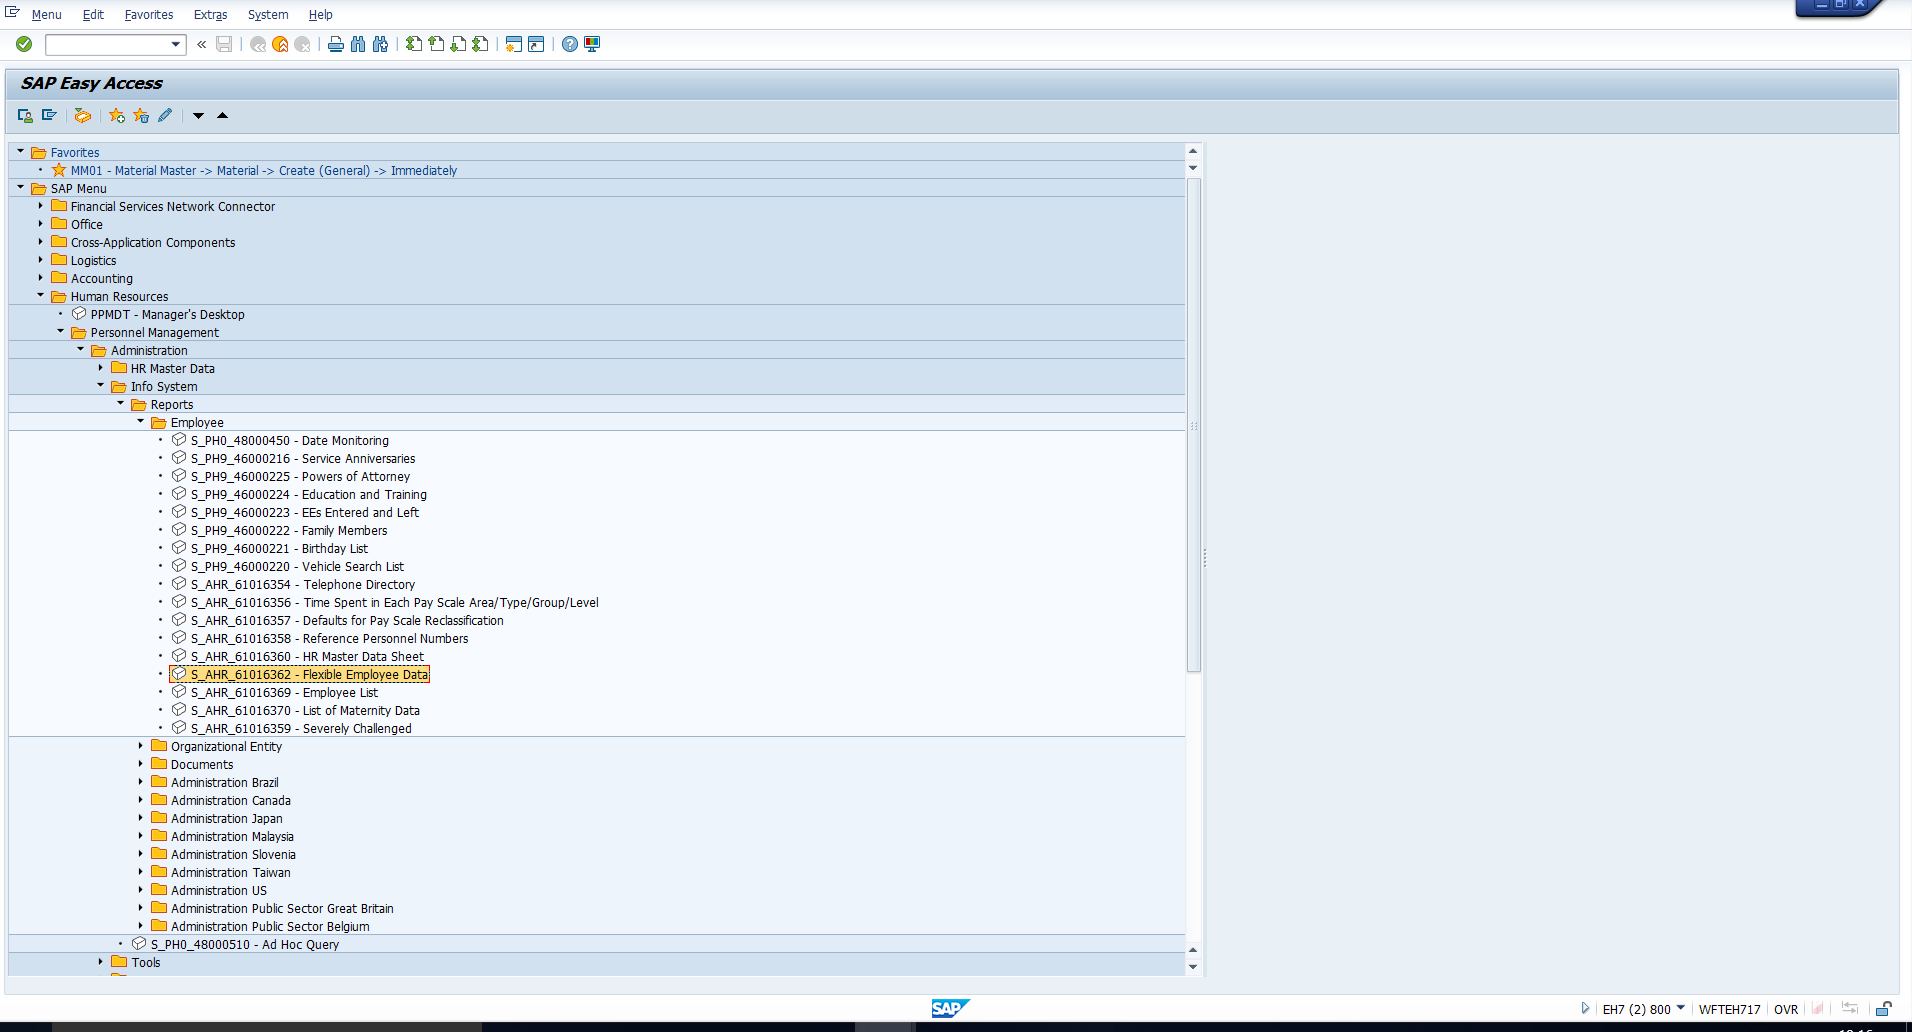 Figure 23: Flexible Employee Data
When you execute this report, it takes you to a seemingly limited selection screen. However, notice the ‘Further selections’ button highlighted in Figure 24. This button enables you to choose additional selection fields as per your organization’s requirement.
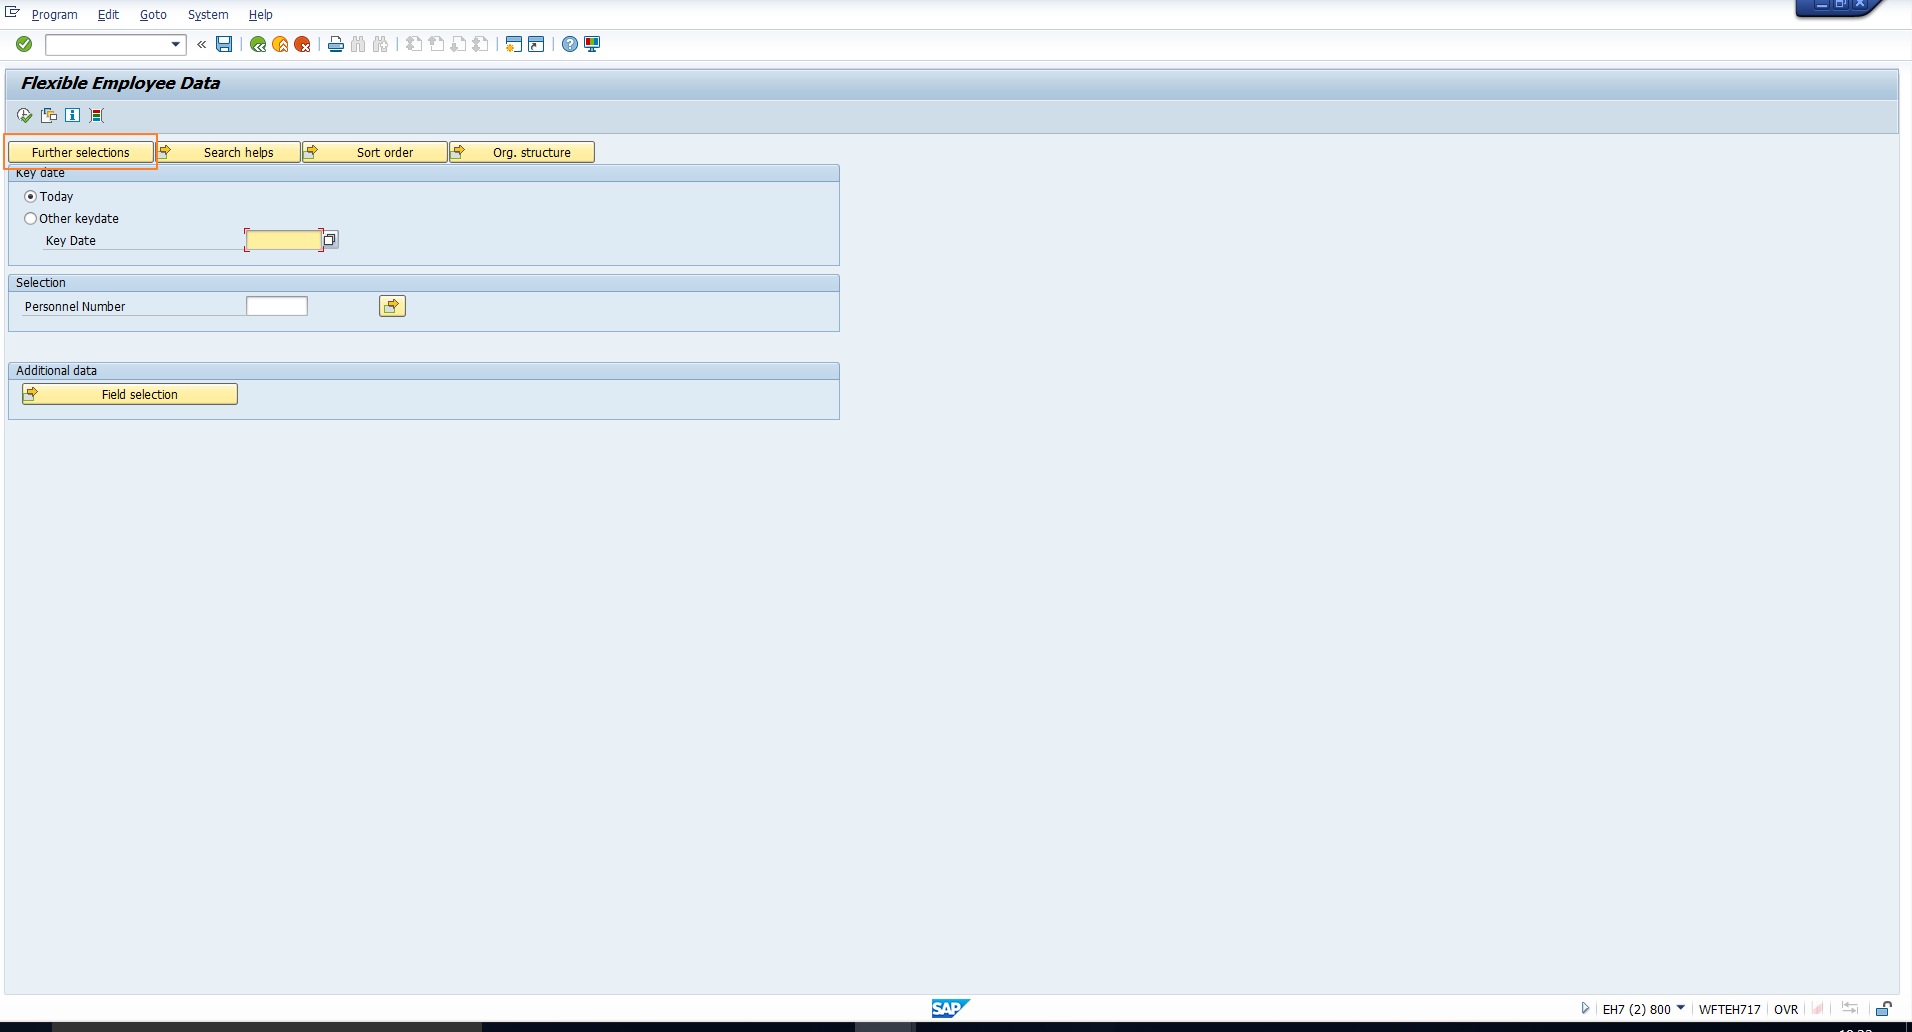 Figure 24: Selection Screen – Further Selections
In the ‘Choose Selection fields’ pop-up, there are two panes – the fields on the left are the selection options that you can choose from, while the pane on the right displays the chosen selection fields. You can go through the entire list on the left side to see which ones should be added as selection fields. Select the ones you want, then click on the Right arrow button highlighted in Figure 25. This will move the selection option to the right side, which effectively changes it to a selection field.
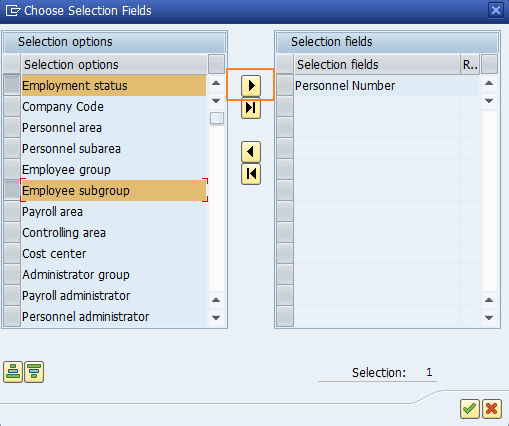 Figure 25: Choose Selection Fields
You can see the selection options that we have chosen as selection fields in Figure 26.
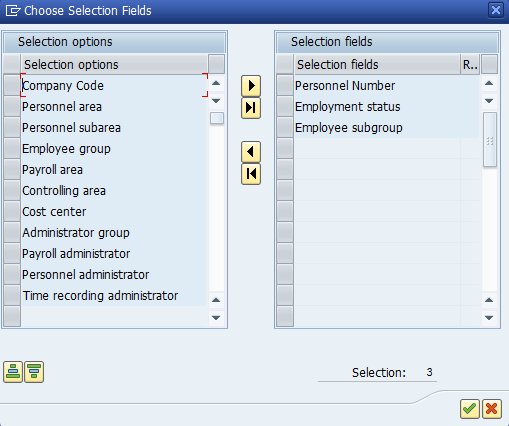 Figure 26: Chosen Selection Fields
On clicking enter, you can see that the fields we chose in Figure 26 are now displayed as selection screen fields in Figure 27.
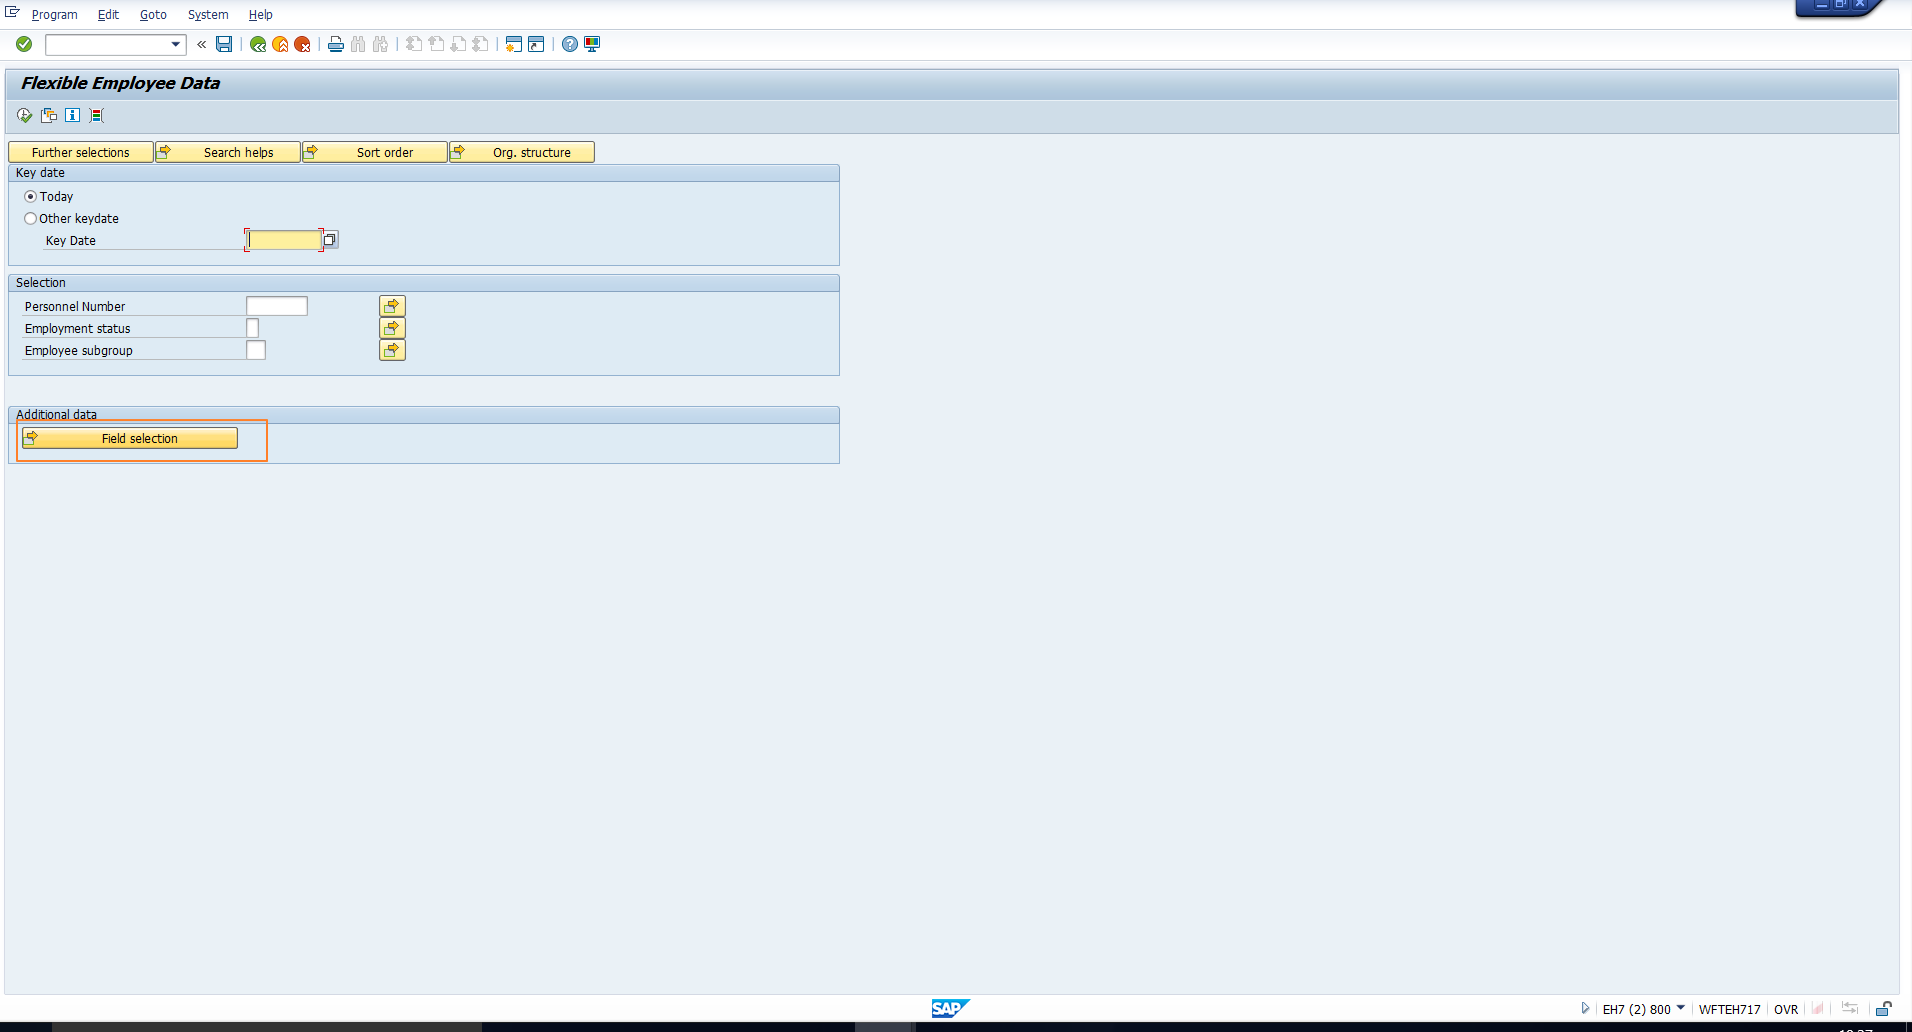 Figure 27: New Selection Fields Visible
Next, check the highlighted button ‘Field selection’ in Figure 27. This button enables you to choose the fields that you want in the report output.
In Figure 28, the left pane denotes the selectable fields. You can choose the fields that should appear in the report output, and then click on the Right arrow button to convert them to Selected fields on the right pane. Once the fields are visible on the right pane, it implies that they will be displayed in the output of the report. This is depicted in Figures 28 and 29.
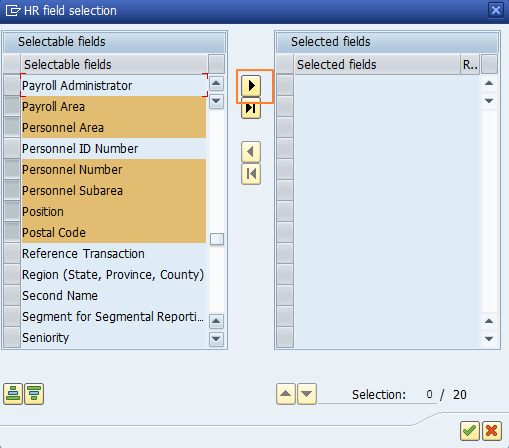 Figure 28: Select Output Fields
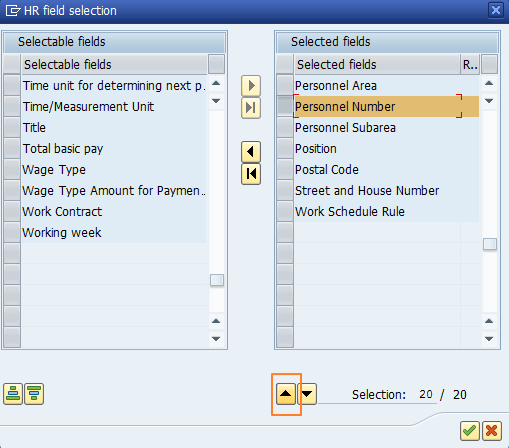 Figure 29: Output Fields selected
Also, you can see the highlighted Arrow button in Figure 29. This allows you to change the sequence in which the fields will be displayed in the Output. As an example, we have moved the Personnel number upwards. You can see the new output sequence in Figure 30.
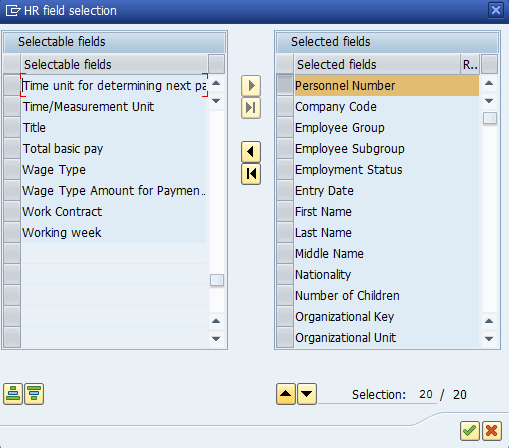 Figure 30: Output Sequence Updated
Having chosen the selection and output fields, we can now enter the desired selection values as in Figure 31.
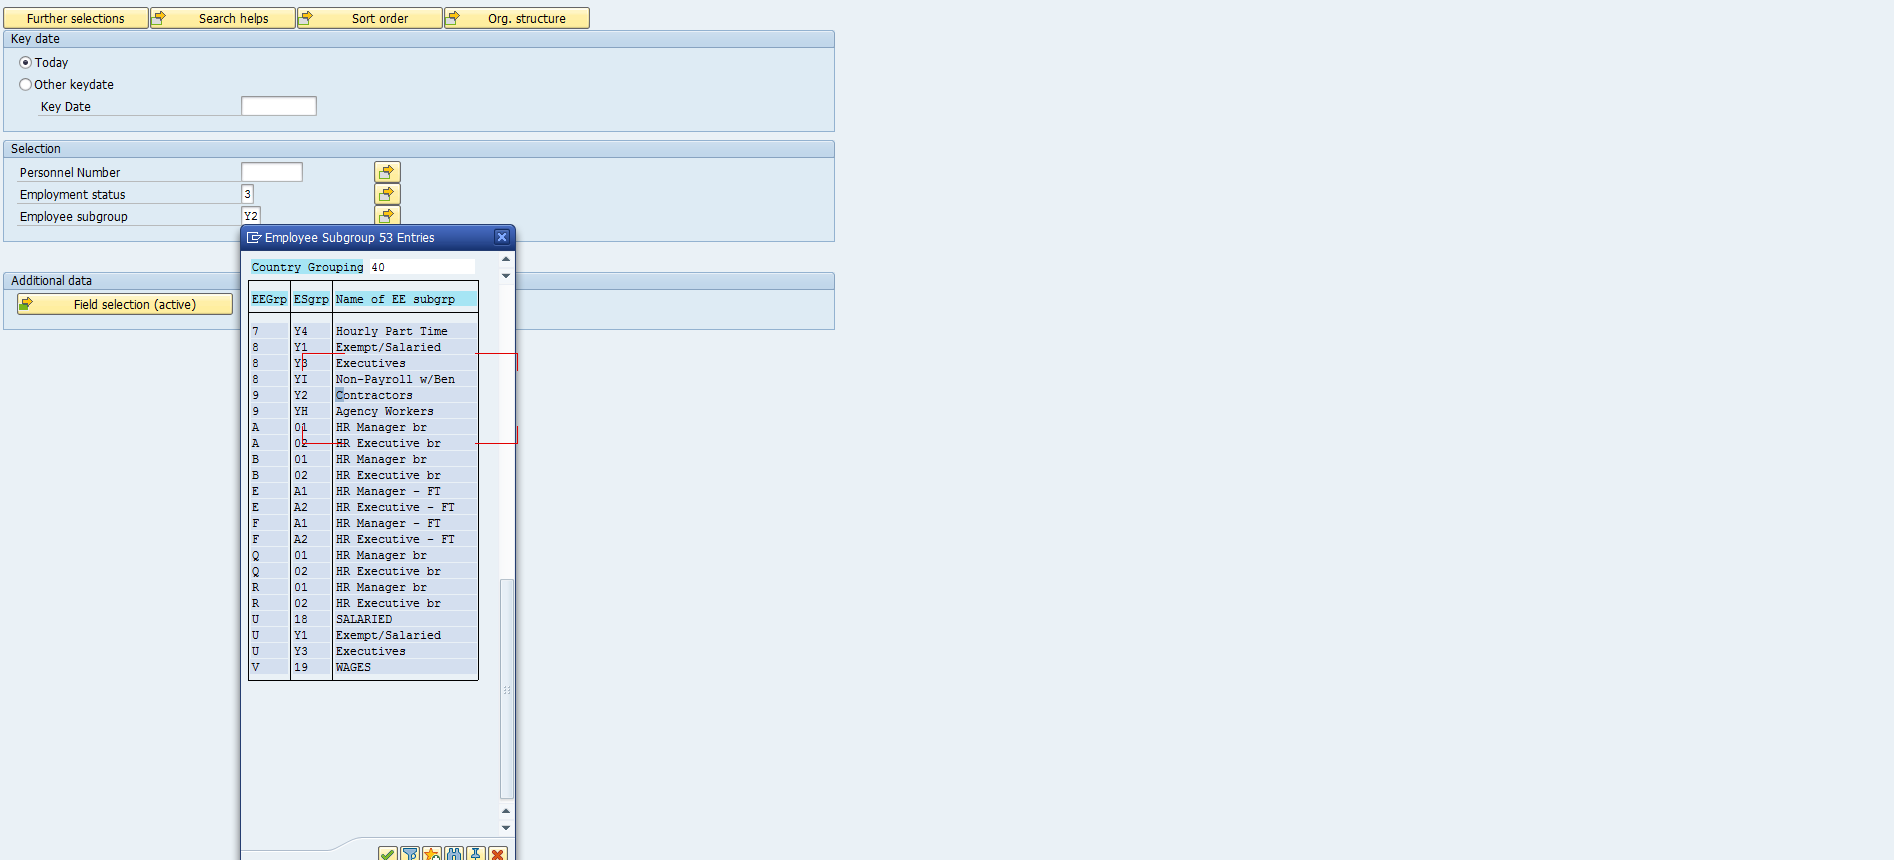 Figure 31: Enter Selection Values
We can see the report output in Figure 32. Note the highlighted icon in this figure. This icon can also be used to change the layout of the output. So, changing the sequence of columns as we had done in Figure 30 can also be done from here.
Clicking this icon takes us to the pop-up in Figure 33, where you can use the arrow buttons to change the output sequence. We have shifted the name columns earlier in the output, and you can see the result of doing this in Figure 34.
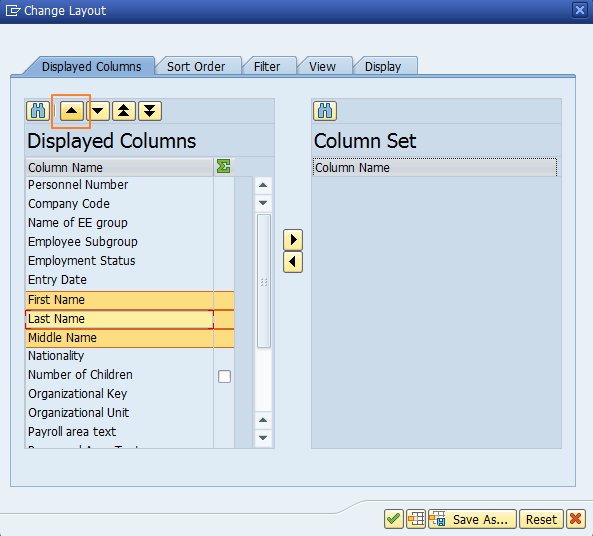 Figure 33: Change Layout
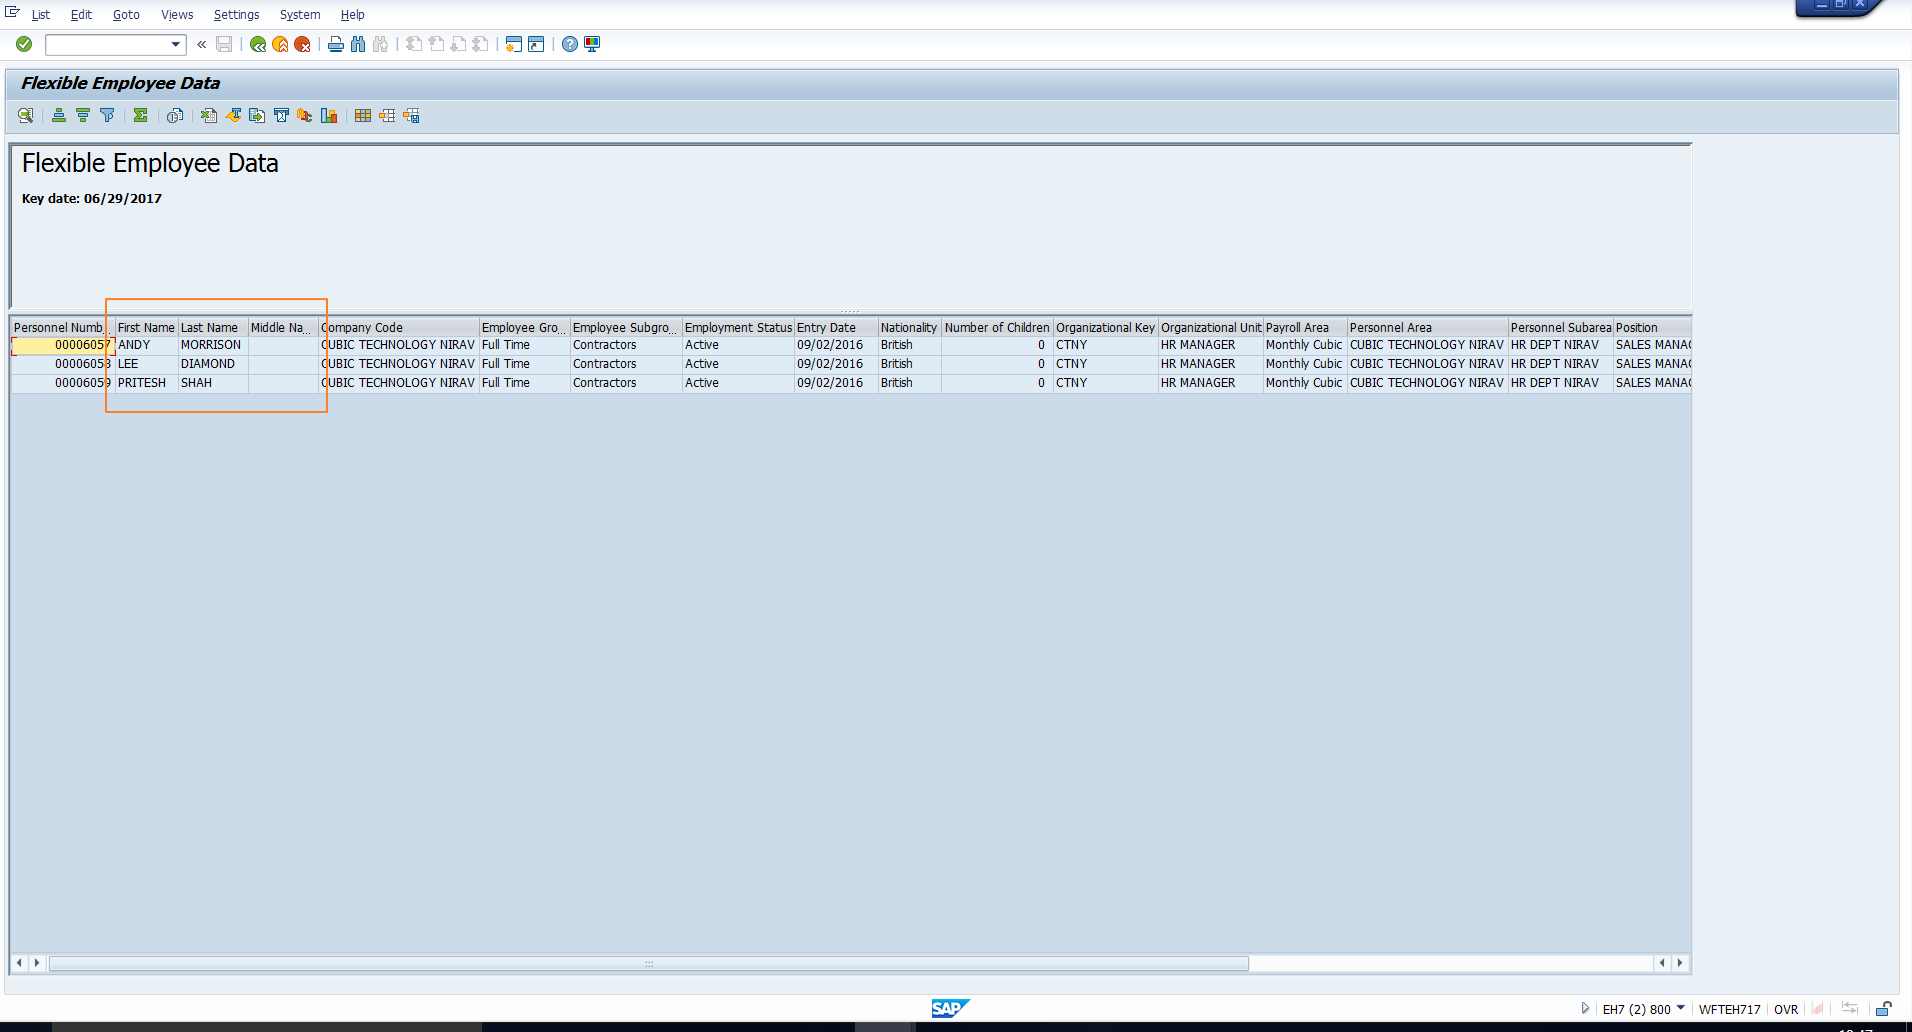 Figure 34: Output Layout Changed
—