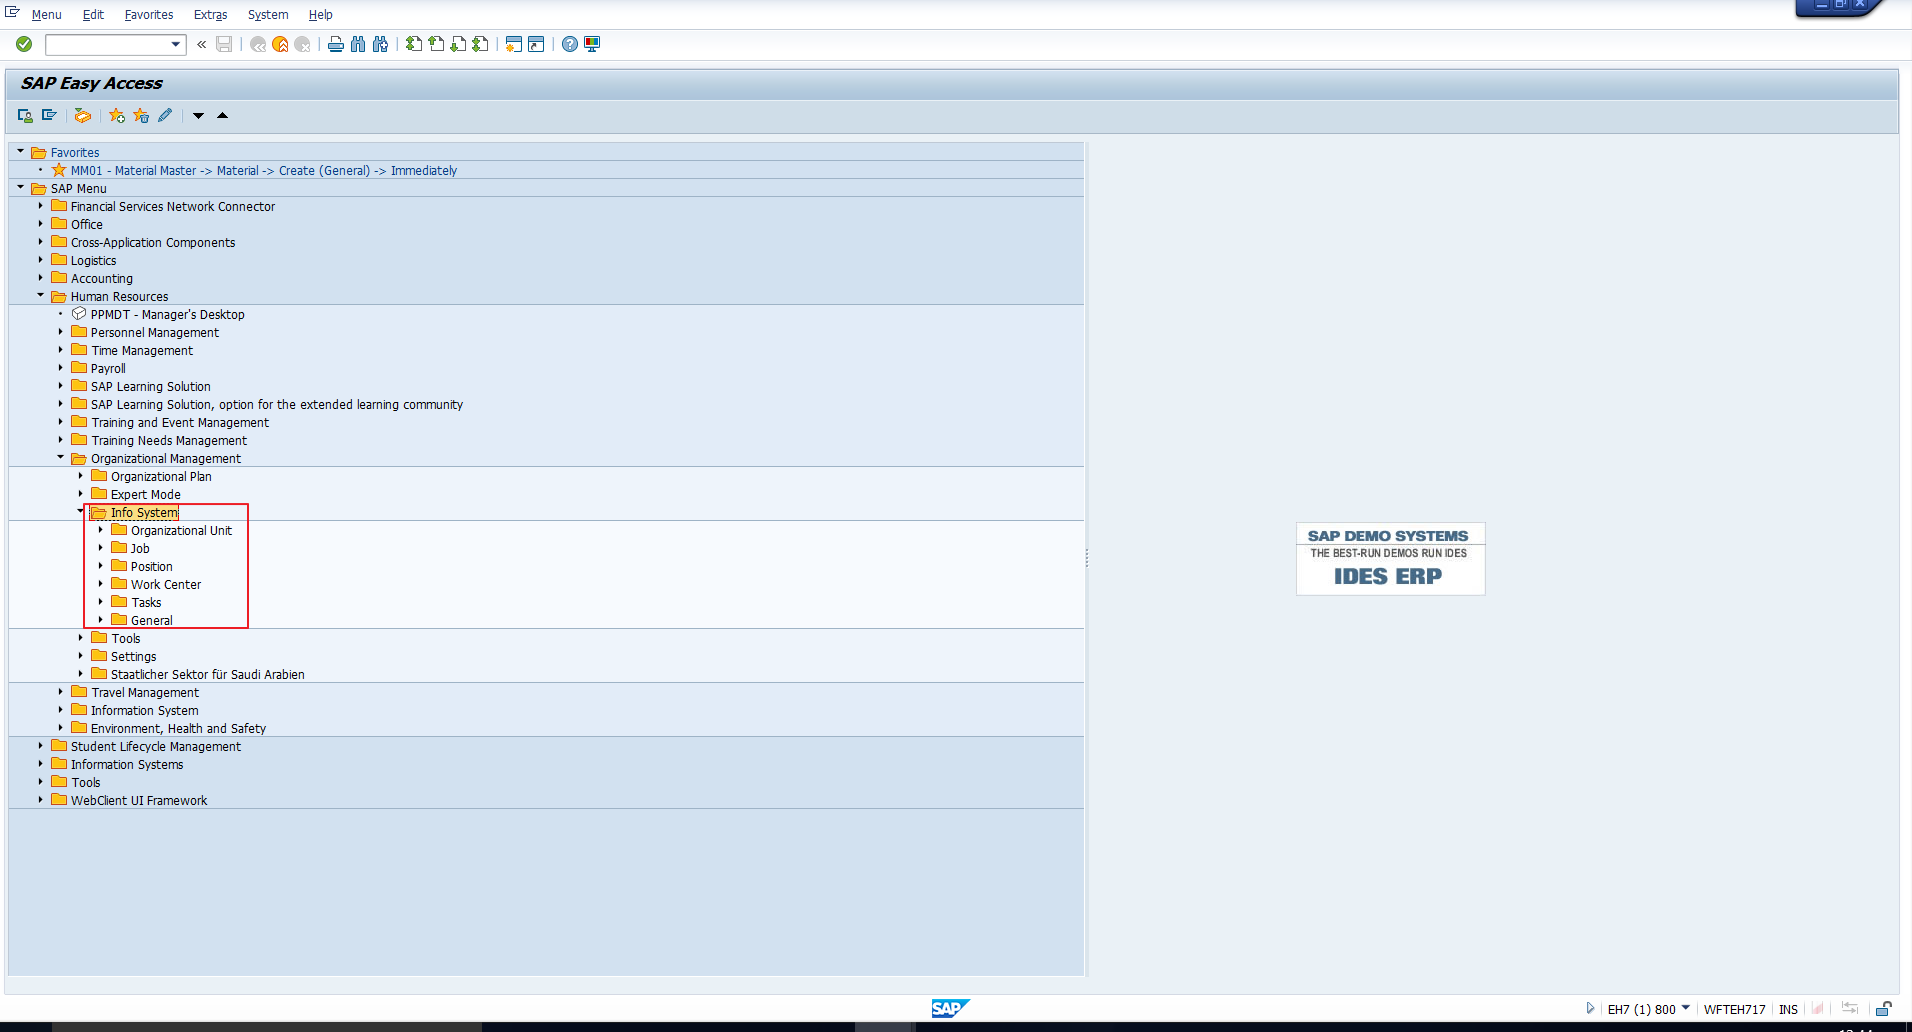
 Figure 1: Info System
Welcome to the tutorial on SAP Organizational Management Reports. SAP provides a number of standard reports. Whenever you receive a reporting requirement, you should first explore all the standard SAP reports. If these do not meet your requirements, then you can consider designing an Ad Hoc query or a customized report. This tutorial is part of our free SAP HCM training.
In the tutorial on SAP Personnel Administration Reports, we listed out the three broad steps in the reporting process. Similarly, reporting in SAP Organizational Management also involves these steps:
1. Selection
After entering the report transaction code, the initial screen that you see is the report Selection Screen. This screen is an input screen which includes selection fields, wherein you can enter your selection criteria. For example, you can specify the object type for which you want to execute the report.
2. Processing
Based on the selection values entered, the system reads data from various Organizational Management infotypes. It then processes it in accordance with the built-in reporting logic to obtain the output data.
3. Output
The output may be displayed as a structure, ALV grid, or any other format, depending on the report. Most reports allow you to print the output, as well as to export it to MS Excel.
The standard SAP Organizational Management reports can be accessed through the below mentioned SAP Easy Access path:
Human Resources – Organizational Management – Info System
You can look at Figure 1 which depicts this. Notice how, within the Info System folder, there is a segregation of reports based on object type. Hence there are different folders for reports pertaining to organizational units, jobs, positions, work centers, tasks. If you expand each folder, you will see the list of reports applicable to that object type.
In addition, there is a common folder titled “General”, which contains reports that are not specific to any object type.
In this section, we will take you through some useful standard reports in Organizational Management.
1. Organizational Structure
This is one of the most requested-for reports in Organizational Management. Most companies need a convenient way to download the organizational chart. To execute this report, follow the below path in the SAP Easy Access screen:
Human Resources – Organizational Management – Info System – Organizational unit – Organizational structure – Organizational Structure
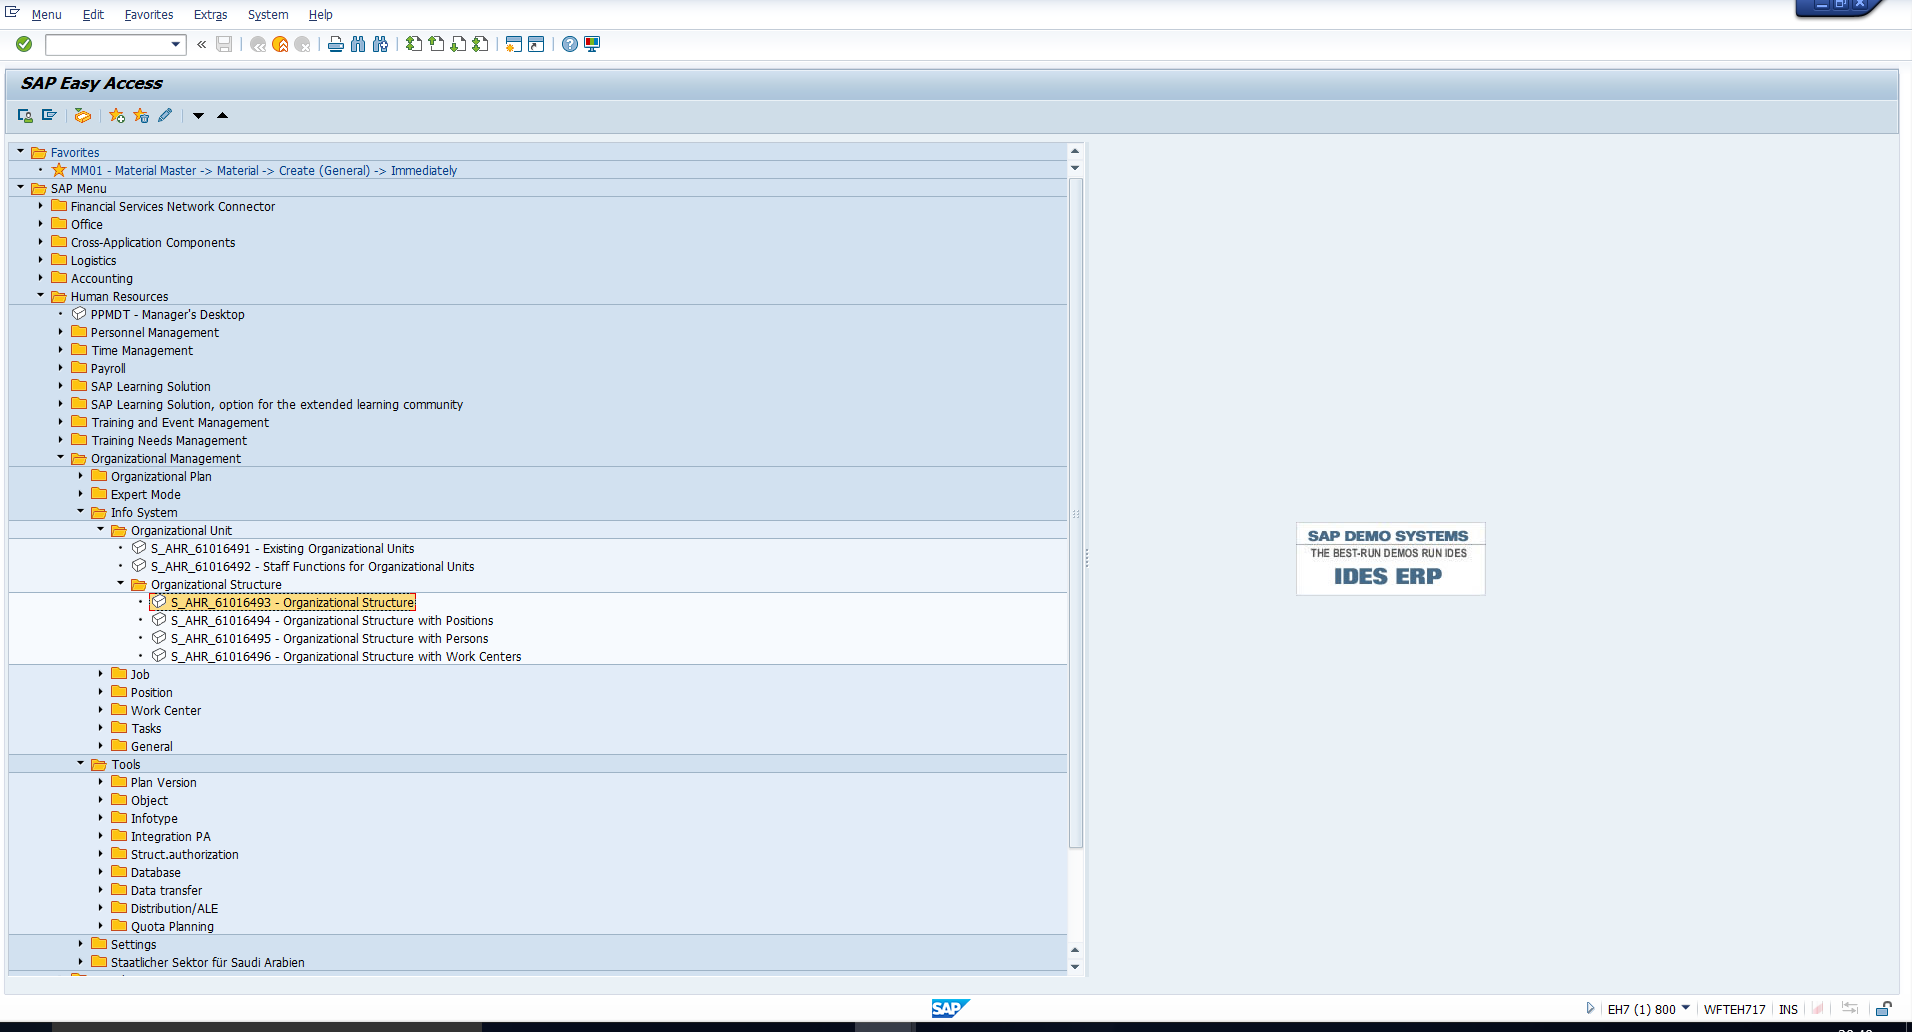 Figure 2: SAP Easy Access – Organizational Structure
The path has been depicted in Figure 2. On double clicking this transaction, you will see the screen in Figure 3 which is the report selection screen.
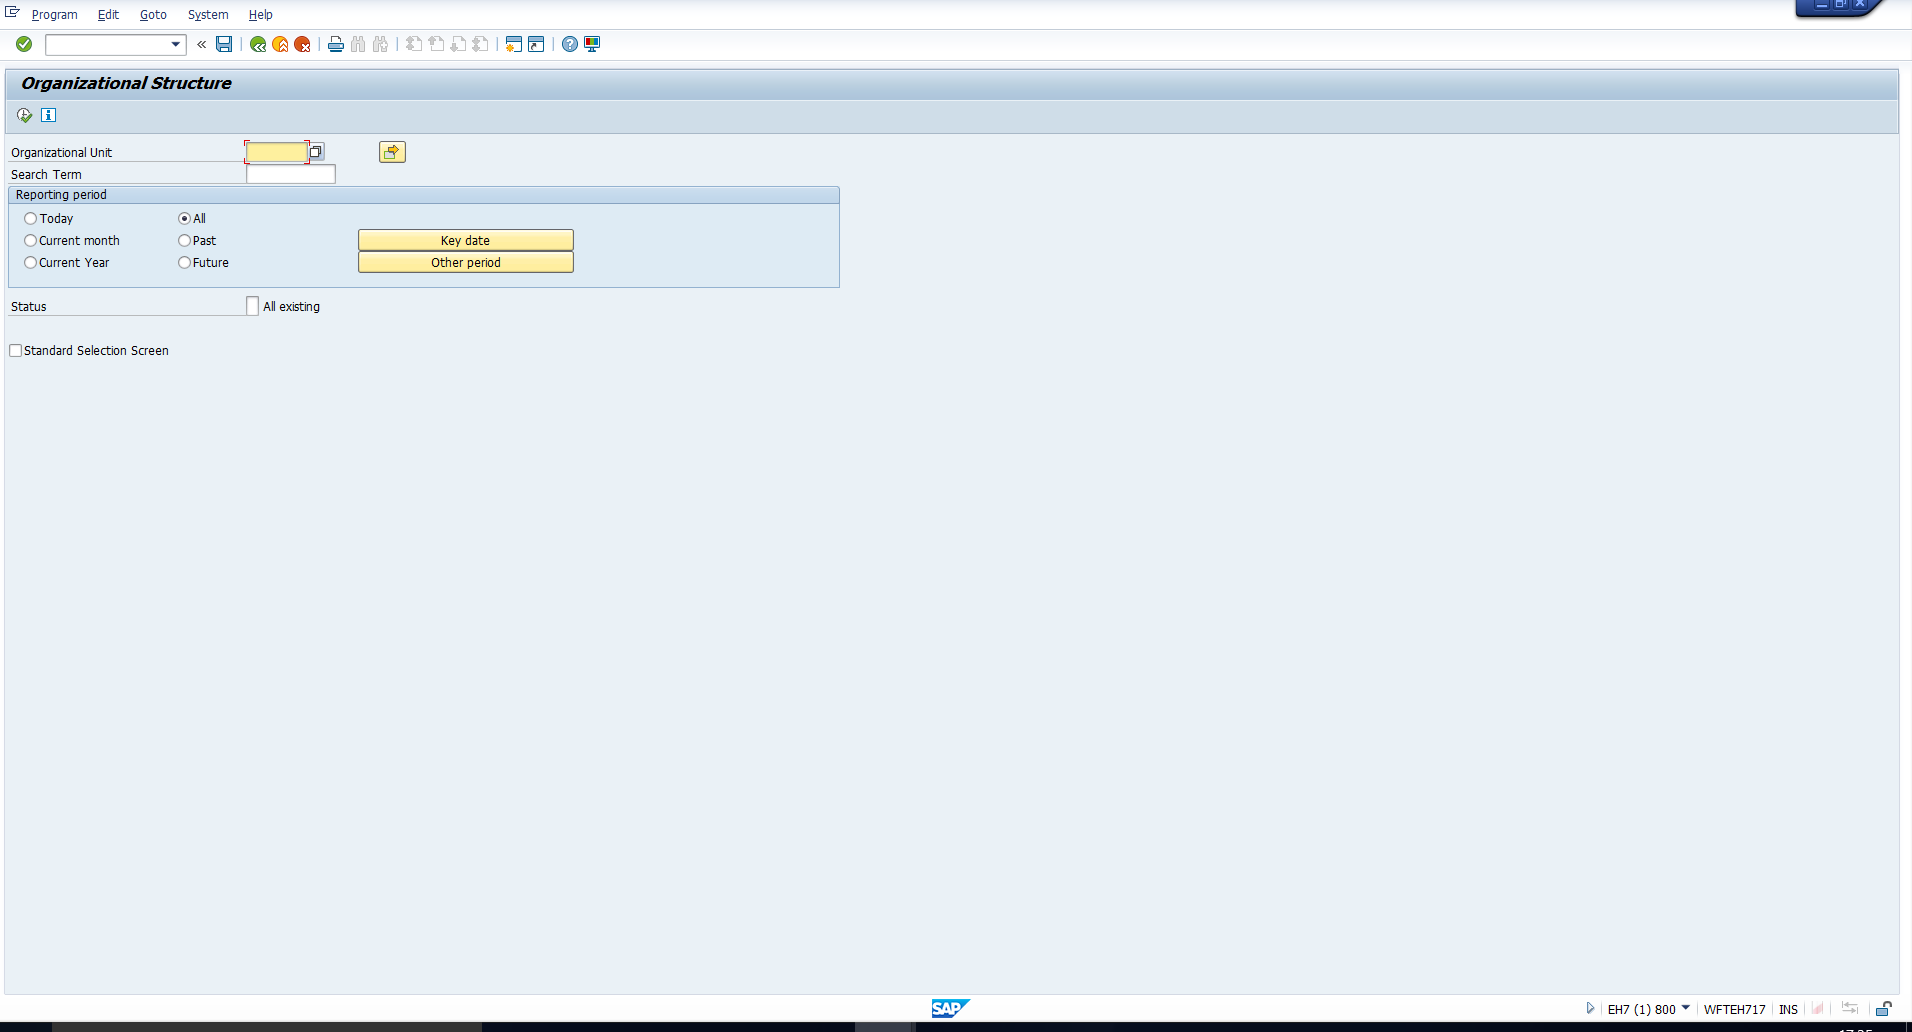 Figure 3: Organizational Structure – Selection Screen
In the field “Organizational unit”, enter or select the object ID of the root organizational unit for which you want to display the structure. Select the desired Reporting period. You can refer to the selection values we have entered in Figure 4.
Then, execute the report. Once processing is completed, the output screen is displayed as shown in Figure 5.
You can view the output using structural graphics. To do this, select the row containing the root organizational unit. Then click on the Structural Graphics icon highlighted in Figure 6.
You will then see the hierarchical view as illustrated in Figure 7.
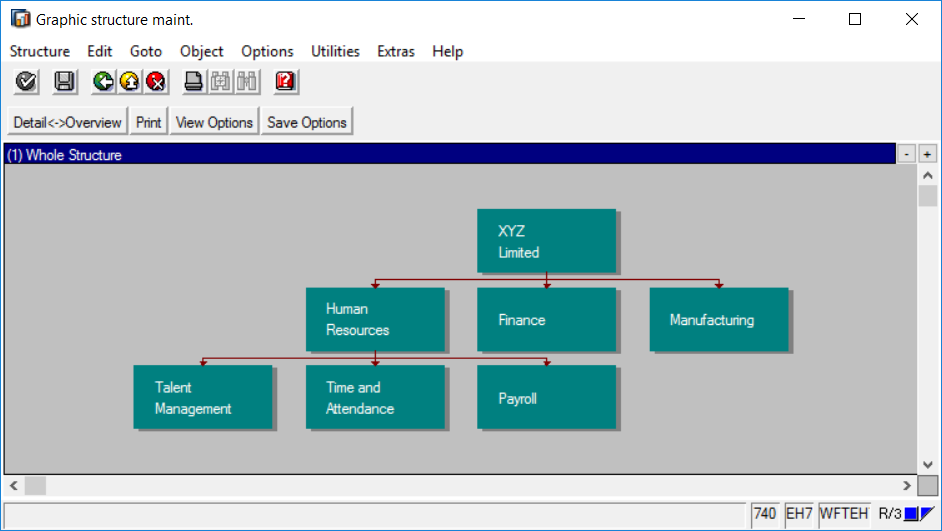 Figure 7: Graphic View
You can then print this structure with the help of the Print icon.
2. Organizational Structure with Positions
This report is useful if you need to display the organizational plan along with the positions assigned to each organizational unit. To do this, follow the below path in the SAP Easy Access screen:
Human Resources – Organizational Management – Info System – Organizational unit – Organizational structure – Organizational Structure with Positions
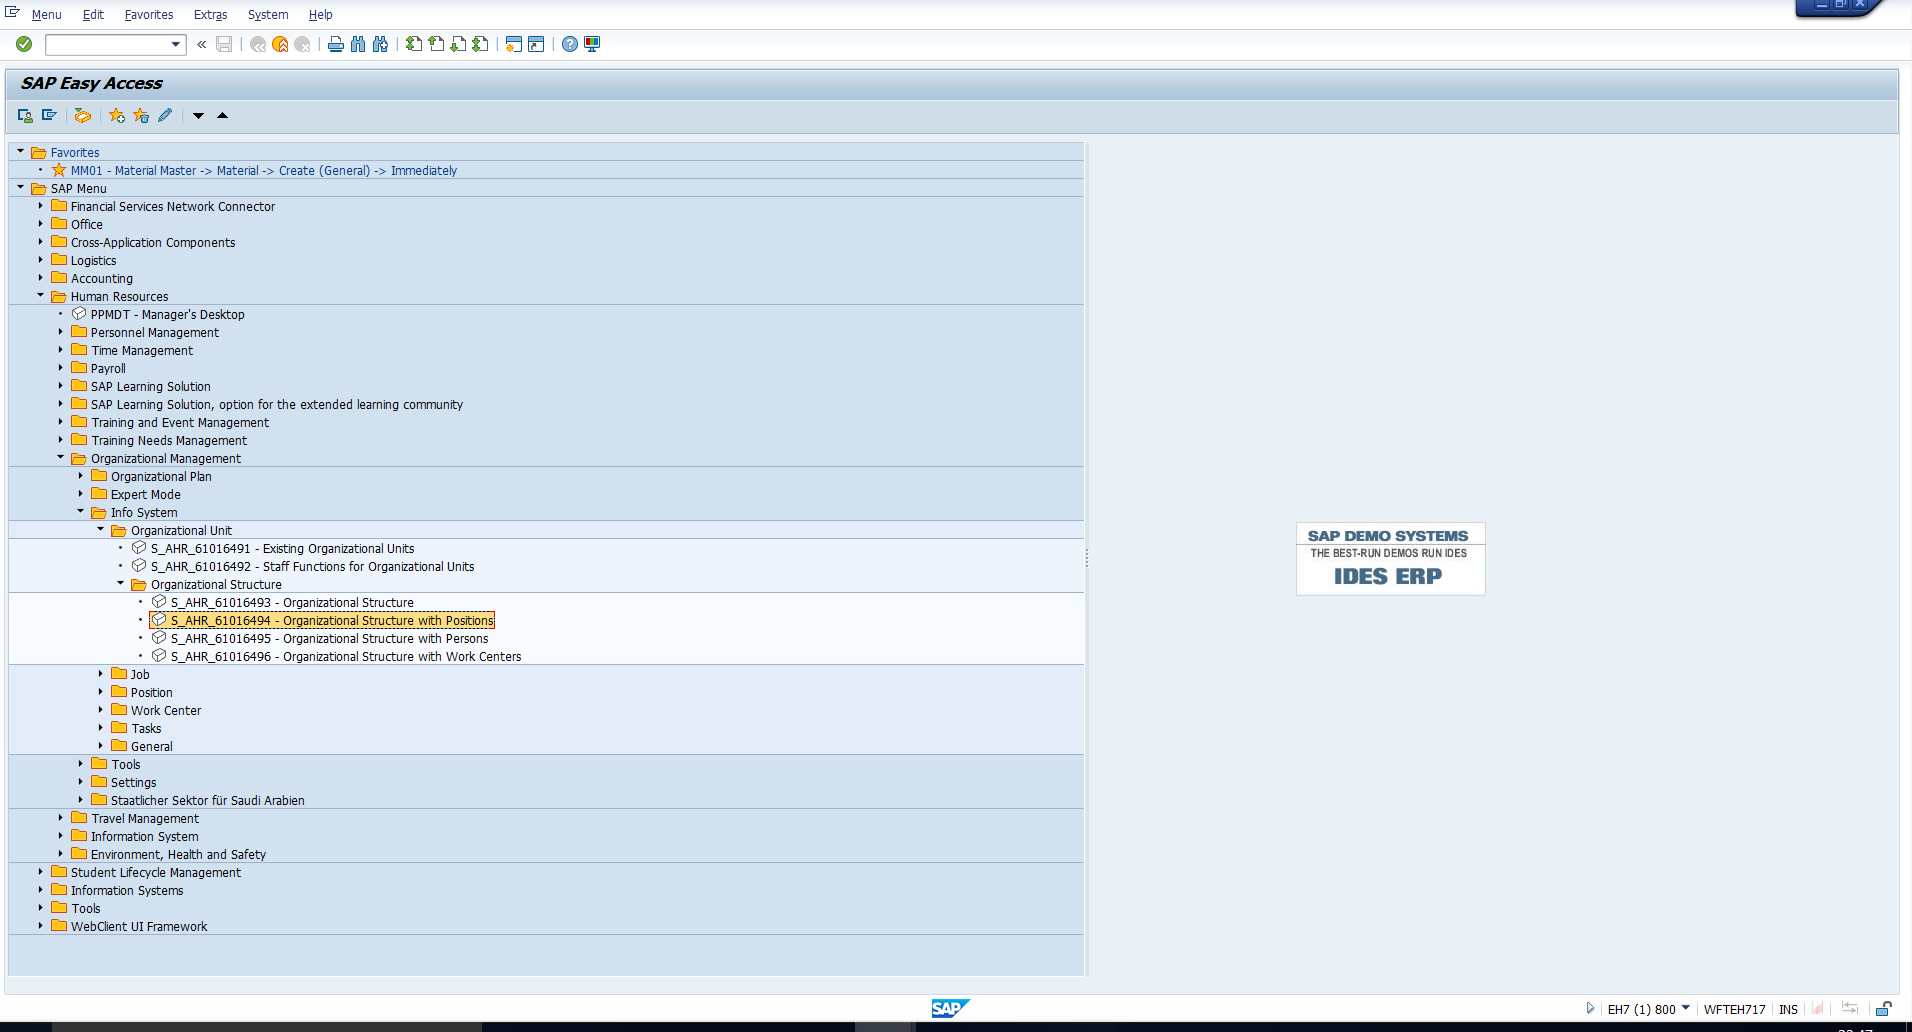 Figure 8: SAP Easy access – Organizational Structure with Positions
The path has been depicted in Figure 8. On double clicking this transaction, you will see the selection screen that has been shown in Figure 9.
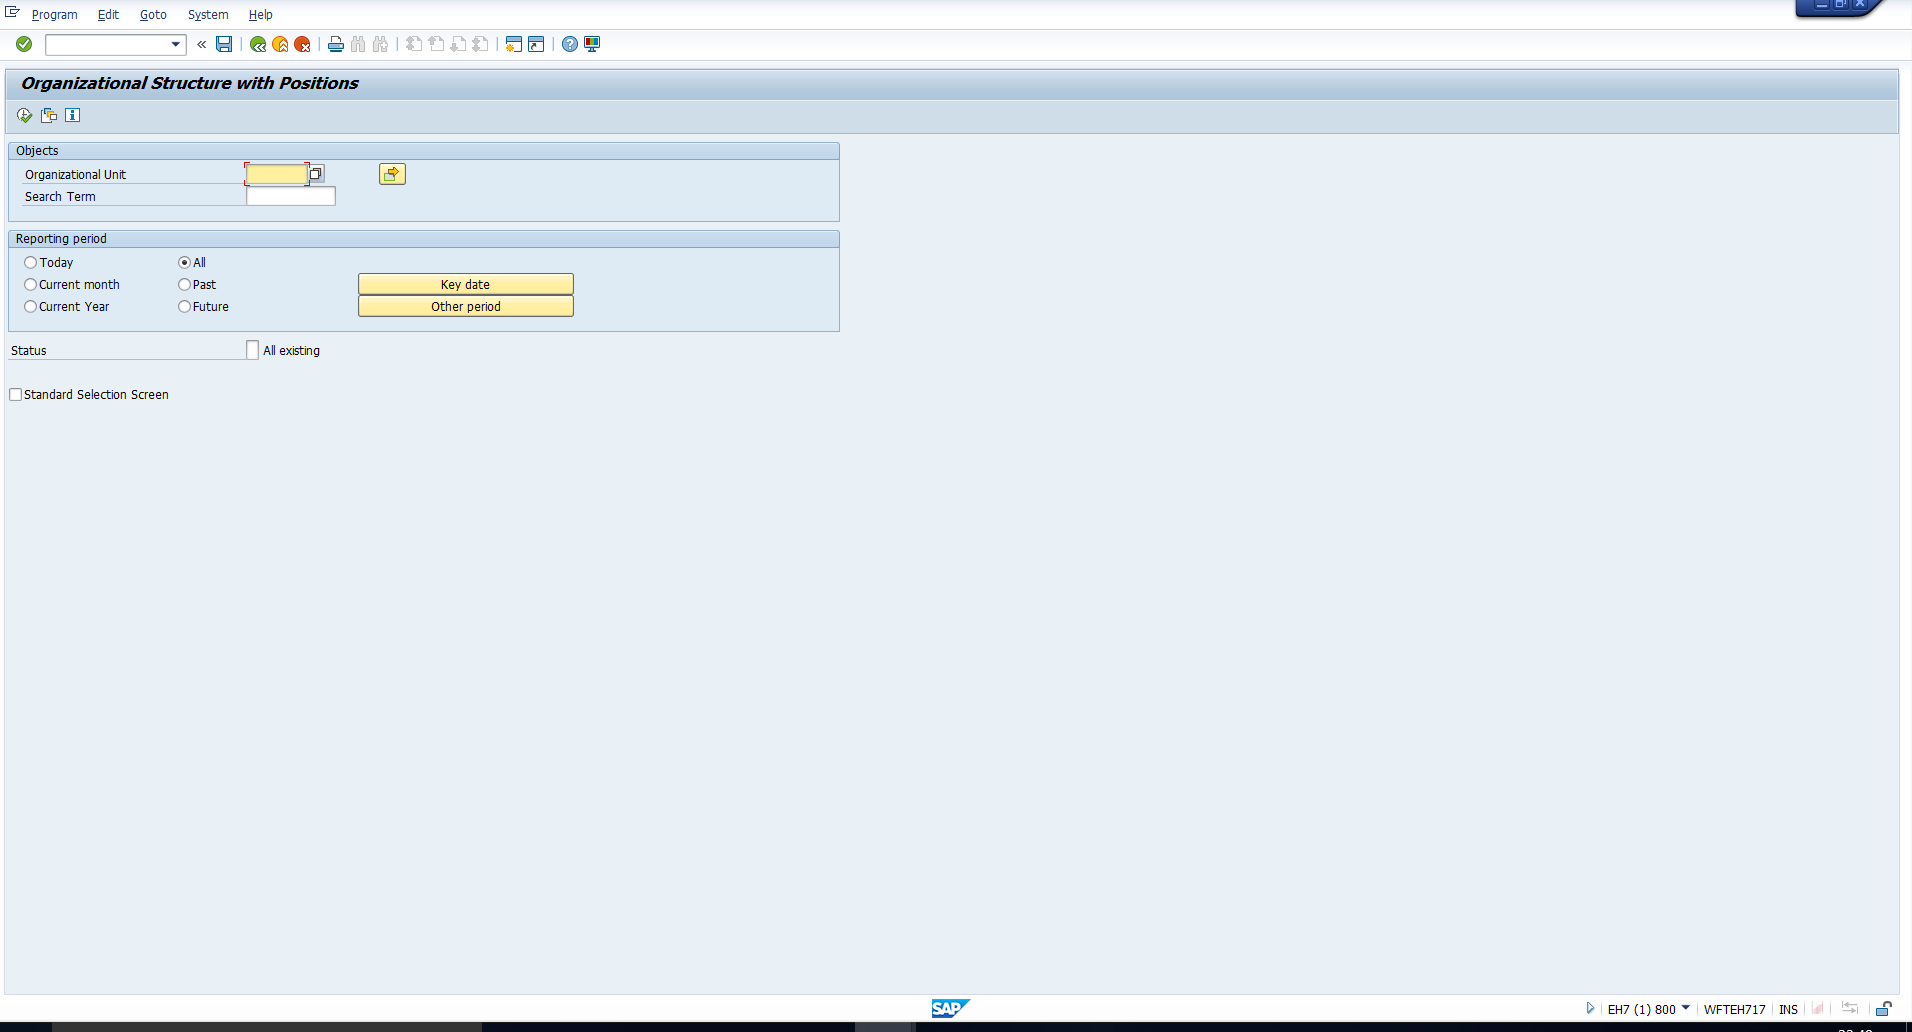 Figure 9: Organizational Structure with Positions – Selection Screen
In the field “Organizational unit”, enter or select the object ID of the root organizational unit for which you want to display the output. Select the desired reporting period. You can refer to the selection values we have entered in Figure 10.
Then, execute the report. Once processing is completed, the output screen is displayed as shown in Figure 11.
You can view the output using structural graphics. To do this, select the row containing the root organizational unit. Then, click on the Structural Graphics icon. You will then see the hierarchical view as illustrated in Figure 12.
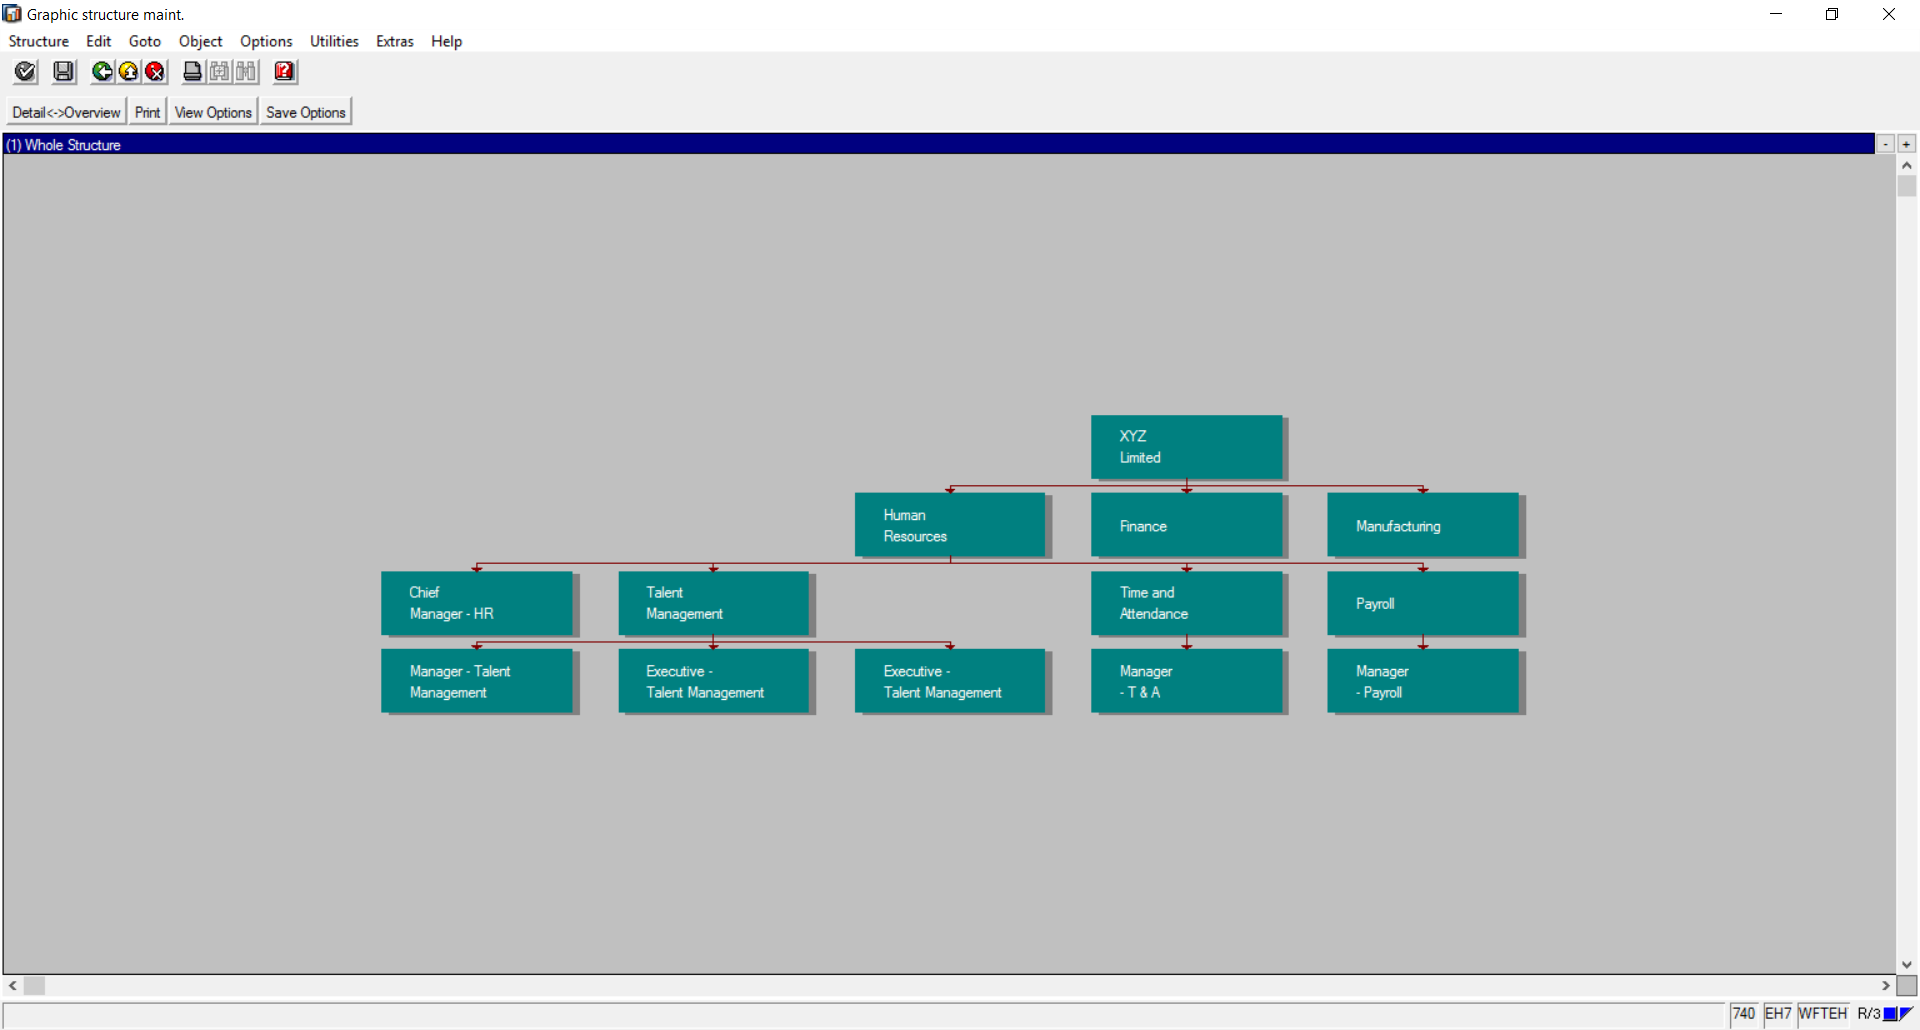 Figure 12: Graphical View of the Output
3. Organizational Structure with Persons
This report is useful if you need to display the organizational plan along with the persons assigned to each organizational unit. To do this, follow the below path in the SAP Easy Access screen:
Human Resources – Organizational Management – Info System – Organizational unit – Organizational structure – Organizational Structure with Positions
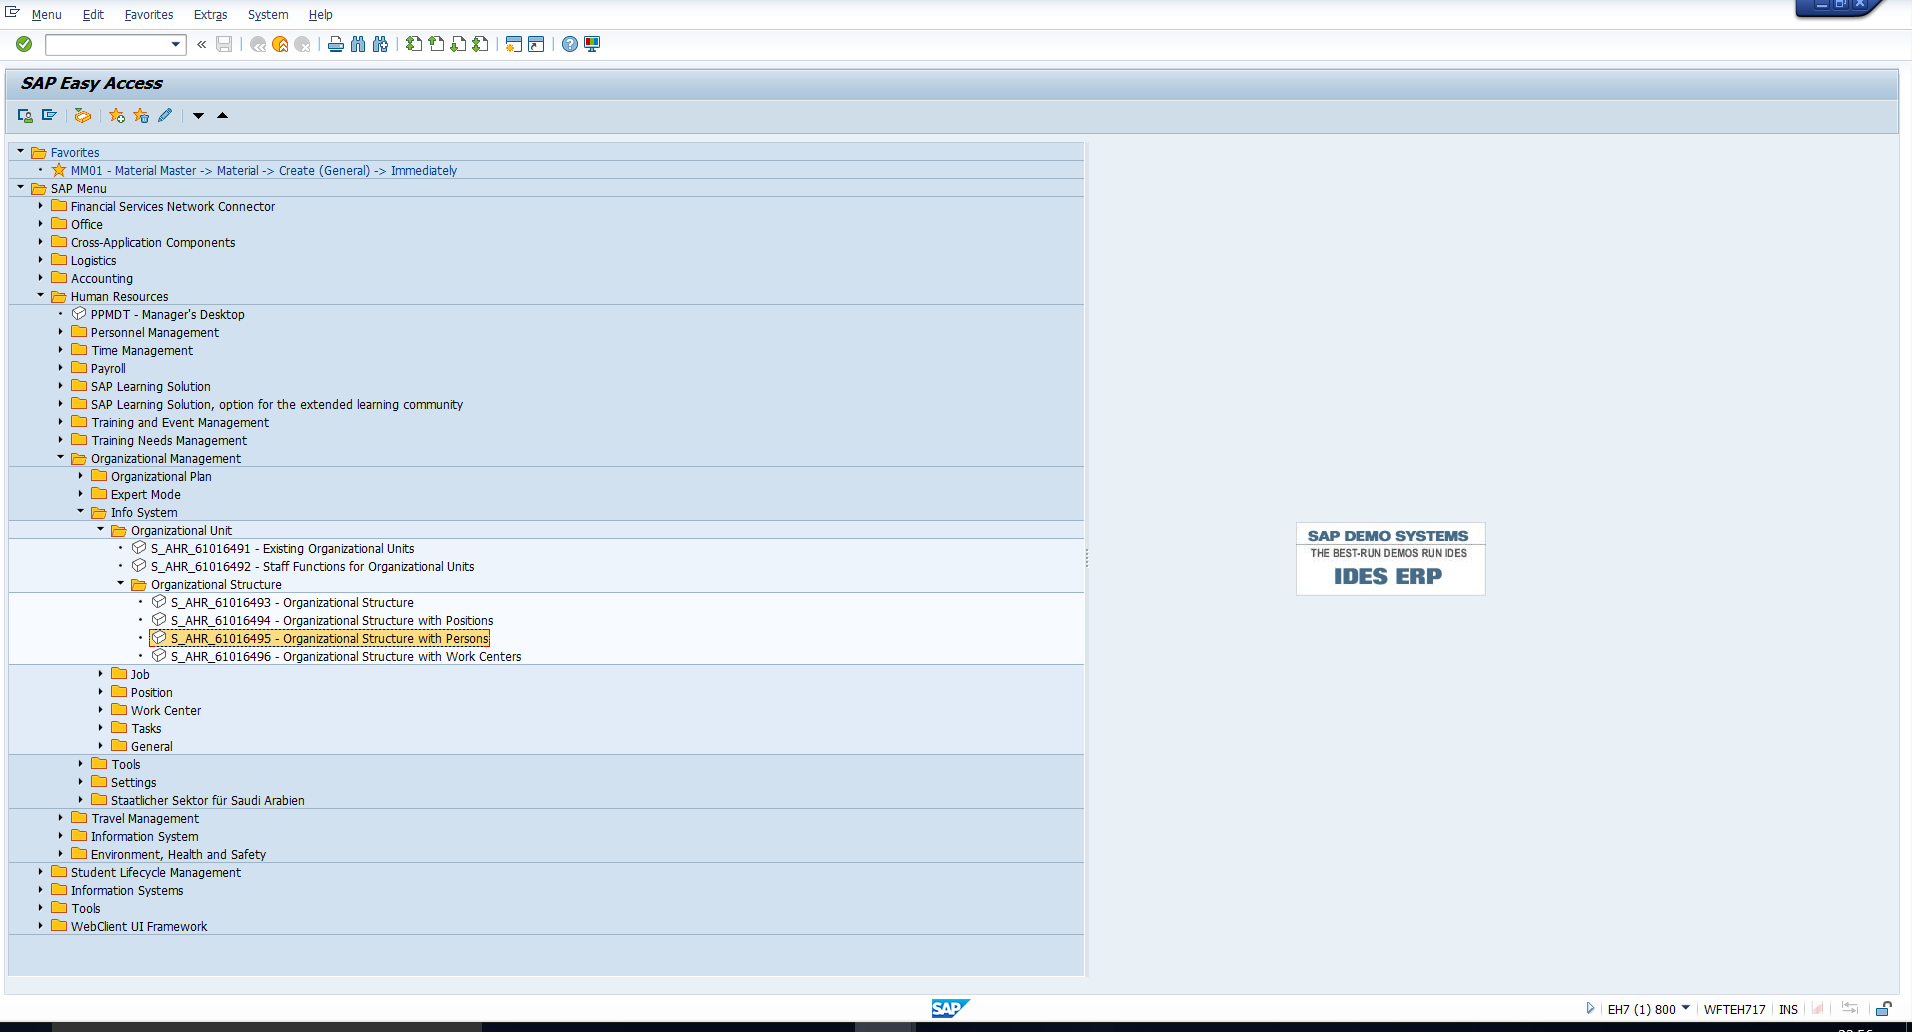 Figure 13: SAP Easy access – Organizational Structure with Persons Report
The path has been depicted in Figure 13. On double clicking this transaction, you will see the screen in Figure 14 which is the report selection screen.
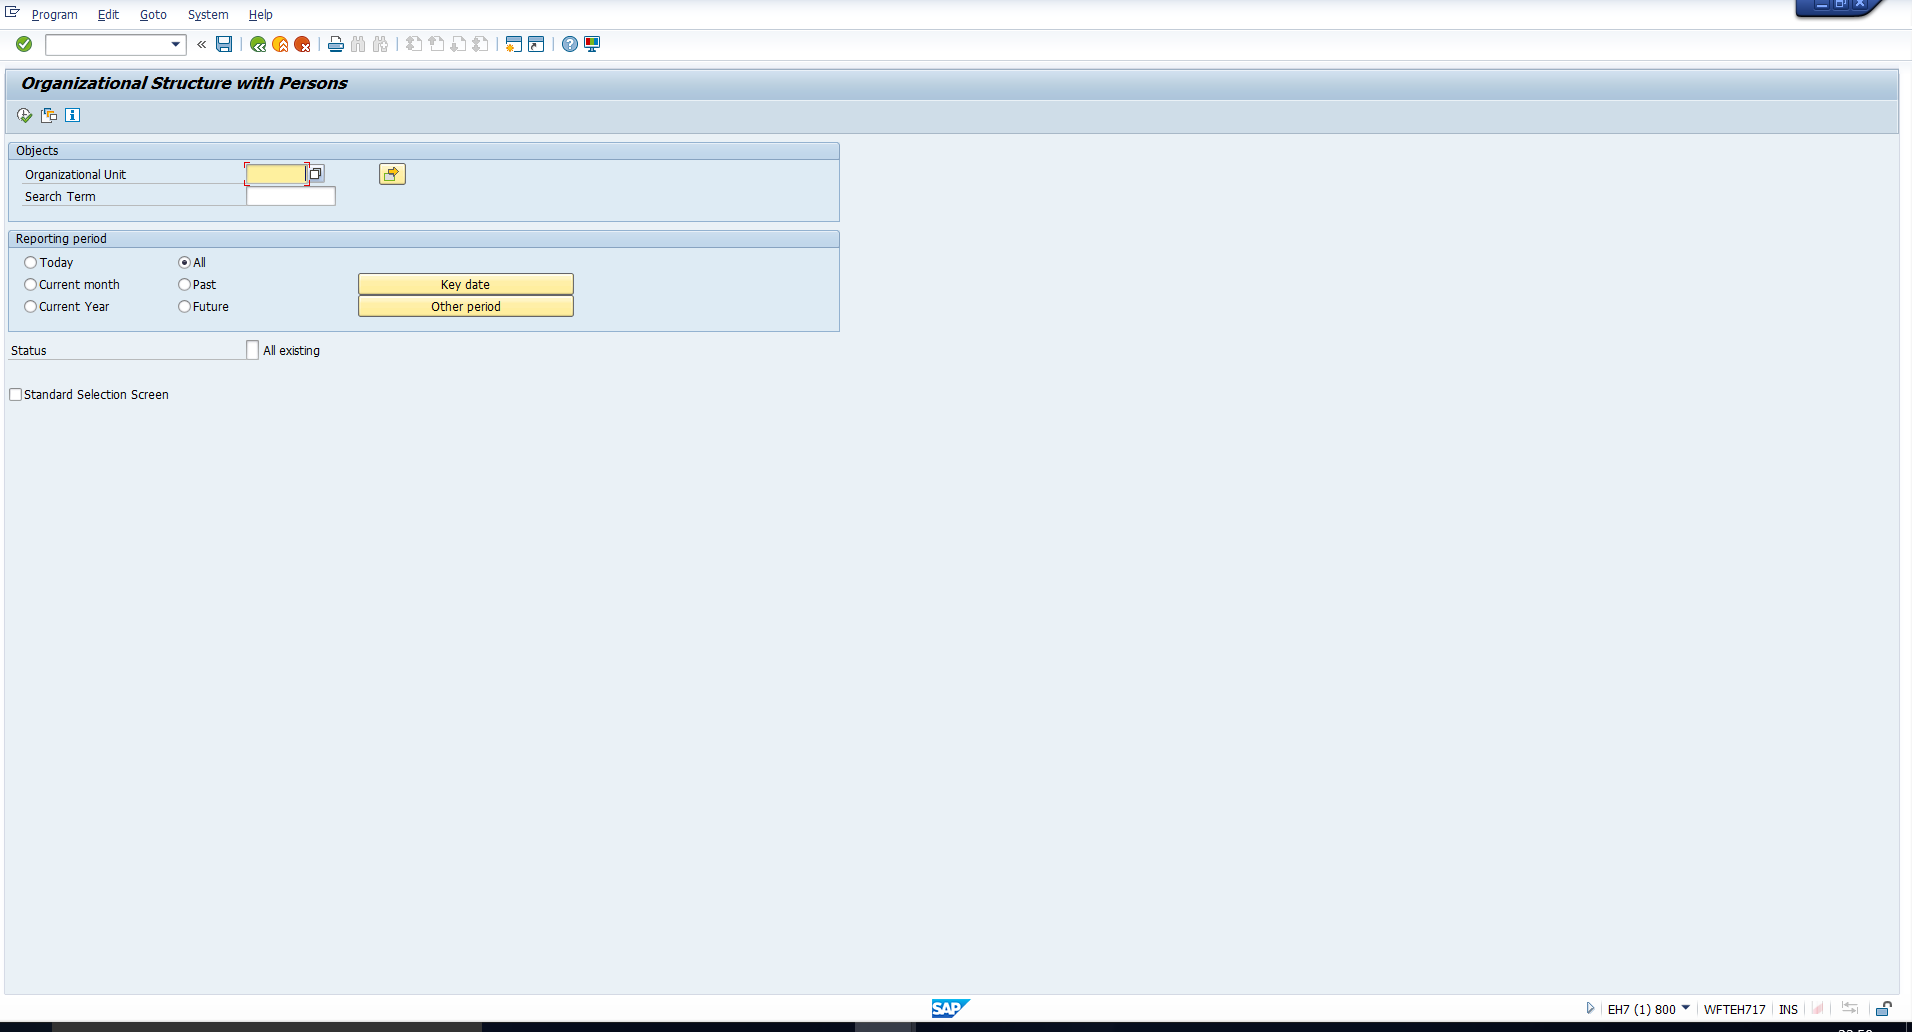 Figure 14: Organizational Structure with Persons Report – Selection Screen
In the field “Organizational unit”, enter or select the object ID of the root organizational unit for which you want to display the output. Select the desired reporting period. You can refer to the selection values we have entered in Figure 15.
Then, execute the report. Once processing is completed, the output is displayed as shown in Figure 16.
You can view the output using structural graphics. To do this, select the row containing the root organizational unit. Then, click on the Structural Graphics icon. You will then see the hierarchical view as illustrated in Figure 17.
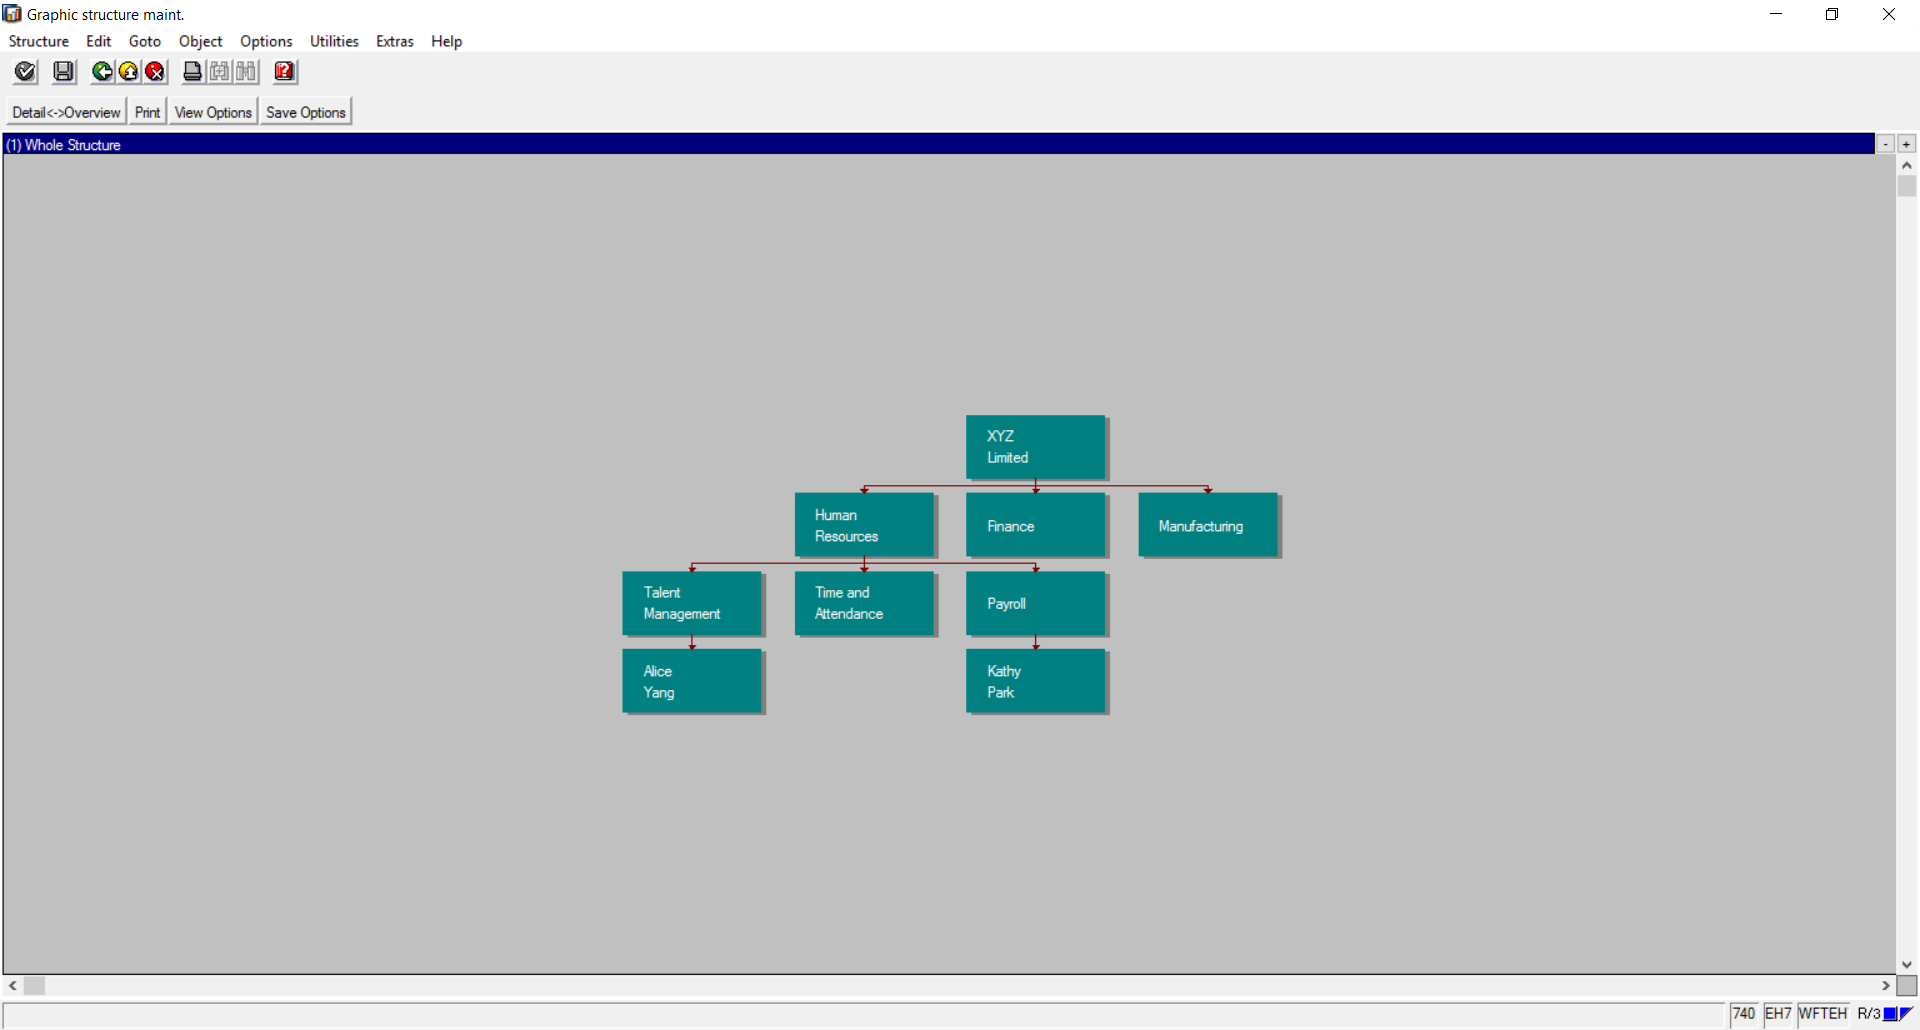 Figure 17: Structural Graphics View
4. Staff Assignments
This report is useful if you need to display the staff assignments within an organizational unit. To do this, follow the below path in the SAP Easy Access screen:
Human Resources – Organizational Management – Info System – Position – Staff assignments
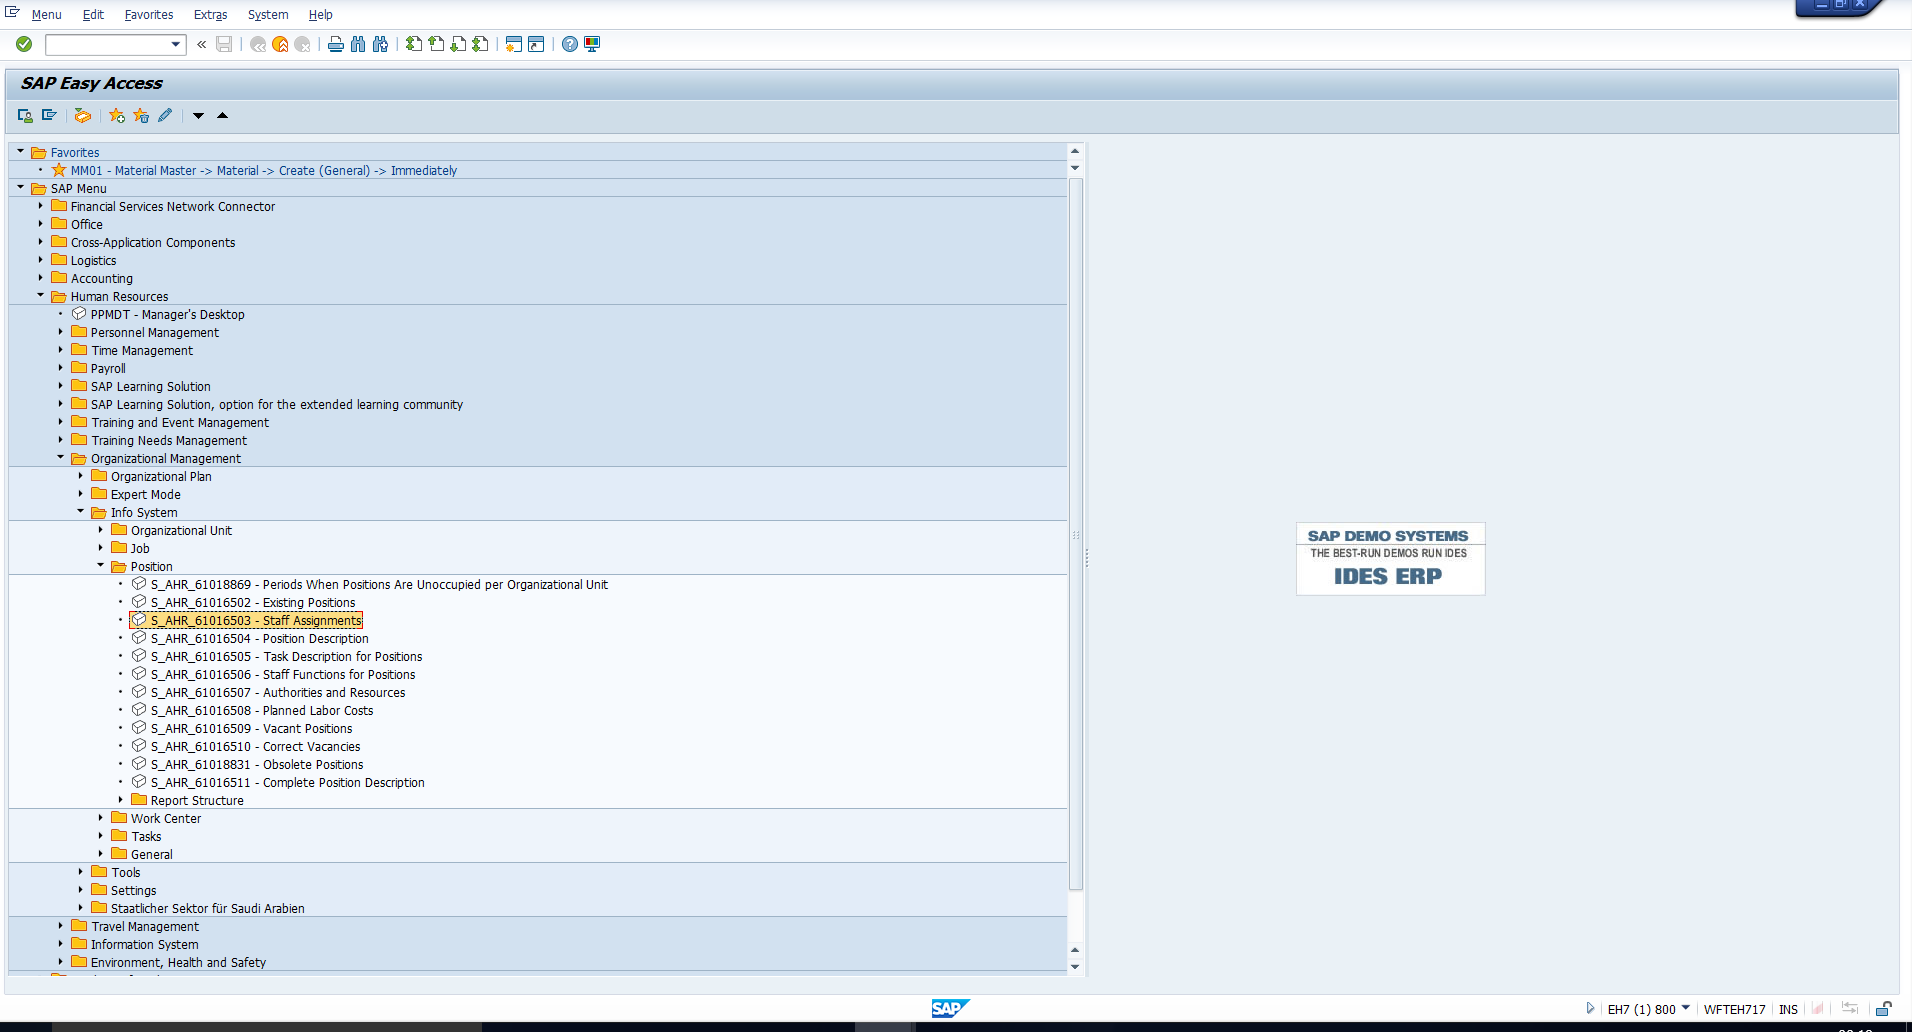 Figure 18: SAP Easy Access- Staff Assignments Report
The path has been depicted in Figure 18. On double clicking this transaction, you will see the selection screen shown in Figure 19.
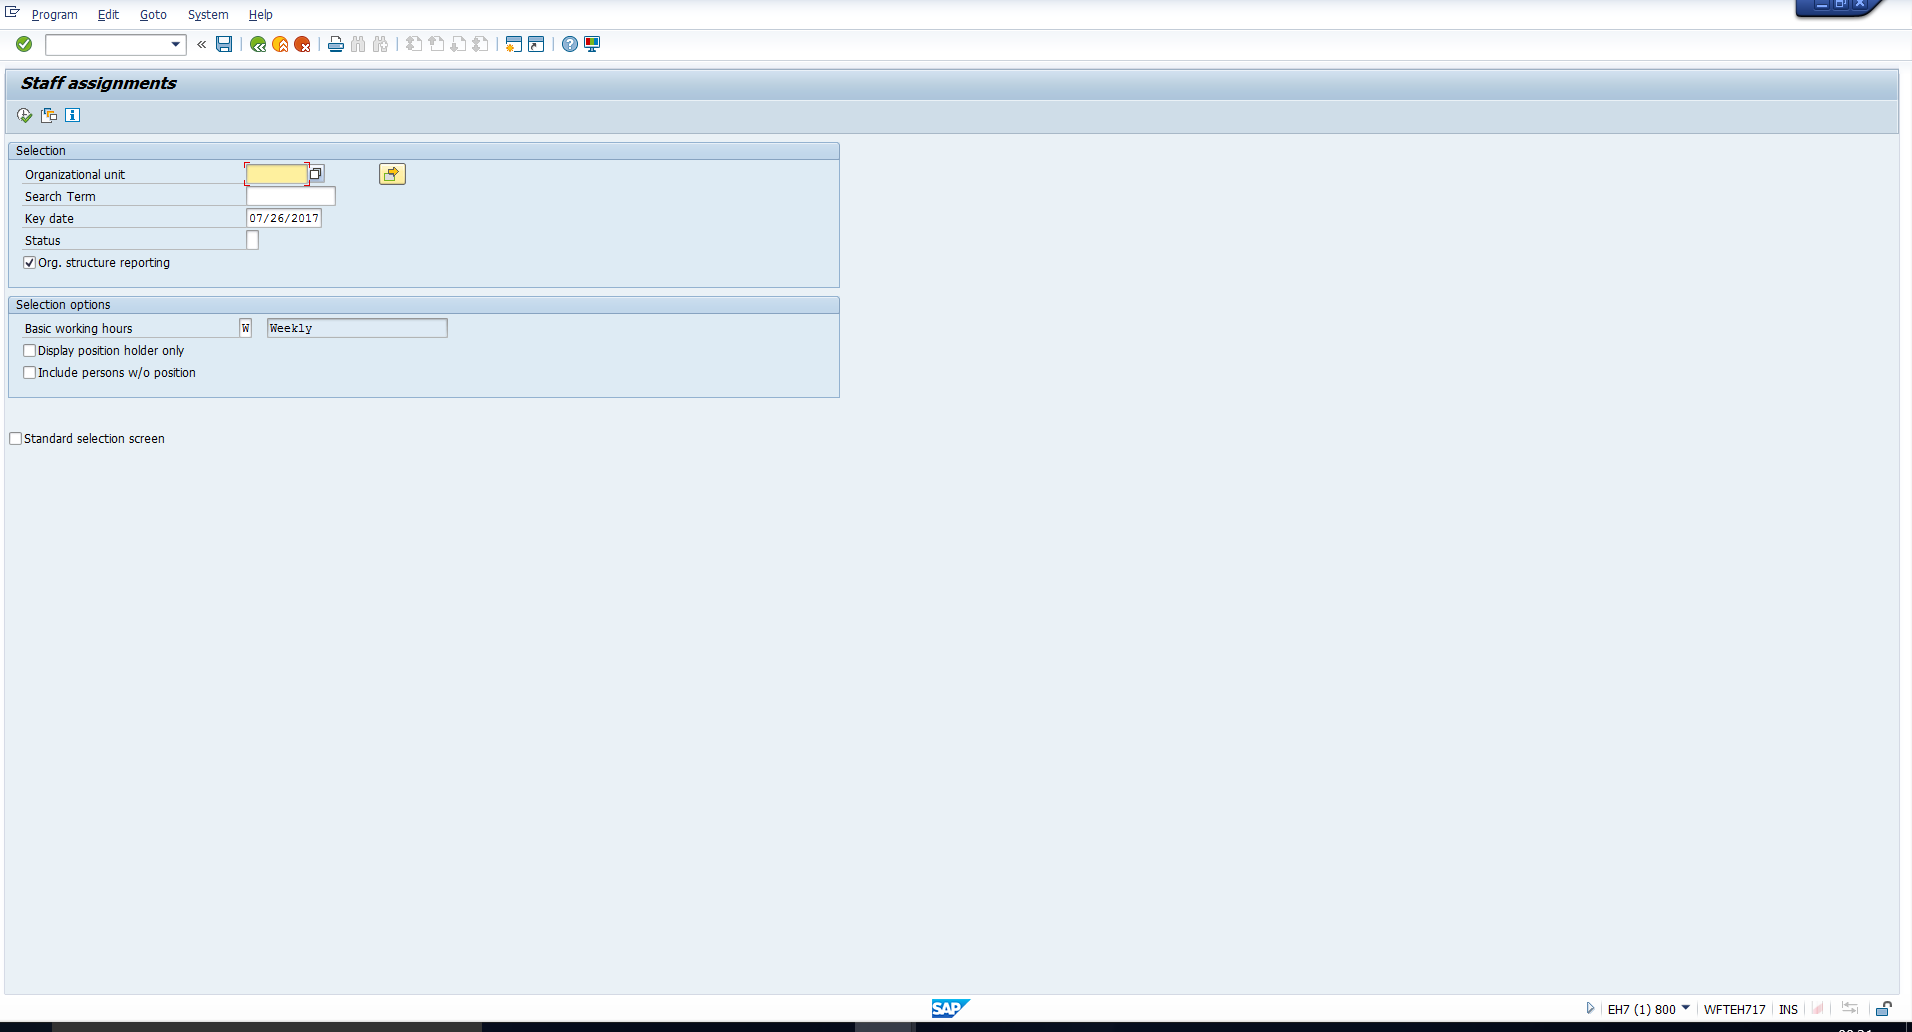 Figure 19: Staff Assignments Report – Selection Screen
In the field “Organizational unit”, enter or select the object ID of the root organizational unit for which you want to display the output. Enter any other desired selection values. You can refer to the selection values we have entered in Figure 20.
Then, execute the report. Once processing is completed, the output is displayed as shown in Figure 21.
—