Users Online

· Guests Online: 15

· Members Online: 0

· Total Members: 188
· Newest Member: meenachowdary055

Forum Threads

Newest Threads
No Threads created
Hottest Threads
No Threads created

Latest Articles

Power BI Tutorial - Power BI Charts Tutorial

Filled Map in Power BI

Power BI Filled Maps fill the Map with colors based on the geological data that you provide. Let me show you how to Create a Filled Map in Power BI with example.


For this Power BI Filled Map demonstration, we are going to use the World Population data that we downloaded from the Data bank (in Excel format).

Please refer Connect to the Excel article to understand the Power BI steps involved in working with Excel.  


Filled Map in Power BI 1

How to Create a Filled Map in Power BI

Dragging any geographical data to the Canvas region will automatically create a Map for you. First, let me drag the Country Names from the world Population table to the Canvas.

Filled Map in Power BI 2

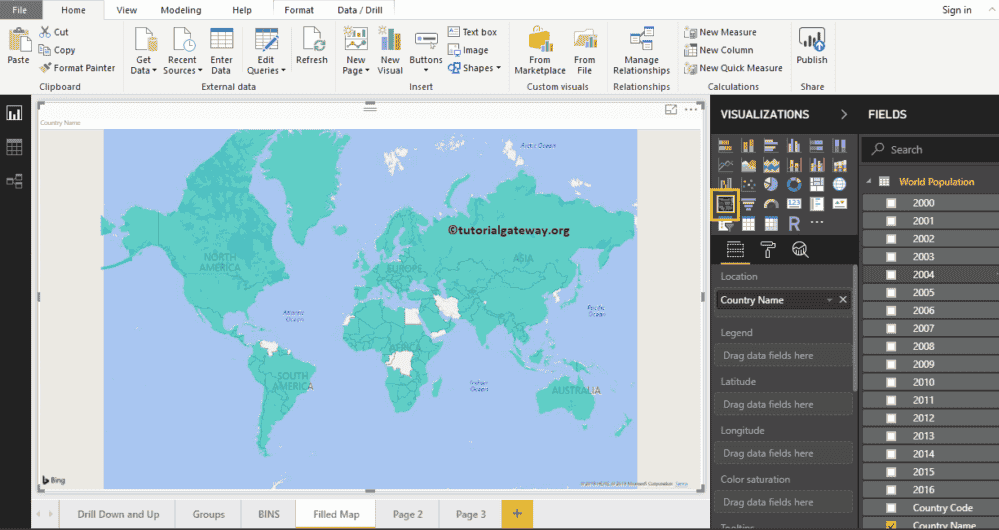
Click on the Filled Map under the Visualization section. It converts a Map into a Filled Map.

  Filled Map in Power BI 3

Next, Drag and Drop the 2016 Population from Fields section to Legend region.

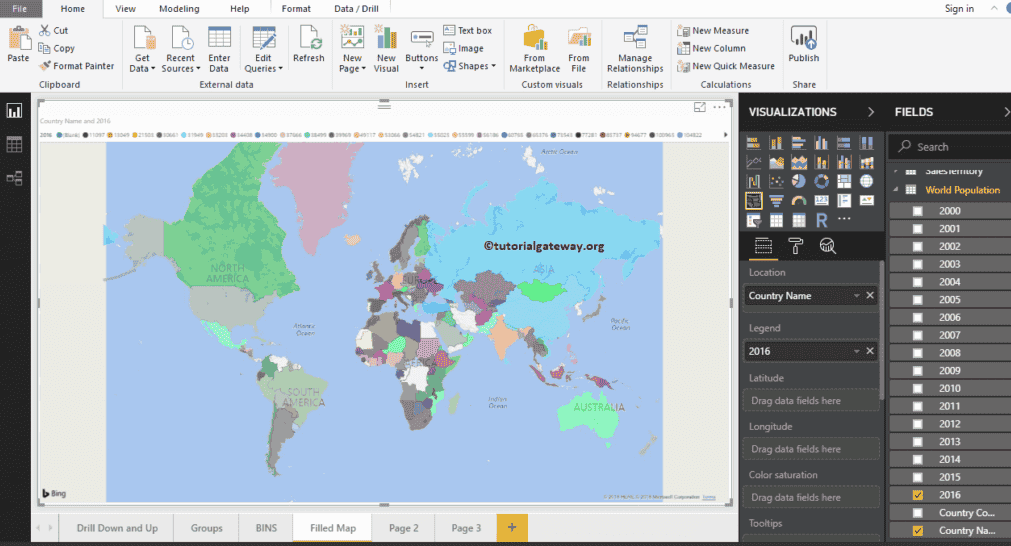
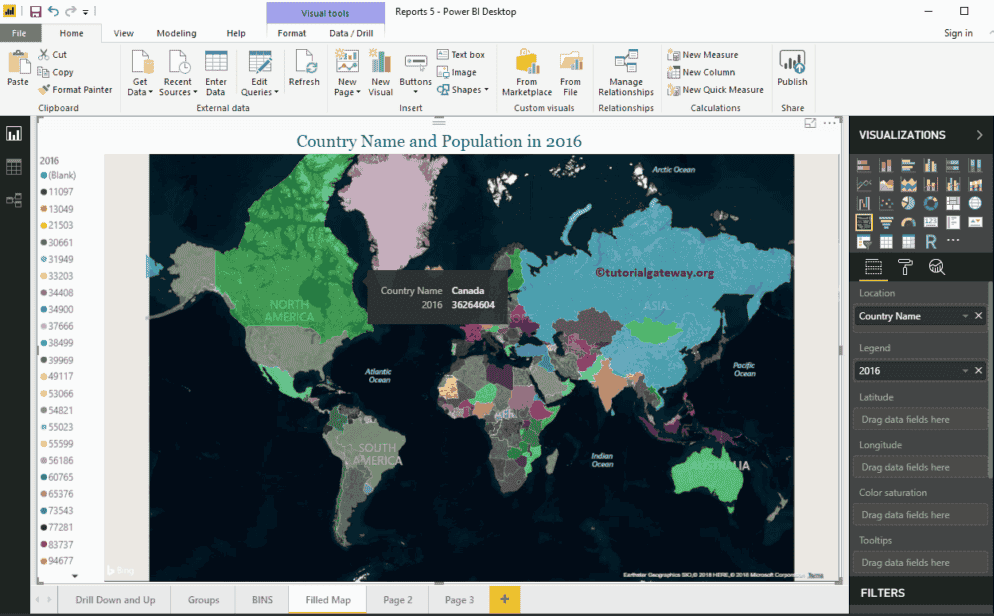
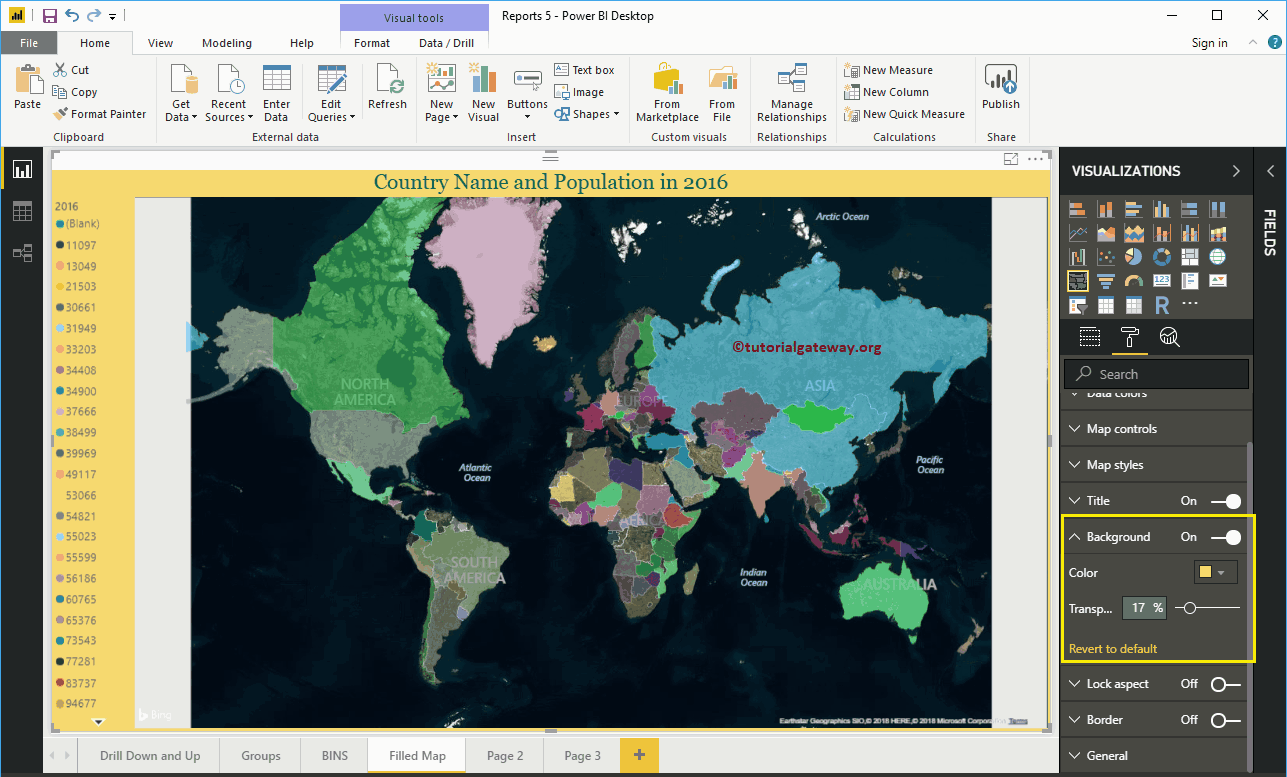
From the above screenshot, you can see the filled map that represents in the country-wise population in the year 2016

Create a Filled Map in Power BI Approach 2

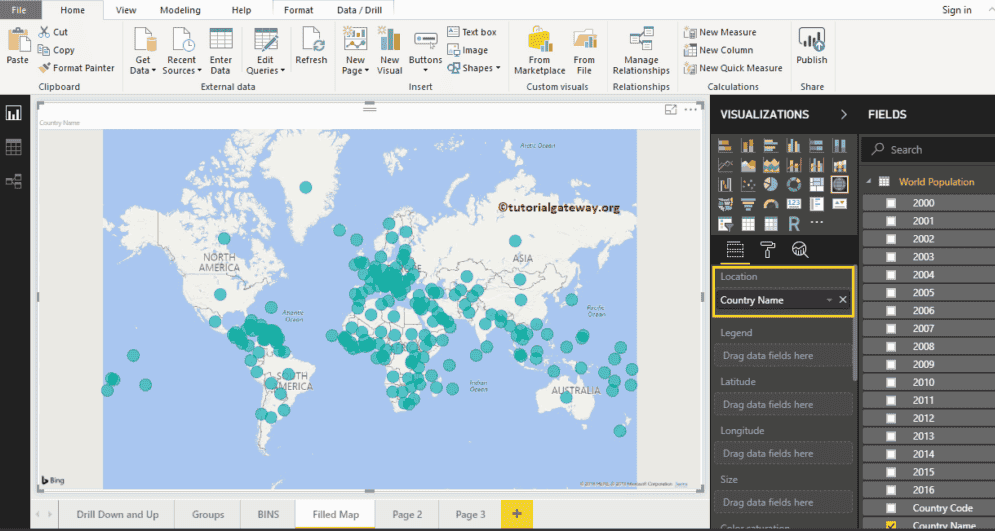
First, click on the filled Map under the Visualization section. It automatically creates a filled Map with dummy data, as shown in the screenshot below.

Filled Map in Power BI 5

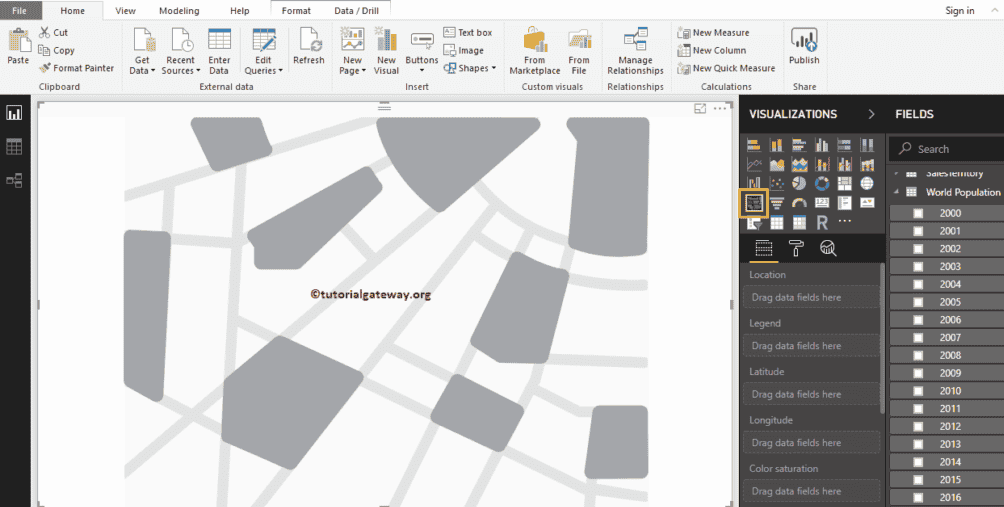
To add data to a Power BI filled Map, we have to add the required fields:

  • Location: Please specify the Geological Column that represents the Bubbles.
  • Legend: Specify the Column that sub-divide the Location data. Something like Territory, Country, Region, or Continent
  • Latitude and Longitude: If your data has latitude and longitude information, then you can use them to get the exact location.
  • Size: Specify the Column that represents the Bubbles size.
  • Color Saturation: Any Numeric value that decides the color of the bubble.

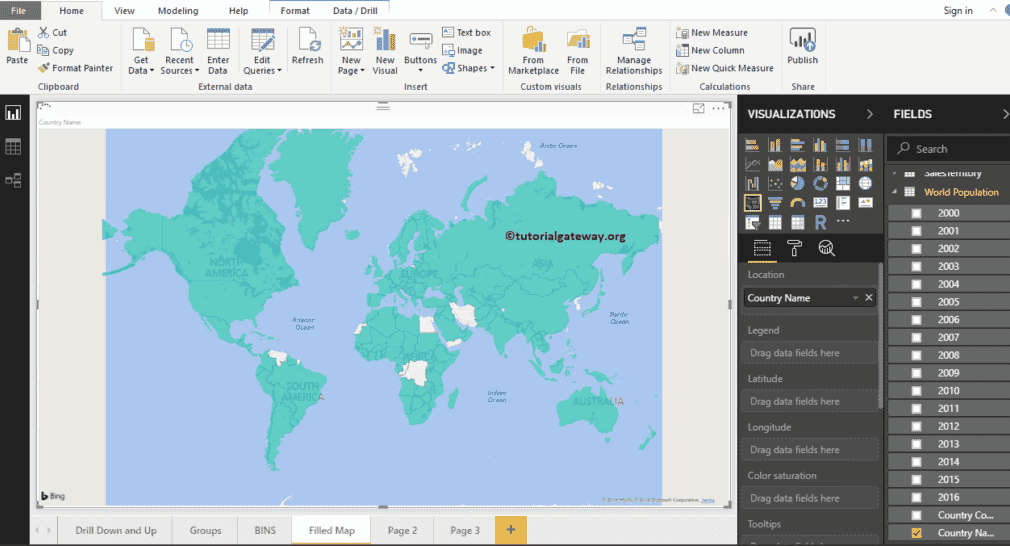
Let me drag the country name from the Fields section to the Location Section. You can do this by dragging the country name to the Location section, or simply checkmark the country name column.

Filled Map in Power BI 6

Next, let me add the 2016 population to the legend section. Now you see the filled map

Filled Map in Power BI 7

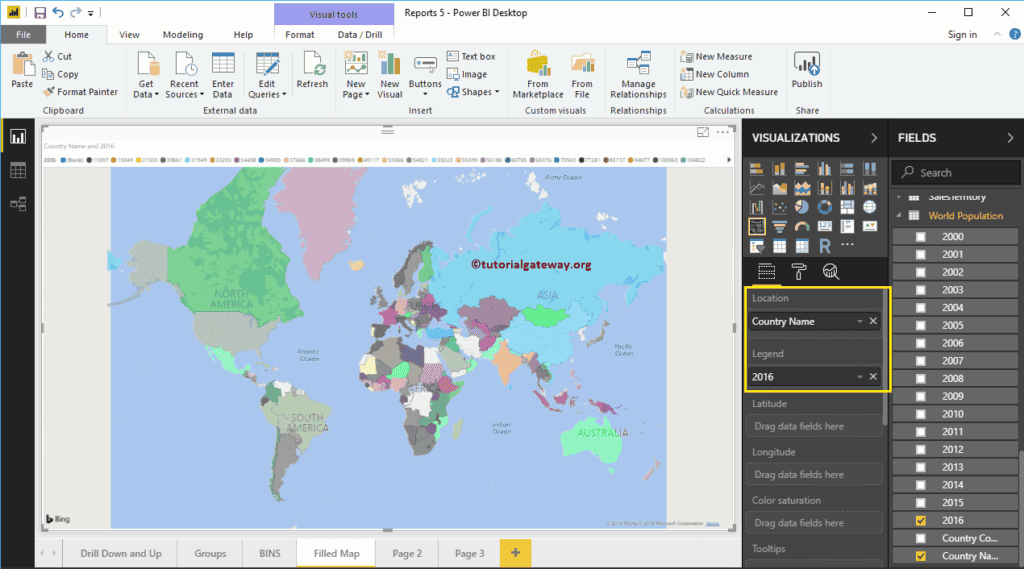
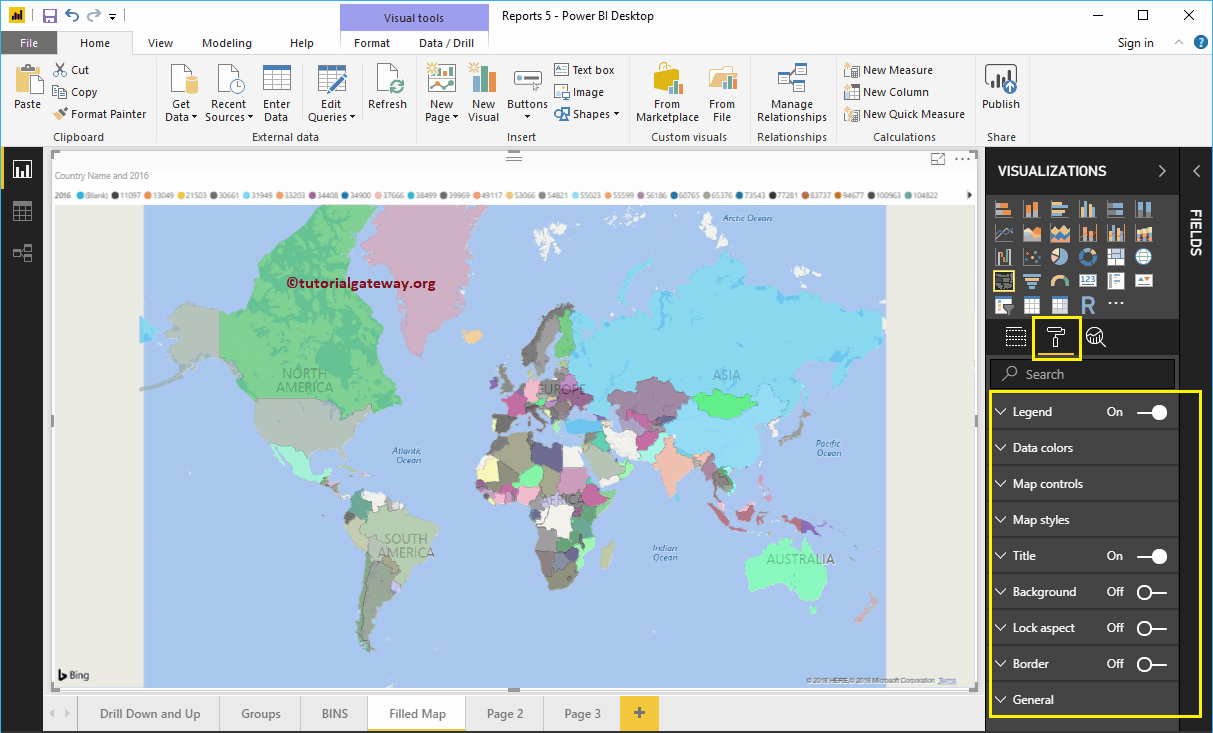
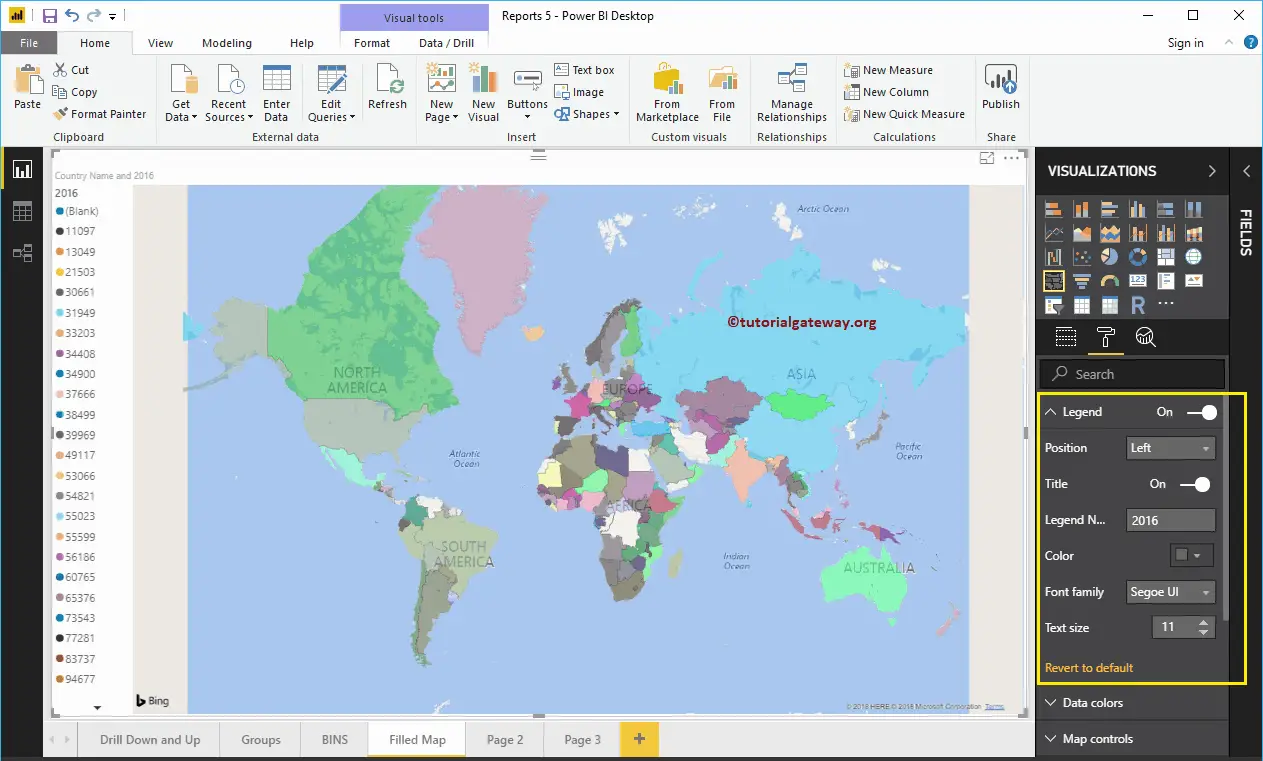
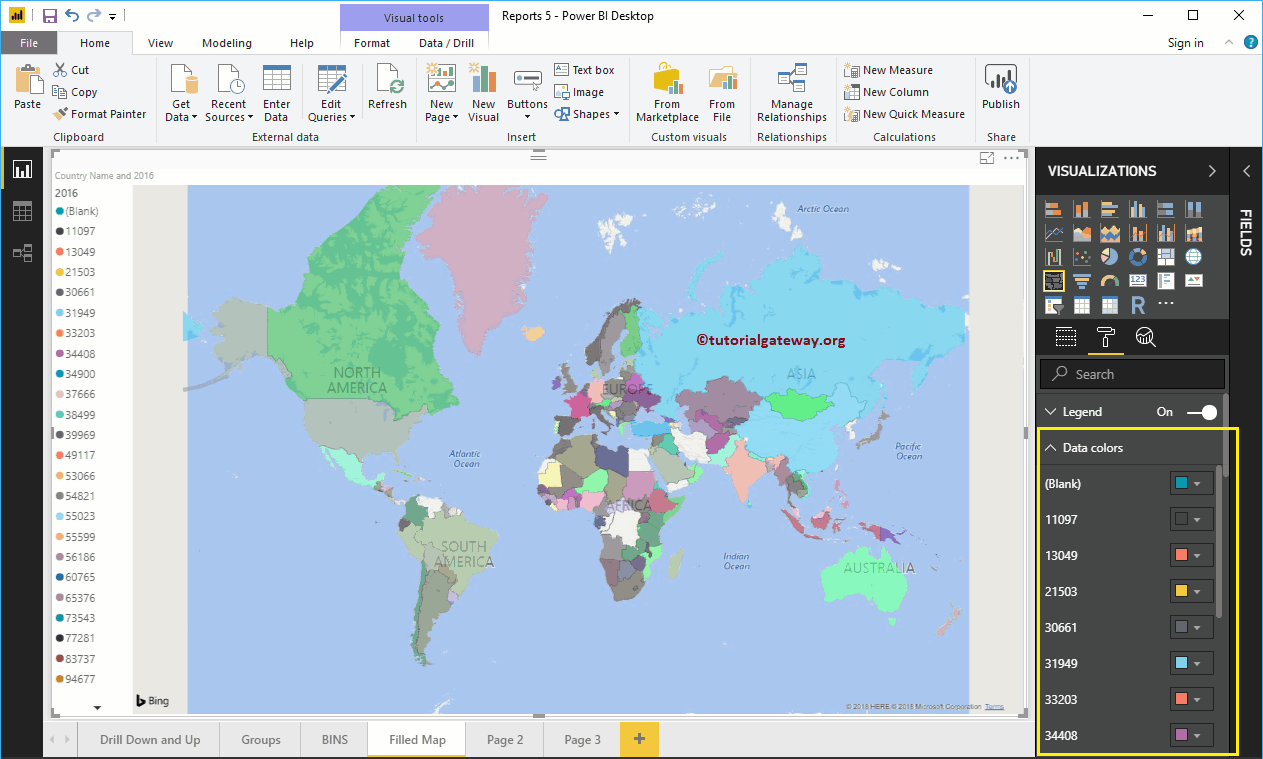
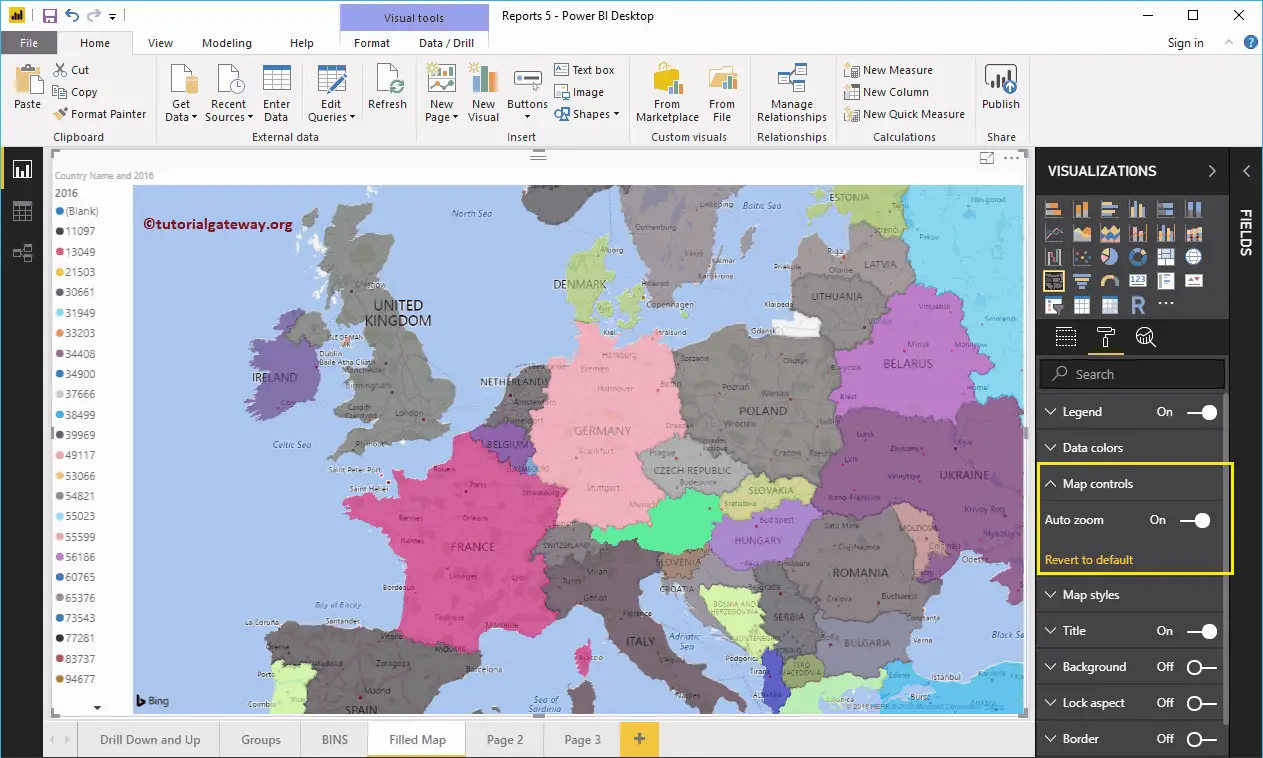
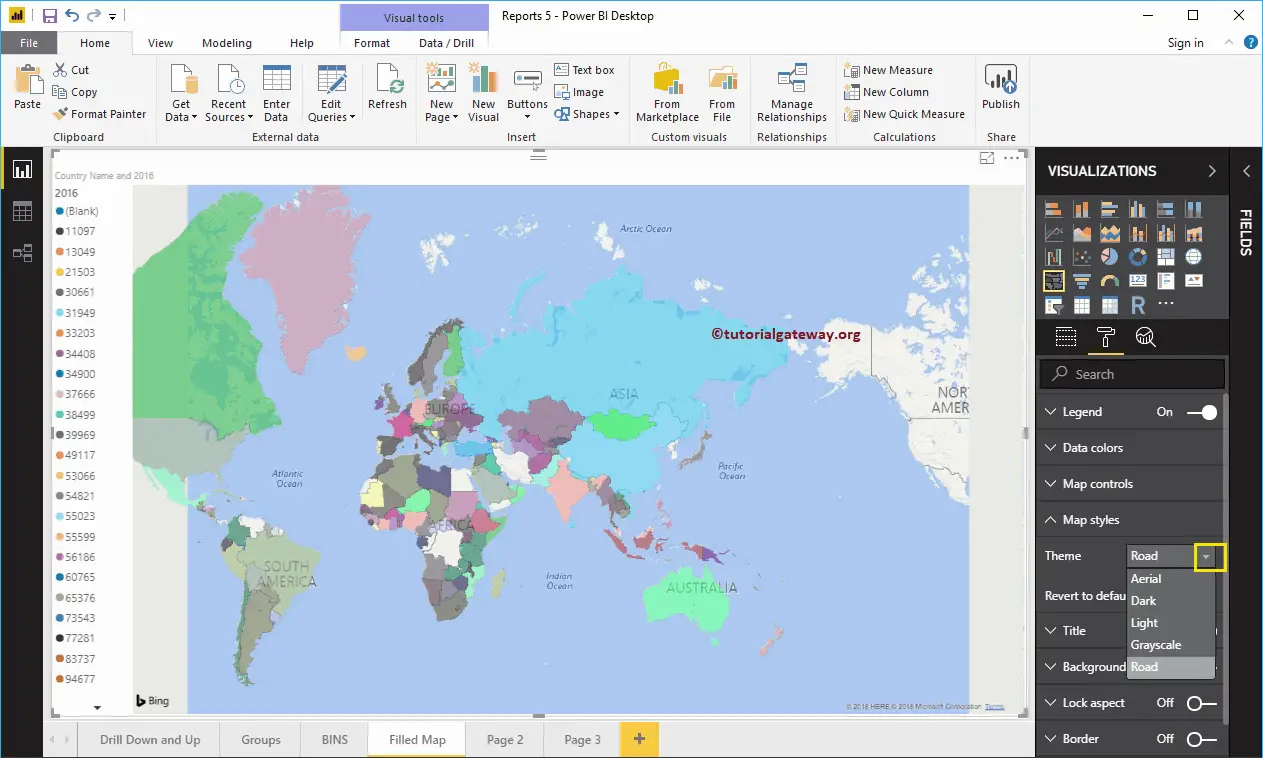
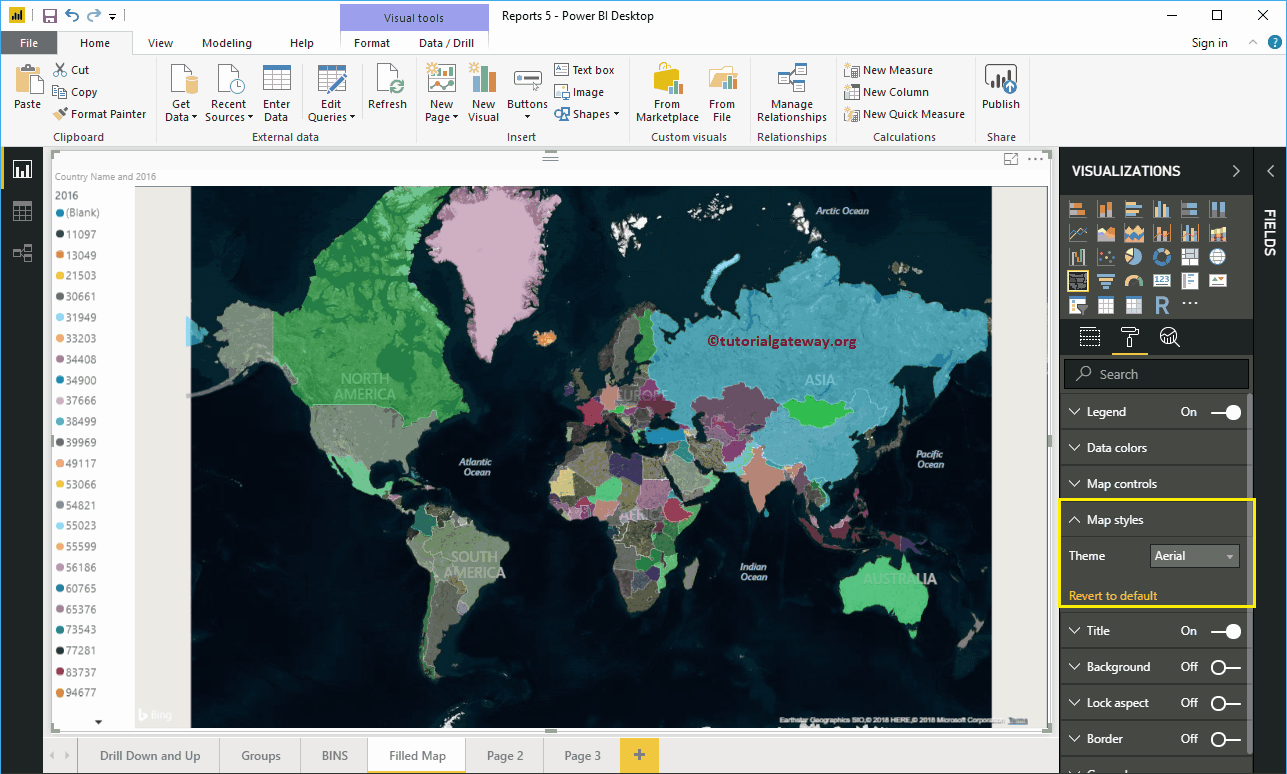
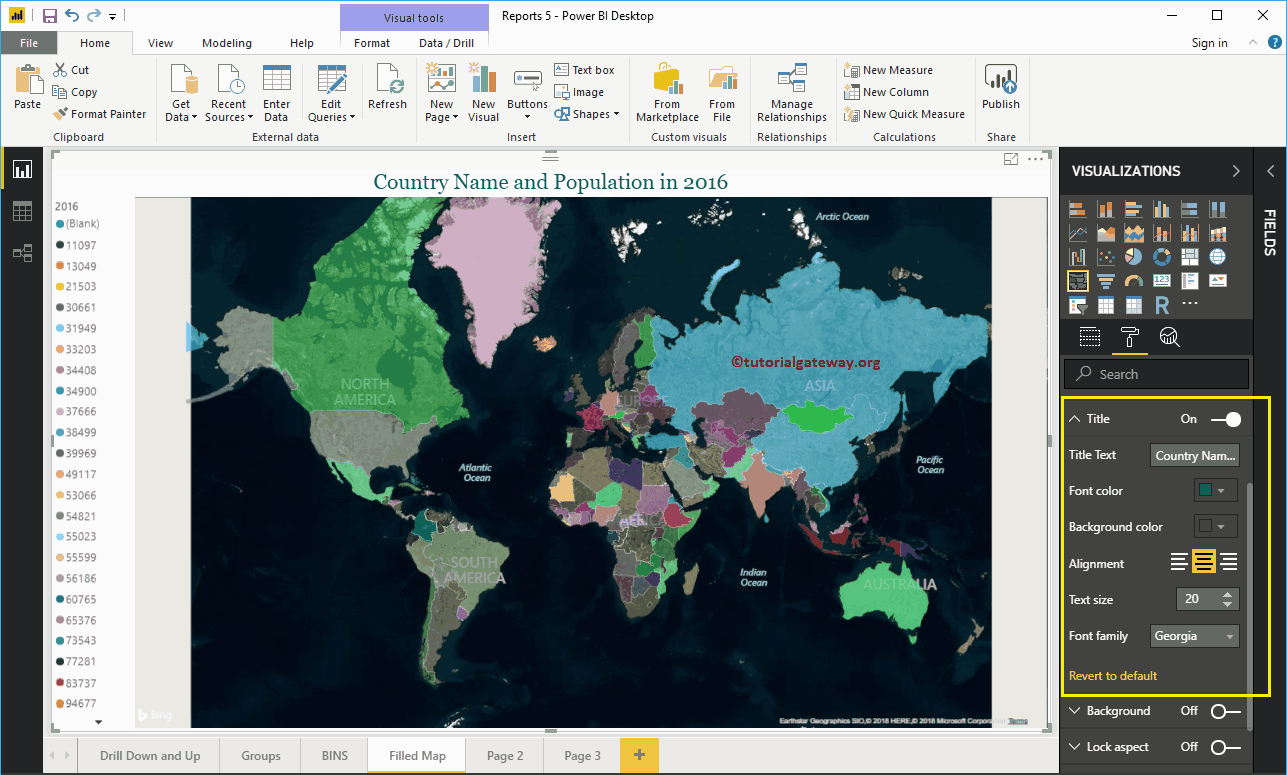
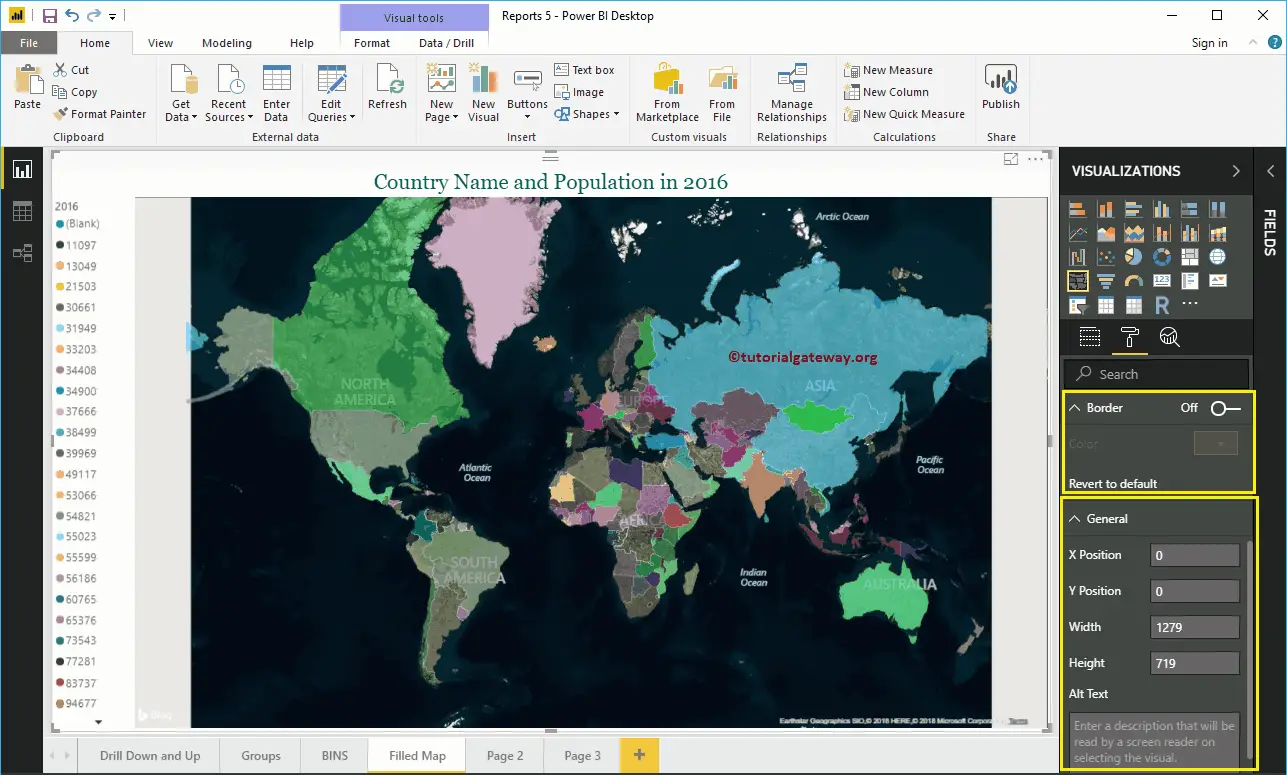
Let me do some quick formatting to this Power BI filled Map

NOTE: I suggest you to refer Format Filled Maps article to understand the formatting options.

Filled Map in Power BI 8

Hover-over any region to see the country name, and the country population.

Filled Map in Power BI 9


Format Power BI Filled Map

How to Format Power BI Filled Map with an example?. Formatting Power BI Filled Map includes changing the Map Color, filled Map Title text, Title position, background color, etc.


How to Format Power BI Filled Map

To demonstrate these filled Map formatting options, we are going to use the filled Map that we created earlier. Please refer to Create a Filled Map in Power BI article to understand the process of creating a filled map in Power BI.

Please click on the Format button to see the list of available formatting options for this filled map.

Format Power BI Filled Map 1

Format Legend of a filled Map in Power BI

As you can see from the screenshot below, we used the Position drop-down box to change the legend position to Left. Next, we changed the legend text size to 11.

Format Power BI Filled Map 2

Format Filled Map Data Colors

Use this Data Colors section to change the color of each and every individual area (here, it is country).

  Format Power BI Filled Map 3

Map Control in Power BI Filled Map

By default, auto zoom option enabled in this filled map. However, you can disable by toggling Auto zoom option from on to off.

Format Power BI Filled Map 4

Format Map Style of a Filed Map

Use this section to change the look or theme of a map.

Format Power BI Filled Map 5

Let me select the Aerial Theme.

Format Power BI Filled Map 6

Format Title of a Filled Map

By toggling the Title option from On to Off, you can disable the filled Map title.

From the screenshot below, you can see, we change the Font Color to Green, Text Size to 20, Title Alignment to center, and Font Family to Georgia. If you want, you can add the background color to the title as well.

Format Power BI Filled Map 7

Format Background Color of a Filled Map in Power BI

You can add the Background color to a filled Map by toggling Background option to On. For the demonstration purpose, we added yellow color with 17% transparency.

Format Power BI Filled Map 8

Format Borders and General settings of a filled Map

You can add Borders to a filled Map by toggling the Border option from Off to On. Similarly, use this General Section to Change the filled map X, Y position, Width, and height

Format Power BI Filled Map 9


Ratings

Rating is available to Members only.

Please login or register to vote.

No Ratings have been Posted.
Render time: 0.71 seconds
9,316,406 unique visits