Let me show you how to create a Table in Power BI with example. For this Power BI table report demonstration, we are going to use the SQL Data Source that we created in our previous article.
Please refer to Connect Power BI to SQL Server article to understand the Power BI Data Source.
How to Create a Table in Power BI
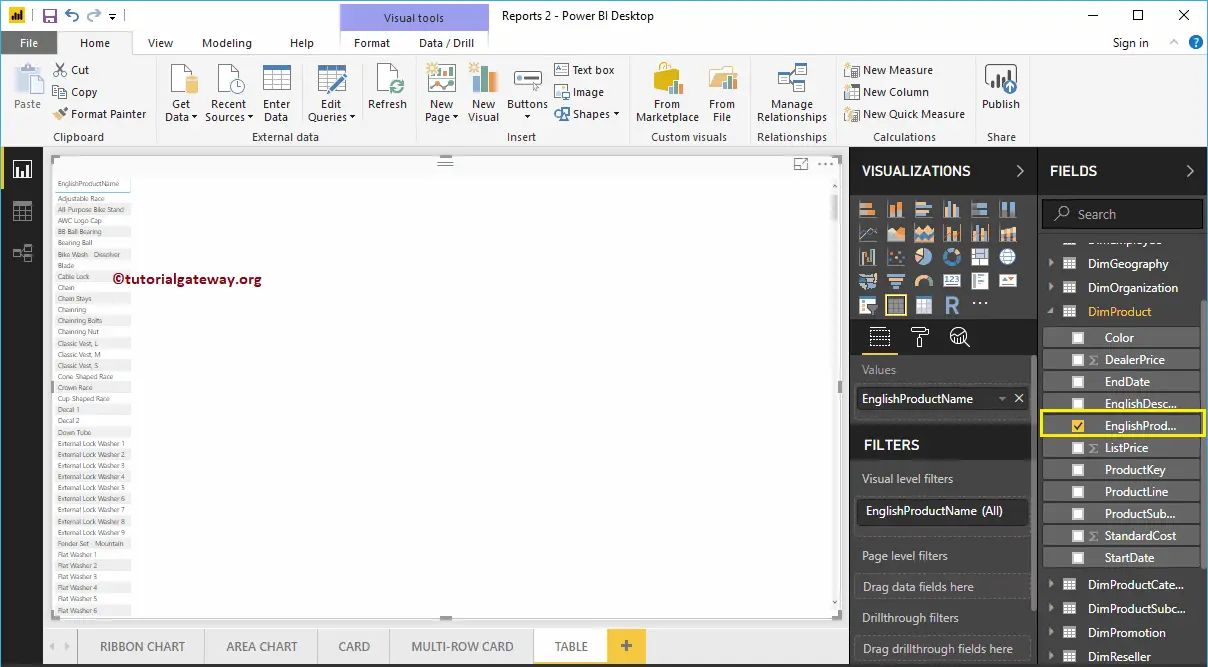
If you drag and drop any dimension field, then Power BI automatically creates a table for you.
Let me drag and drop the English Product Name from the Fields section to Canvas, as you can see from the screenshot below, desktop automatically creating a table for you.
Creating a Table Approach 2
If you want to convert the existing chart to the table, then you can follow this step. As you can see from the screenshot below, we created a column chart, which represents the Sales Amount by Product Name.
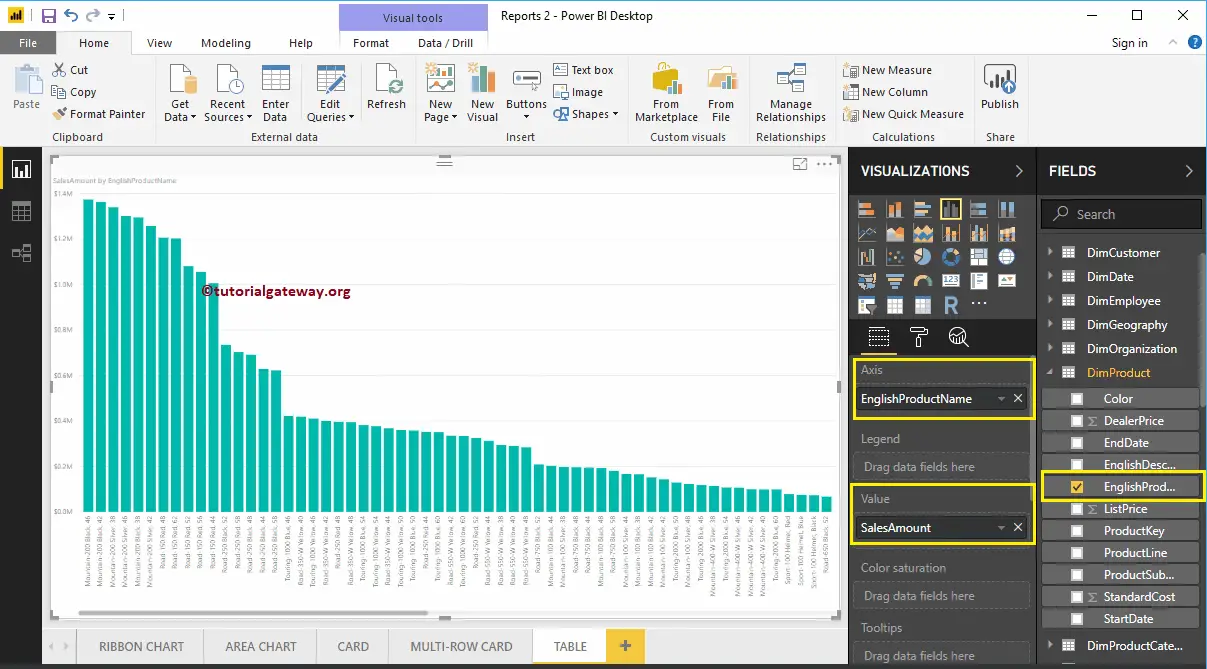
Click on the Table under the Visualization section. It automatically converts the Column Chart into a Table. From the below screenshot, you can see the Tabular representation of Product names and their Sales Amount.
Create a Table in Power BI Approach 3
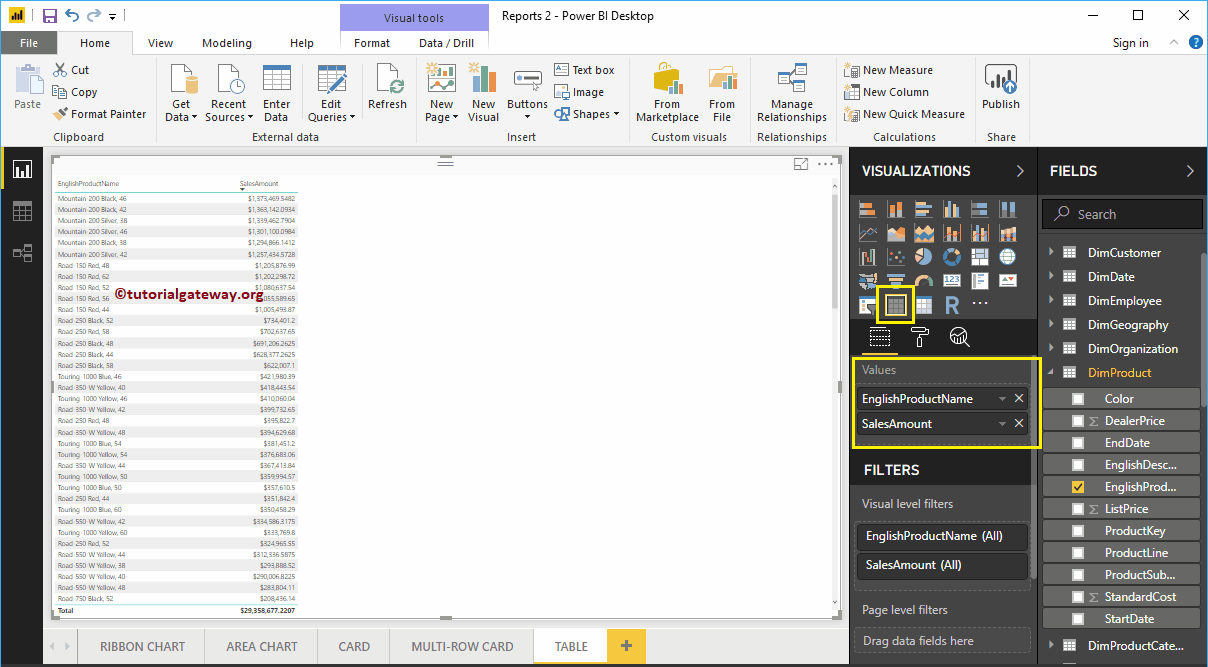
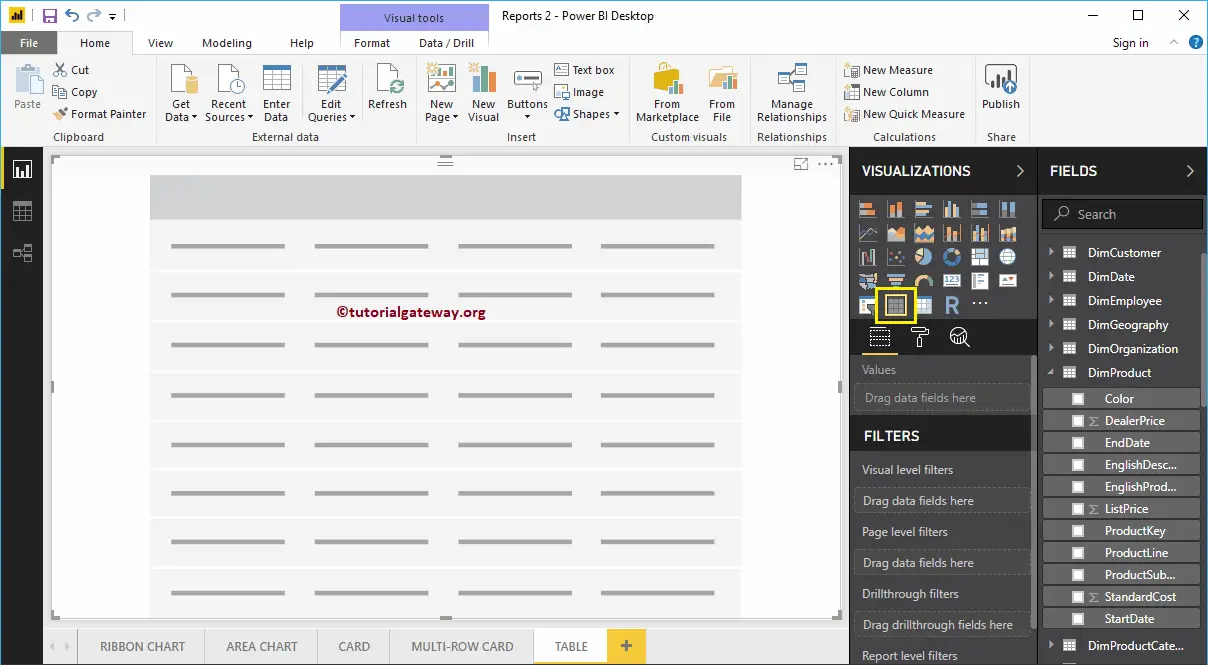
First, click on the Table present in the Visualization section. It automatically creates a Table with dummy data, as shown in the below screenshot.
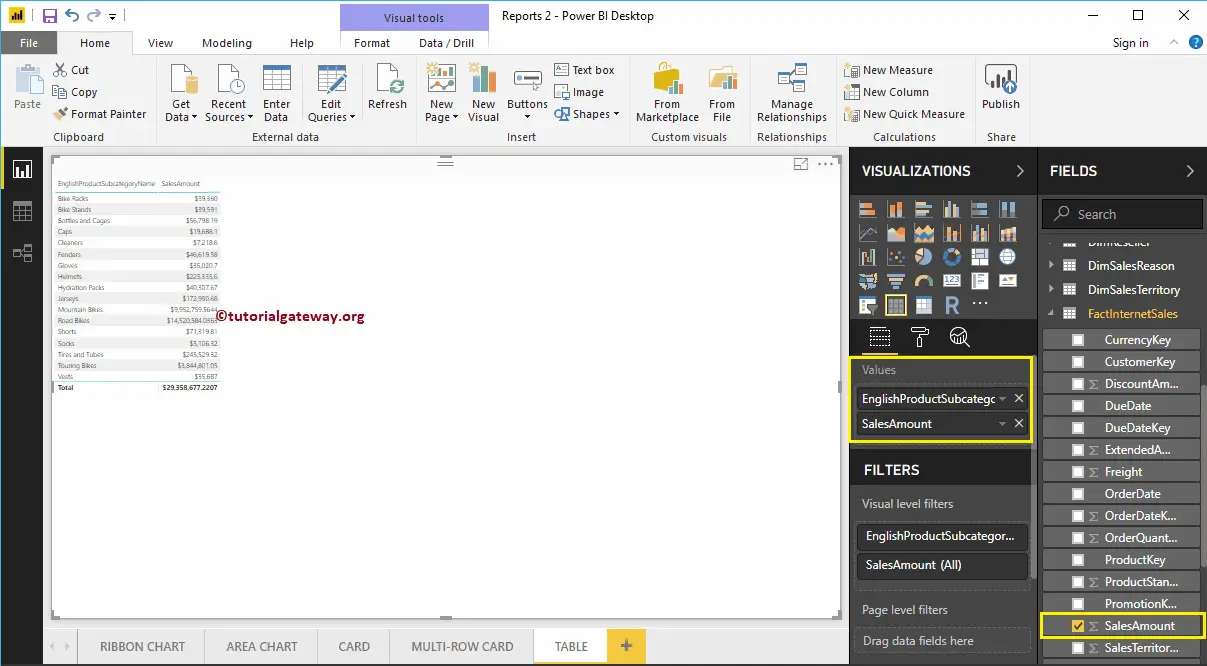
Next, let me drag the English product Subcategory Names and Sales Amount to the Values section. Now, you can see the table.
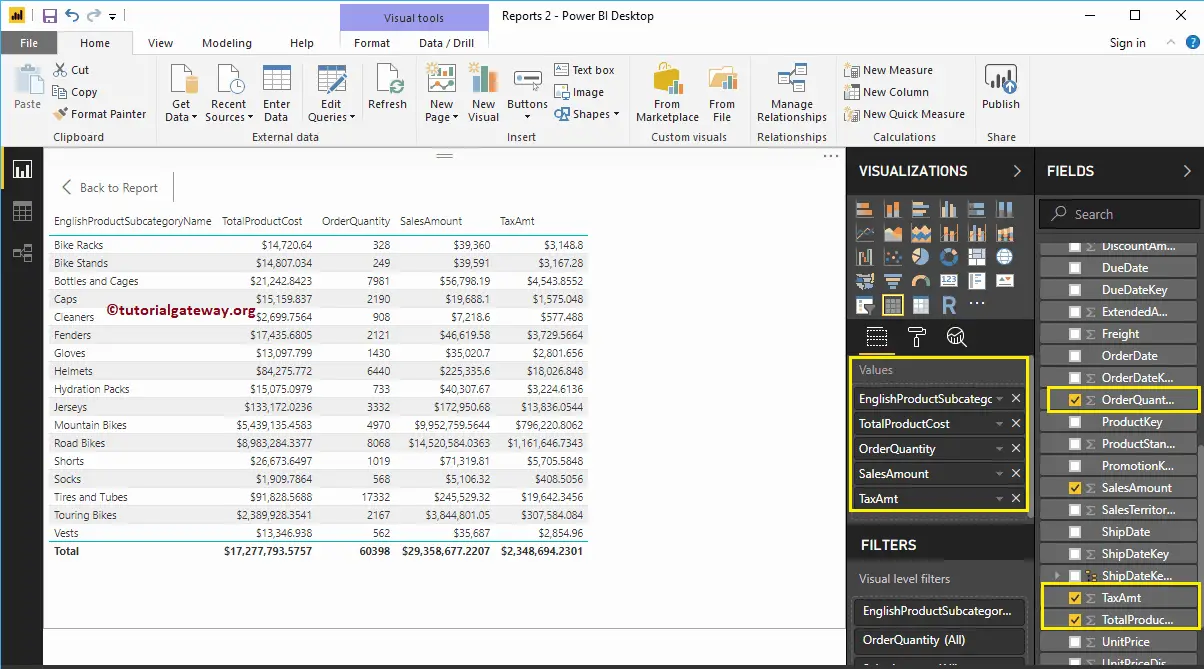
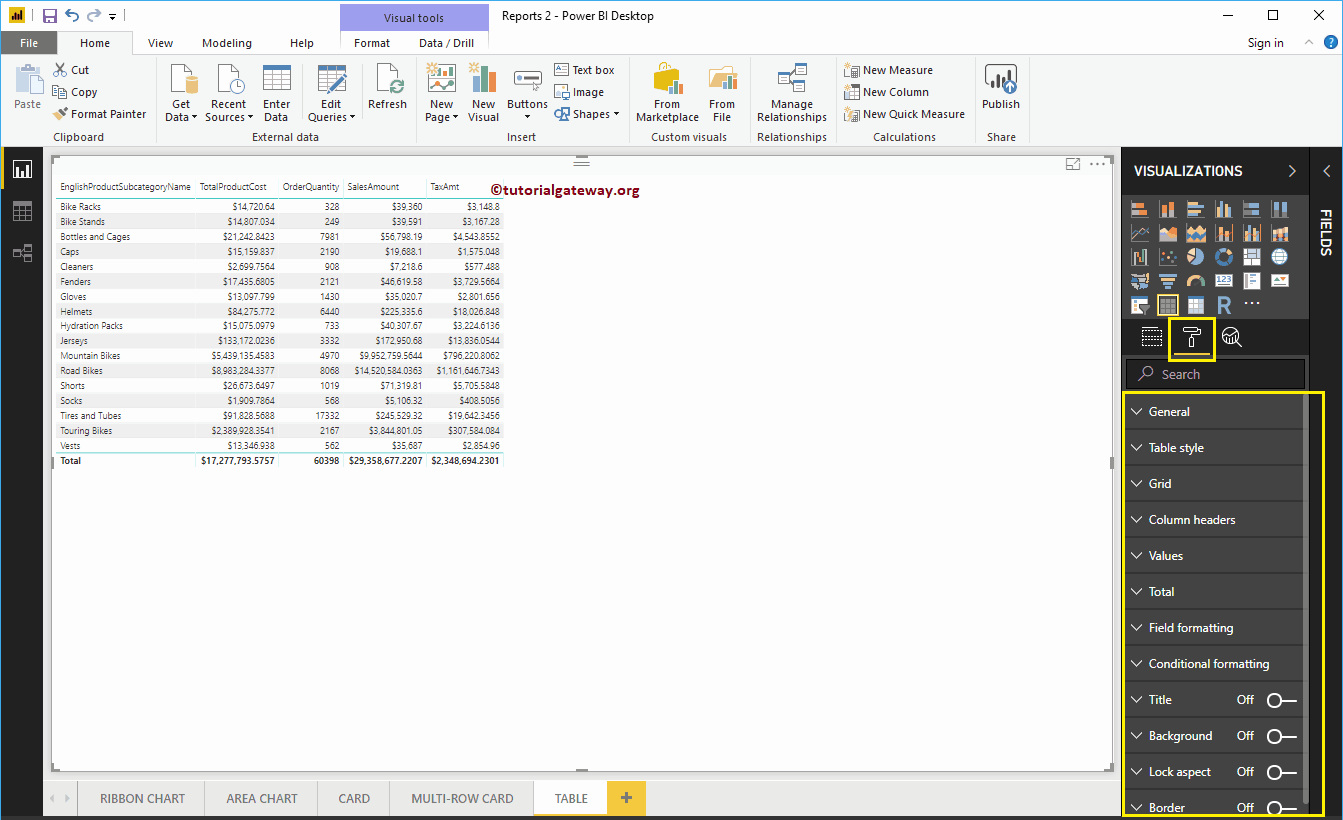
Let me add few more metric values such as Total Product Cost, Order Quantity, and Tax amount
Let me do some quick formatting to this Table
NOTE: I suggest you refer to Format a Table article to understand the formatting options.
How to Format Power BI Table report with an example?. The Power BI Format Table includes changing the table Grid Colors, Row Colors, Column formatting, row formatting, Table Title text, and background color, etc.
To demonstrate these Power BI table formatting options, we are going to use the Table that we created earlier. Please refer to Create a Table in Power BI article to understand the steps involved in creating a Power BI table.
How to Format Power BI Table
Please click on the Format button to see the list of table formatting options that are available.
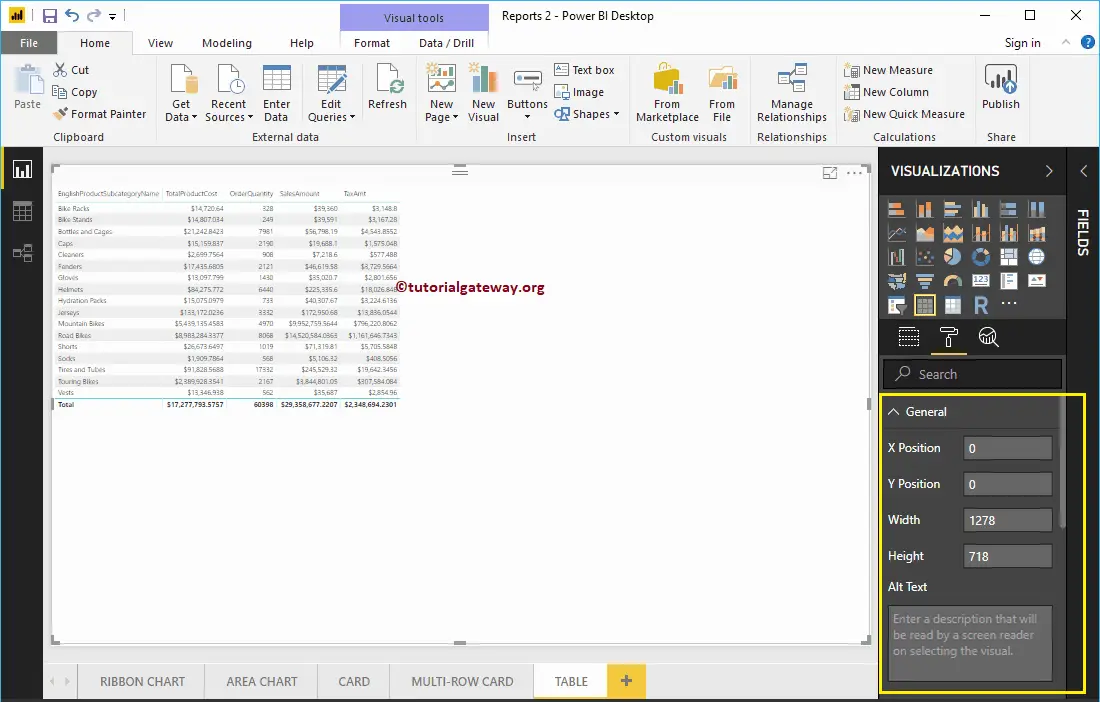
Format Power BI Table General Settings
Use this General Section to Change the X, Y position, Width and height of a table
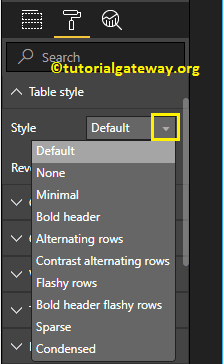
Format Power BI Table Style
From the below screenshot, you can see the list of styles that are available to style this table. Please select the style as per your requirement.
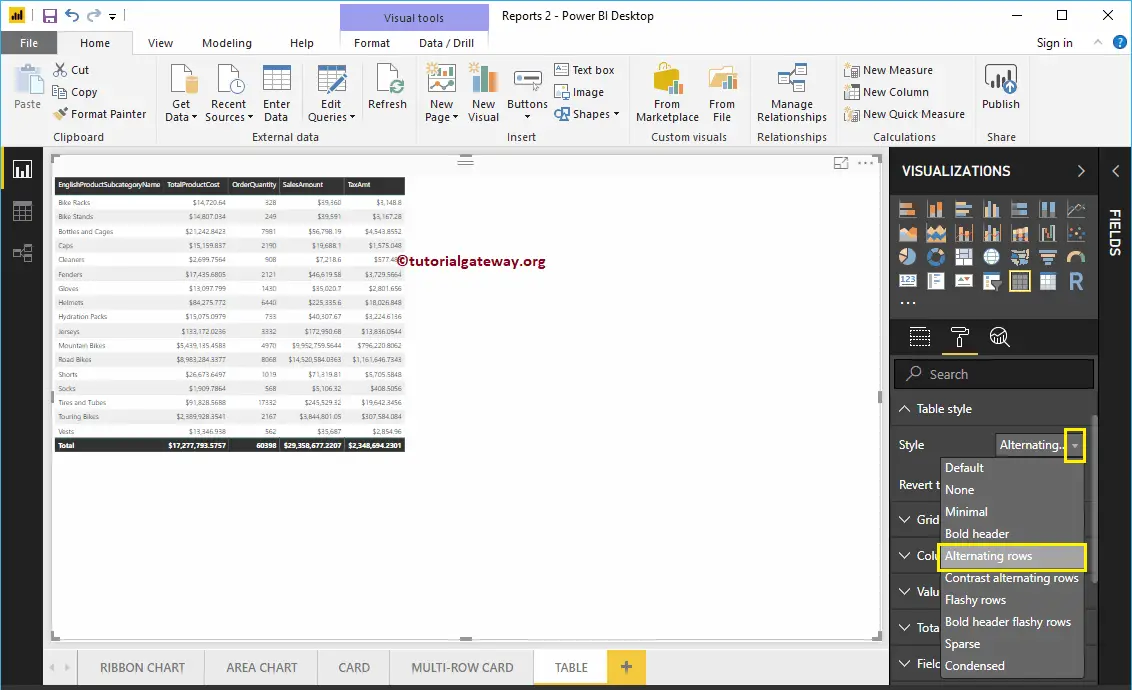
For now, we are selecting the Alternating Rows option from the drop-down list. Remember, this is the default option for any table, and it adds alternative row colors.
Format Grid of a Table in Power BI
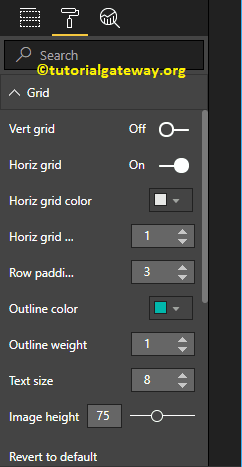
The following are the list of options that are available for you to format the Grid.
- Vert Grid : Toggling this option from Off to On adds Vertical Grid. Nothing but enabling Vertical line to separate each column.
- Horiz Grid : It adds Horizontal Grid. Nothing but enabling Horizontal line to separate each row.
- Horiz Grid Color: Changing the Color of a Horizontal Grid.
- Horiz Grid thickness: Horizontal Grid Line width
- Row Padding: Space between the rows. Let me change it to 3 to increase the space
As you can see from the below screenshot, we enabled the Vertical Grid, and assigned some random colors.
- Vert Grid Color: Change the Color of a Vertical Grid.
- Vert Grid thickness: Vertical Grid Line width or stroke
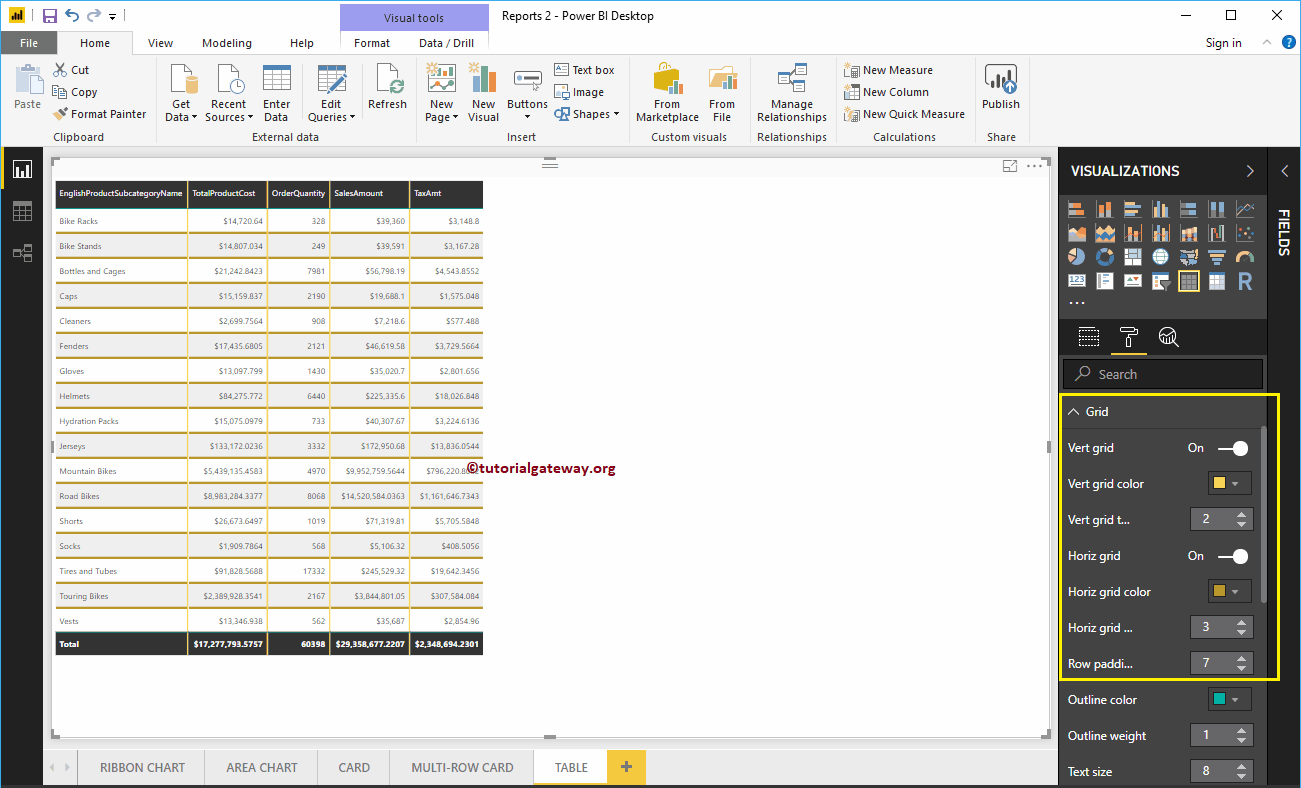
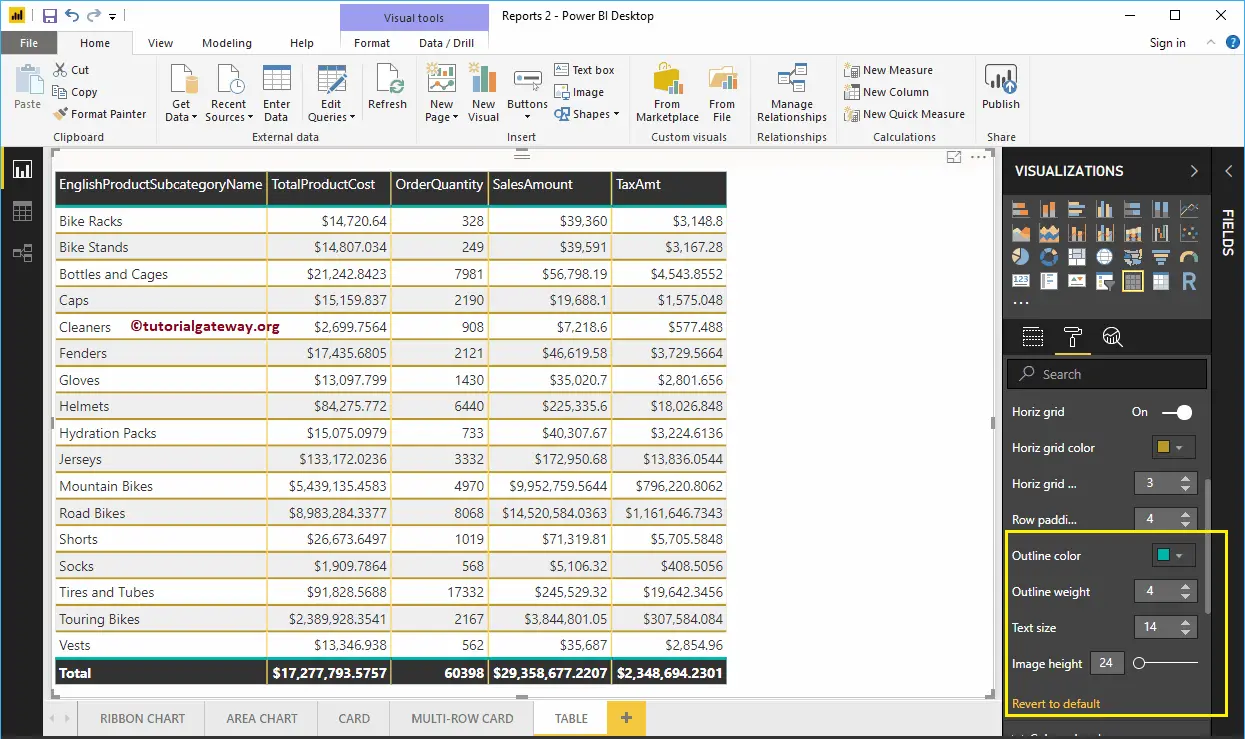
- Outline Color: Color Before the first row start, and after the last row. We are using the default green as the Outline color.
- Outline Weight: Line width. We changed the line stroke to 4
- Text Size: Font size of table values. Let me change the text size to 14
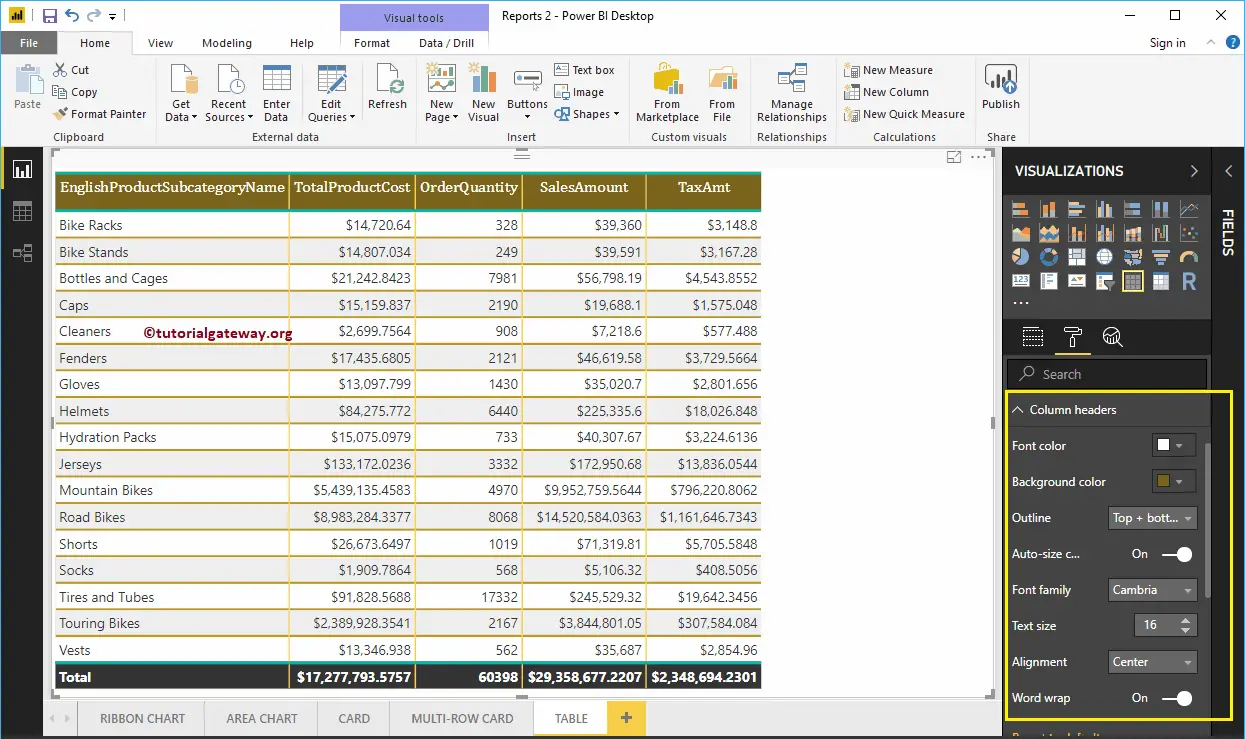
Format Column Headers of a Table in Power BI
This section is to alter the Header Colors. As you can see from the screenshot below, we changed the Font color to White, Background color to olive green. Next, Outline to Top + Bottom (Outline added to the top and bottom of a Header), Font Family to Cambria, Text Size to 26, and Header text alignment to center.
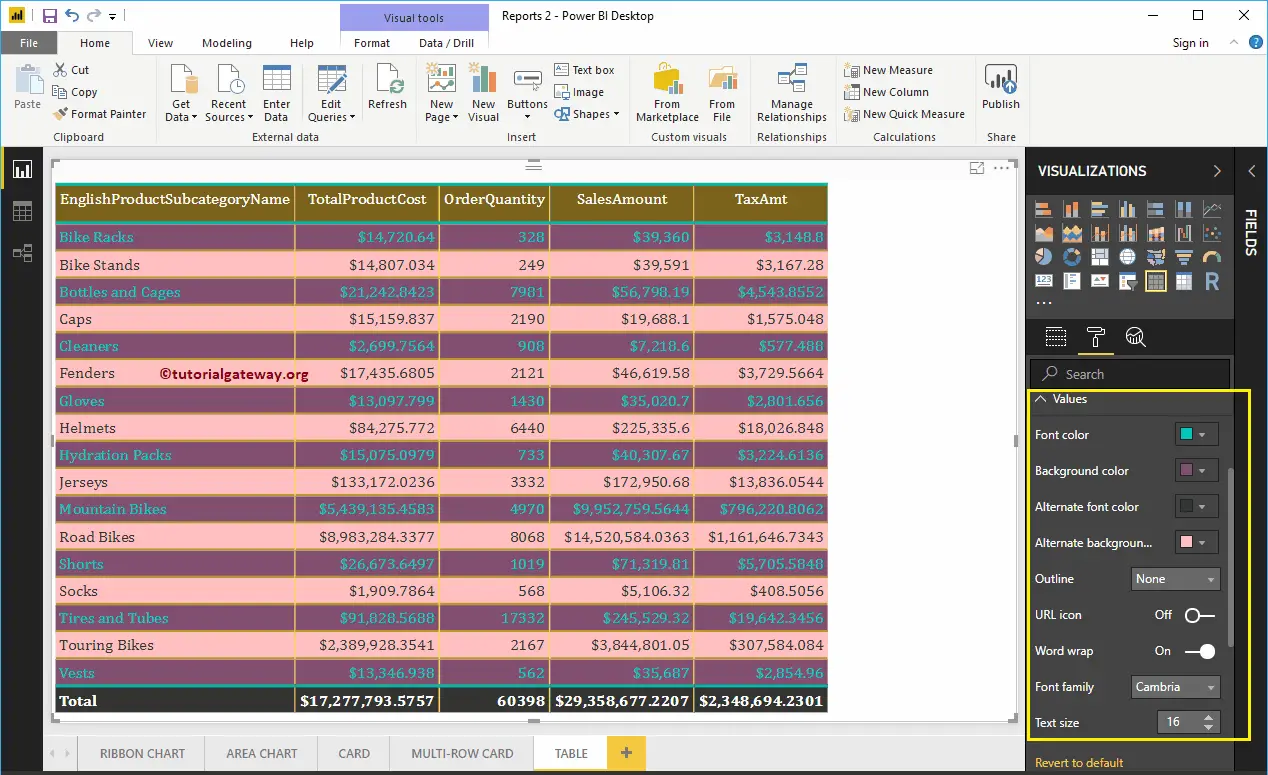
Format Values of a Table in Power BI
You can use this section to change the table values. As you can see from the screenshot below, we changed the Font colors and Back color of the even and odd rows. Here, we also changed the Font-family to Cambria, and Text size to 16
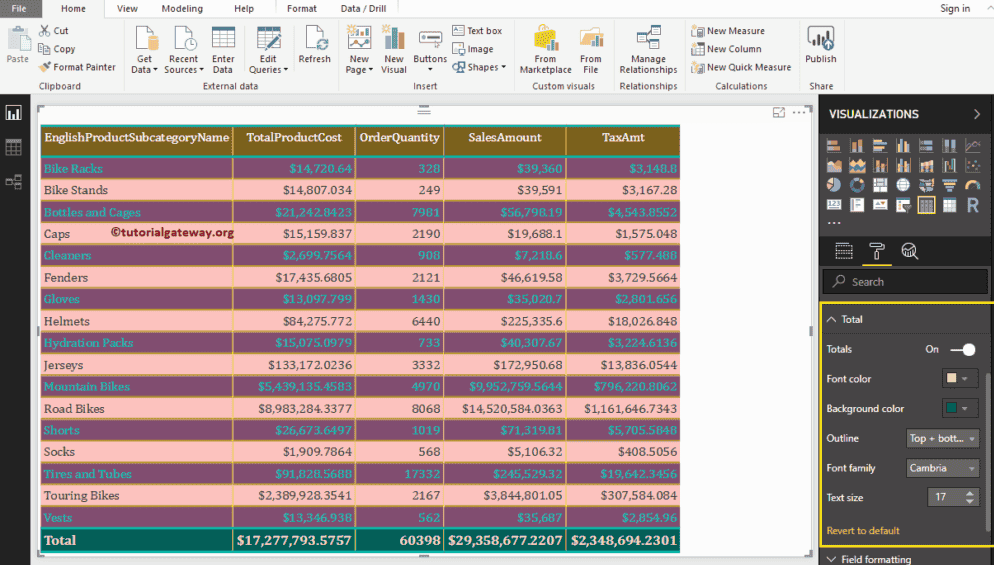
Format Total of a Table in Power BI
Use this Total section to alter the text and background color of Total. As you can see from the screenshot below, we changed the Totals Font color. Next, Background color to green, Outline to Top + Bottom (Outline added to the top and bottom of Total), Font Family to Cambria, and Text Size to 17.
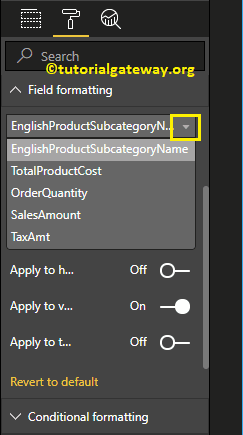
Format Power BI Table – Field Formatting
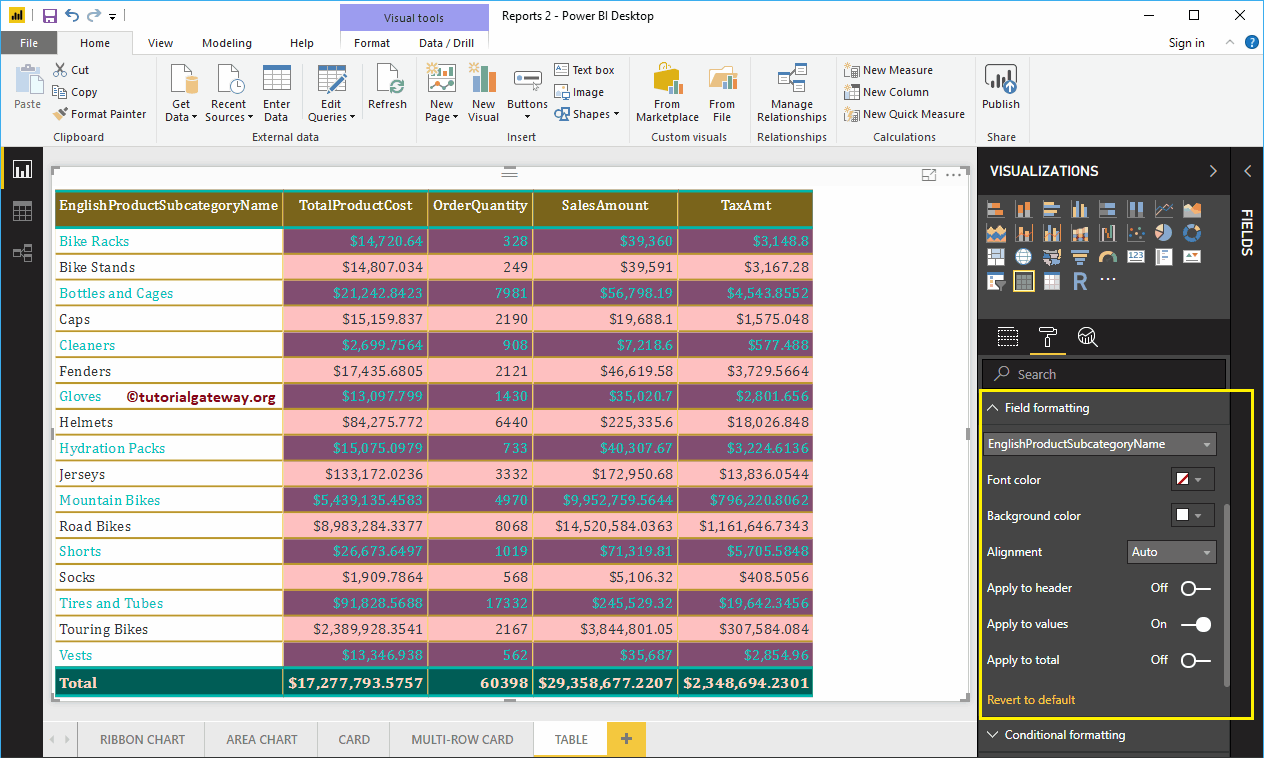
Use this section to format individual columns in a table. For example, you can use this section to assign a completely different color to one column. Here, we are selecting the English Product Sub-Category Name.
For the demo purpose, we changed the background color to white for this column only.
Format Power BI Table Conditional Formatting
Use this section to format Metric columns (Numeric) in a table. For now, we are selecting the Total Product Cost.
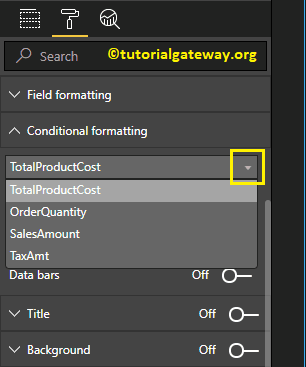
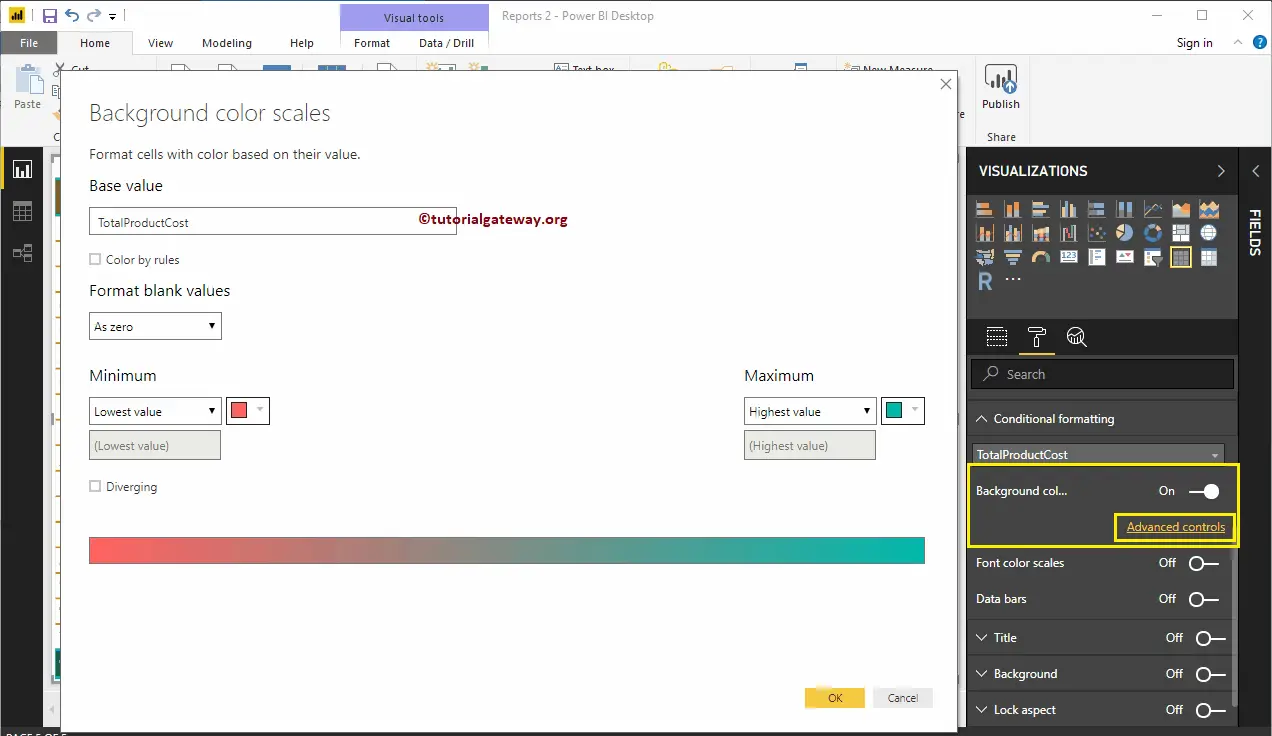
Selecting any numeric column opens the following window.
- Minimum: Color at Minimum Total Sales Amount
- Maximum: Color at Maximum Total Sales Amount
- Diverging: You can checkmark this option to assign diverging colors to this column.
We write a separate article to explain these settings
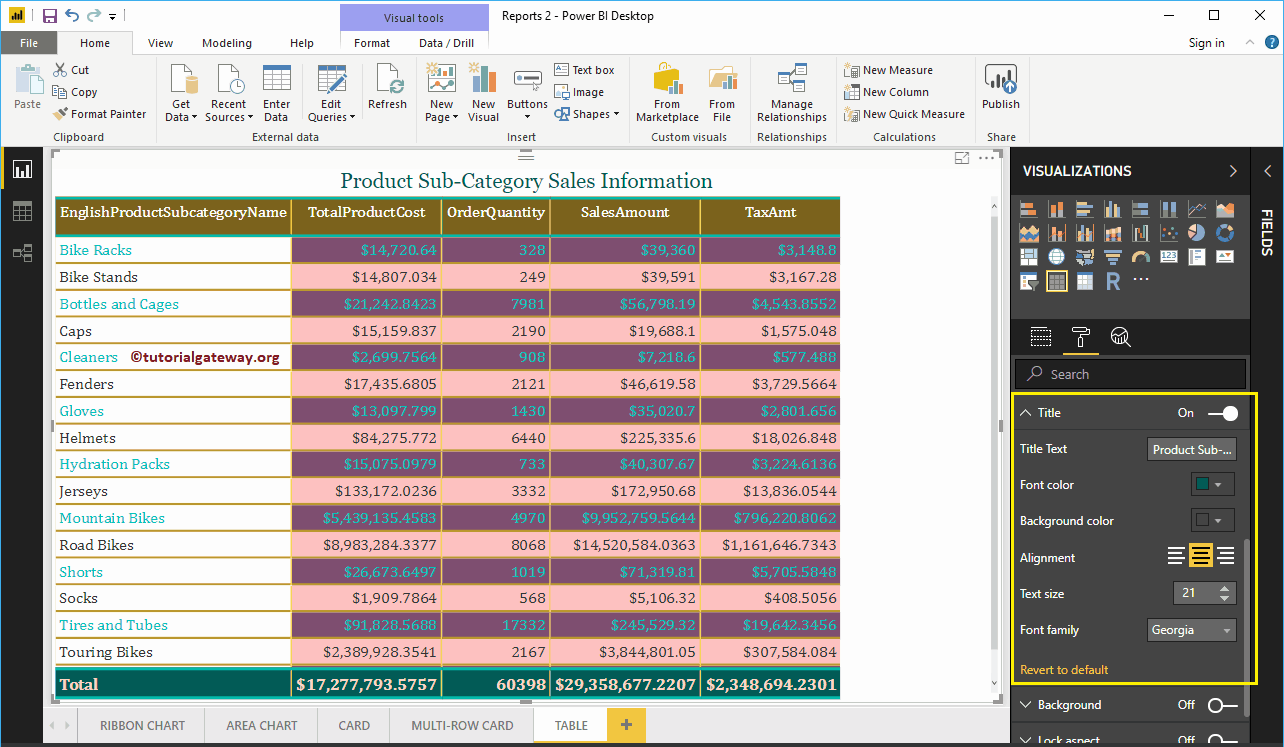
Format Power BI Table Title
By toggling the Title option from Off to On, you can enable the Table title.
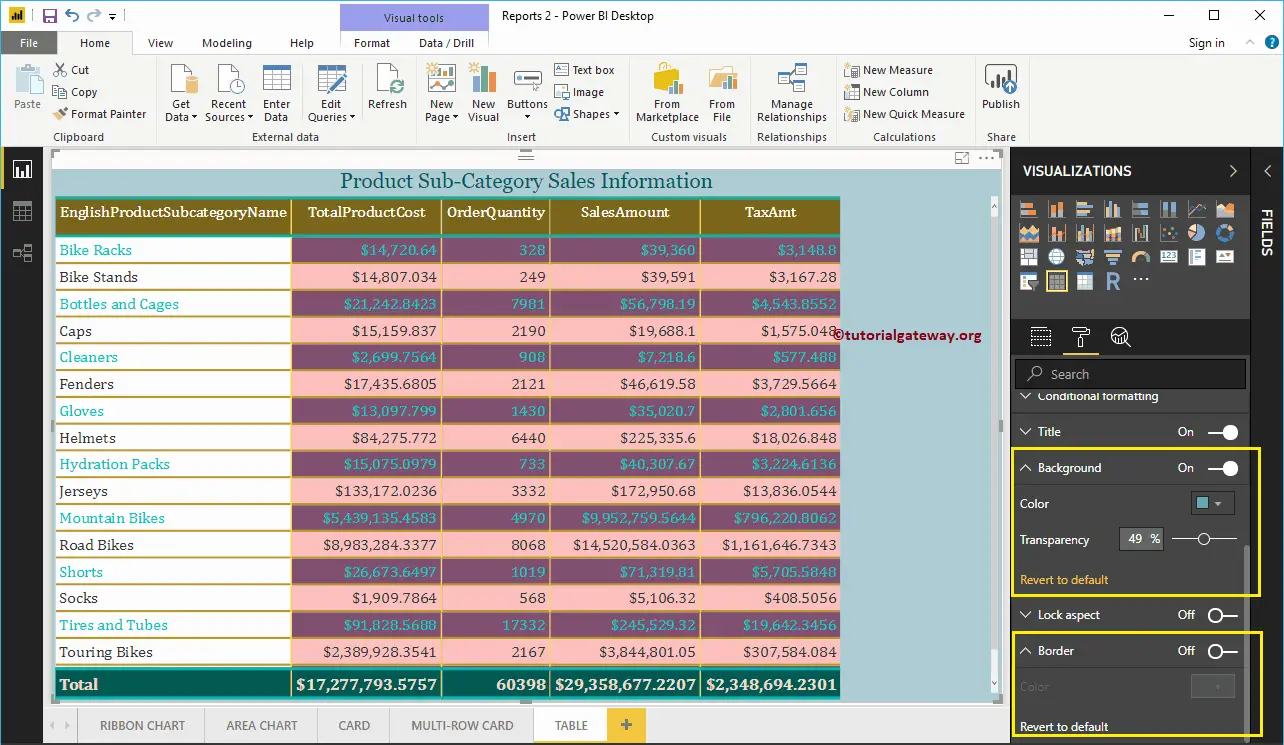
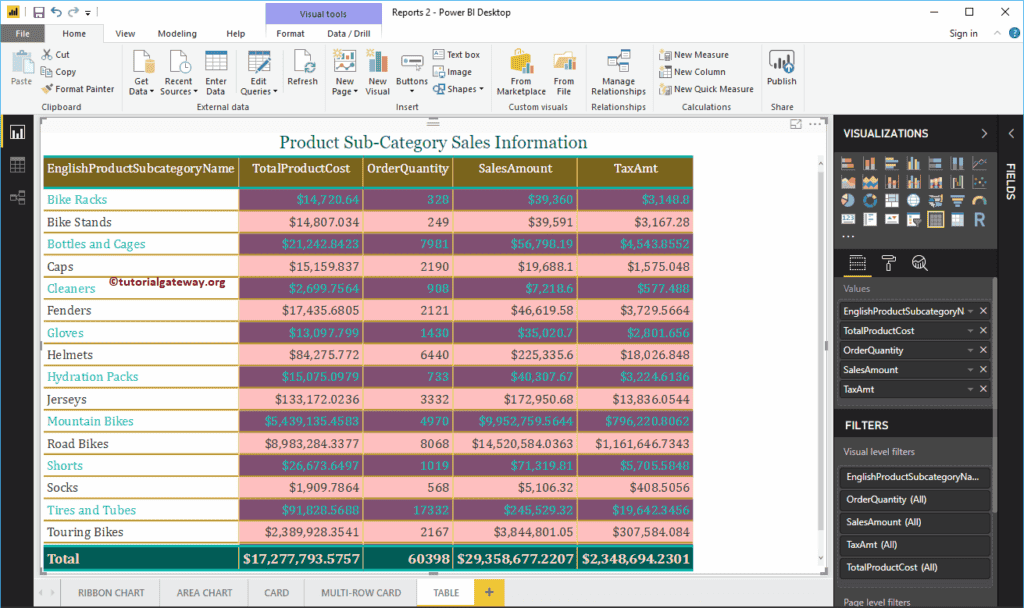
From the below screenshot you can see, we added the Title Text as Product Sub-Category Sales Information. Next, Font Color to Green, Font Family to Georgia, Text Size to 21, and Title Alignment to center. If you want, you can add the background Color to the Table title as well.
Format Power BI Table Background Color, and Borders
You can add a Background color to a table by toggling Background option to On. For the demonstration purpose, we added sky blue with 49% transparency.
Similarly, you can add Borders to a table by toggling the Border option from Off to On.