Power BI Matrix also called as Cross tab, is useful to display the relationships between two or more than two groups. Let me show you how to Create a Matrix in Power BI with example.
For this Power BI Matrix demonstration, we are going to use the SQL Data Source that we created in our previous article. So, Please refer to Connect Power BI to SQL Server article to understand the Power BI Data Source.
How to Create a Matrix in Power BI
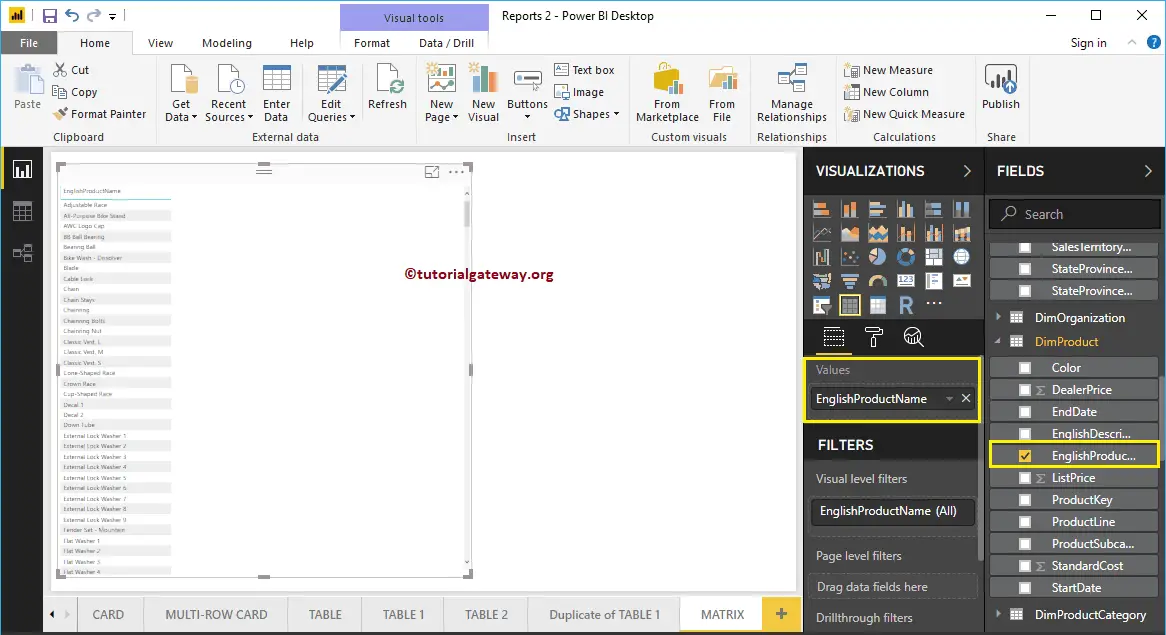
When you drag any dimension field to the Canvas, Power BI automatically creates a table. Let me drag and drop the English Product Name from the Fields section to Canvas. And you can see the table.
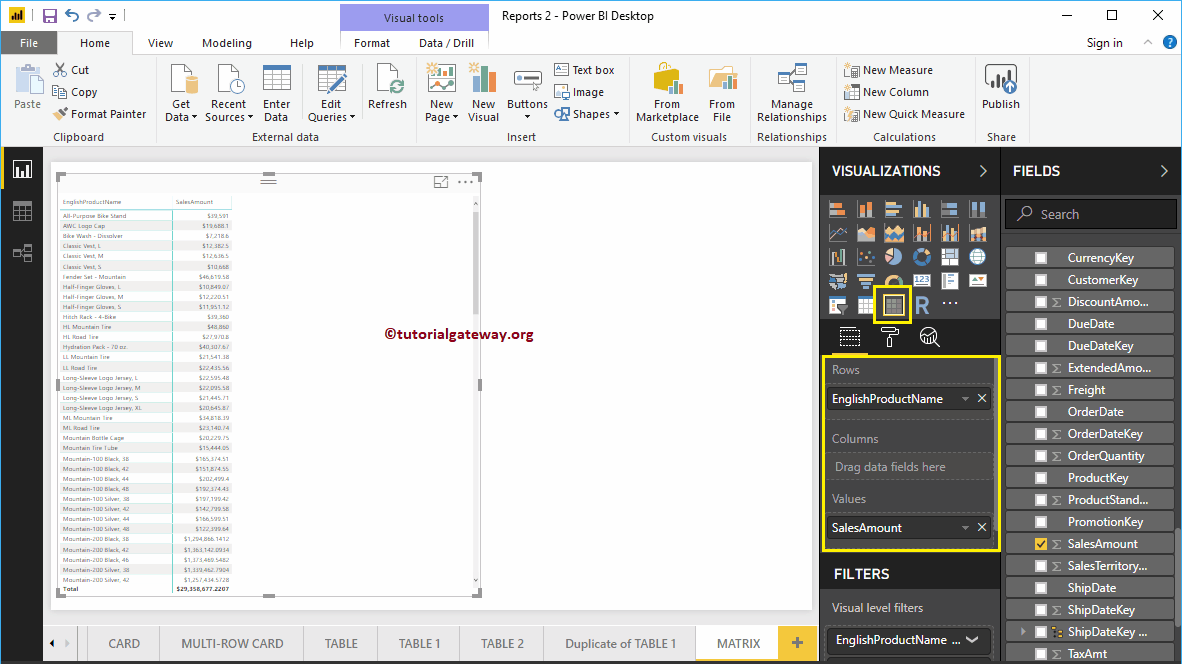
Next, let me drag one metric value (Sales Amount) to the Values section and click on the Matrix under the Visualization section.
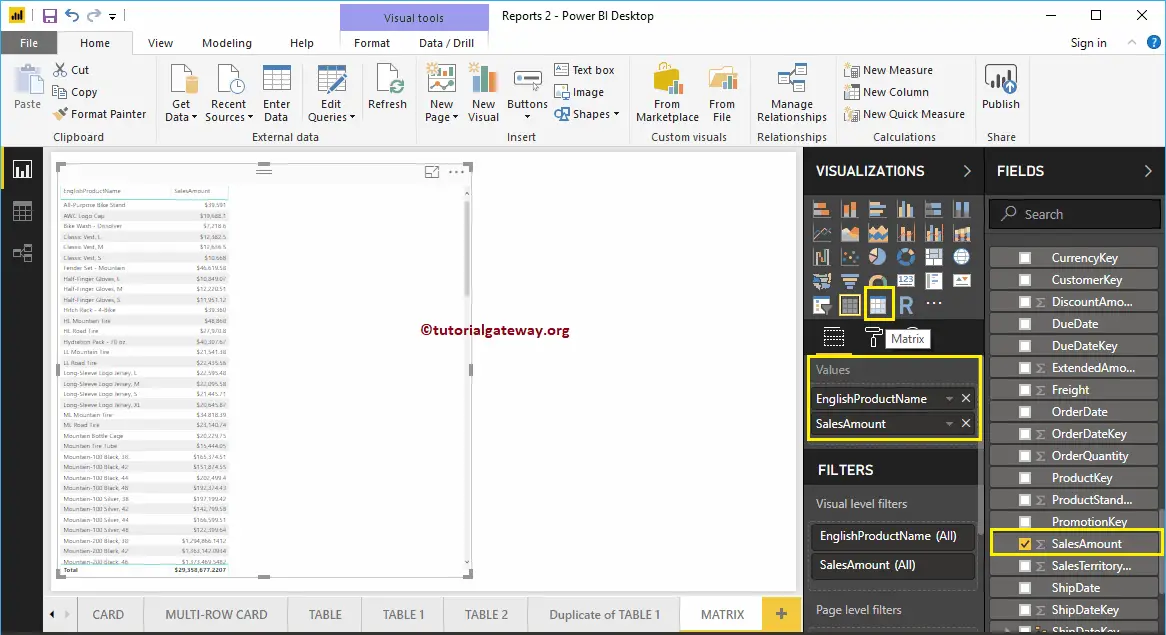
Clicking the Matrix will automatically convert a Table into a Matrix. From the screenshot below, you can see the Matrix representation of English Product names and Sales Amount.
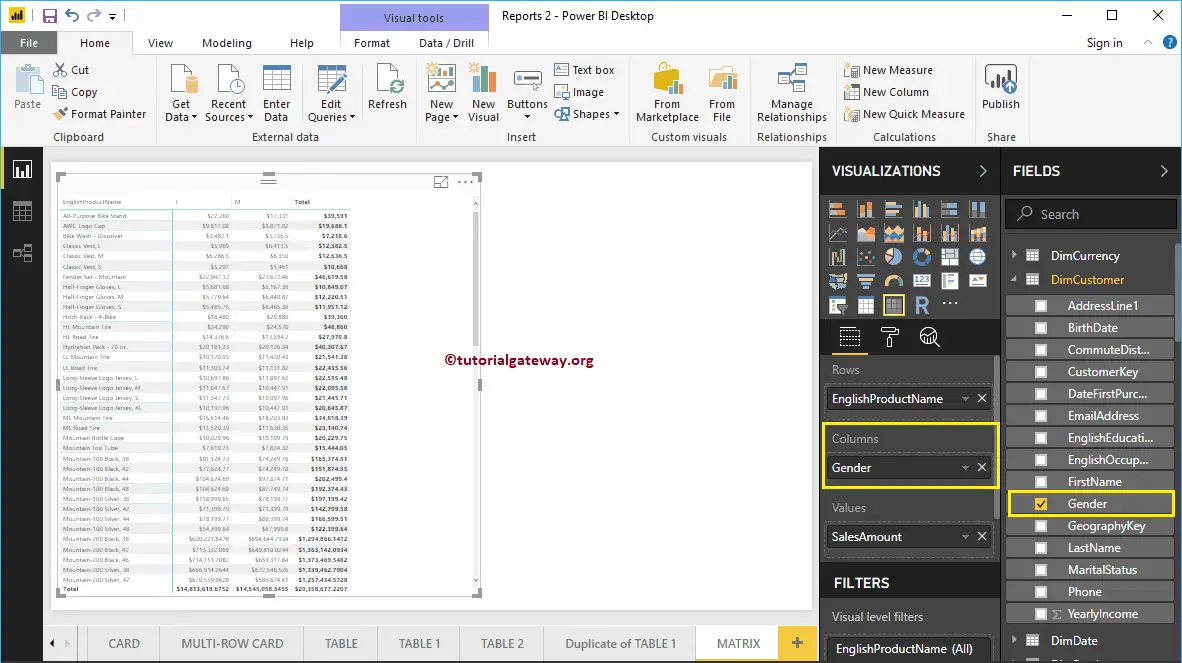
Let me add one more column group so that you can understand the Matrix. As you can see, we added Customer gender to the Column Groups.
Create a Matrix in Power BI Approach 2
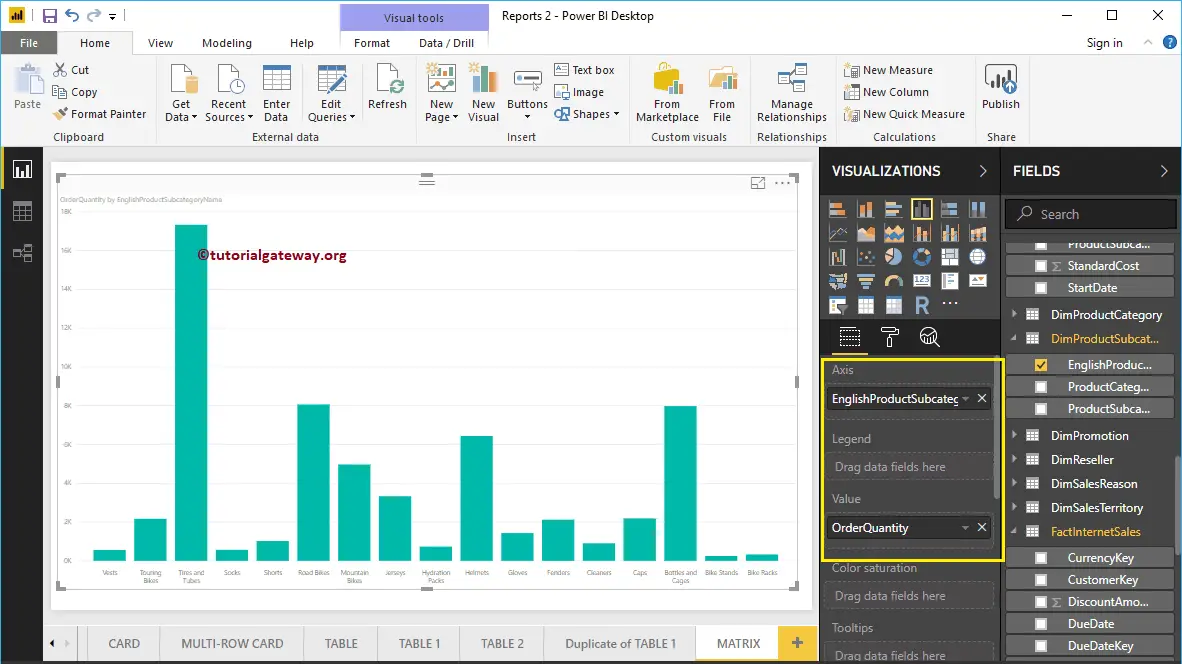
If you want to convert the existing chart into Power BI Matrix, then you can follow this step. As you can see from the screenshot below, we created a column chart, which represents the Order Quantity by English Product Subcategory.
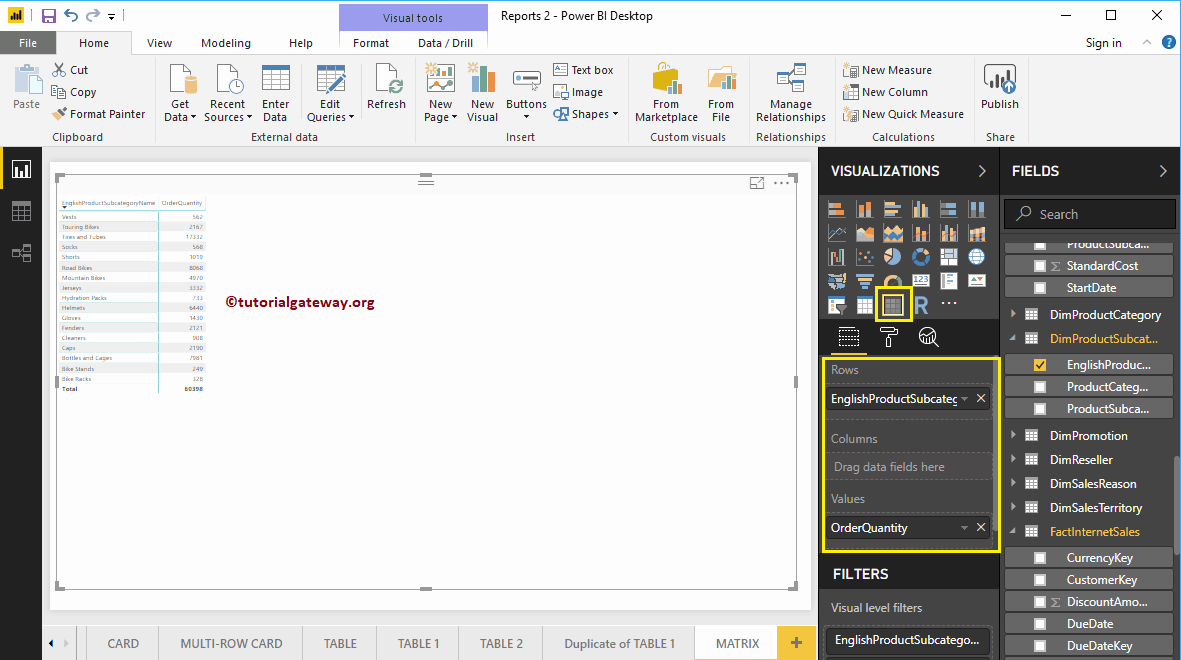
Click on the Matrix under the Visualization section automatically convert the Column Chart into a Matrix.
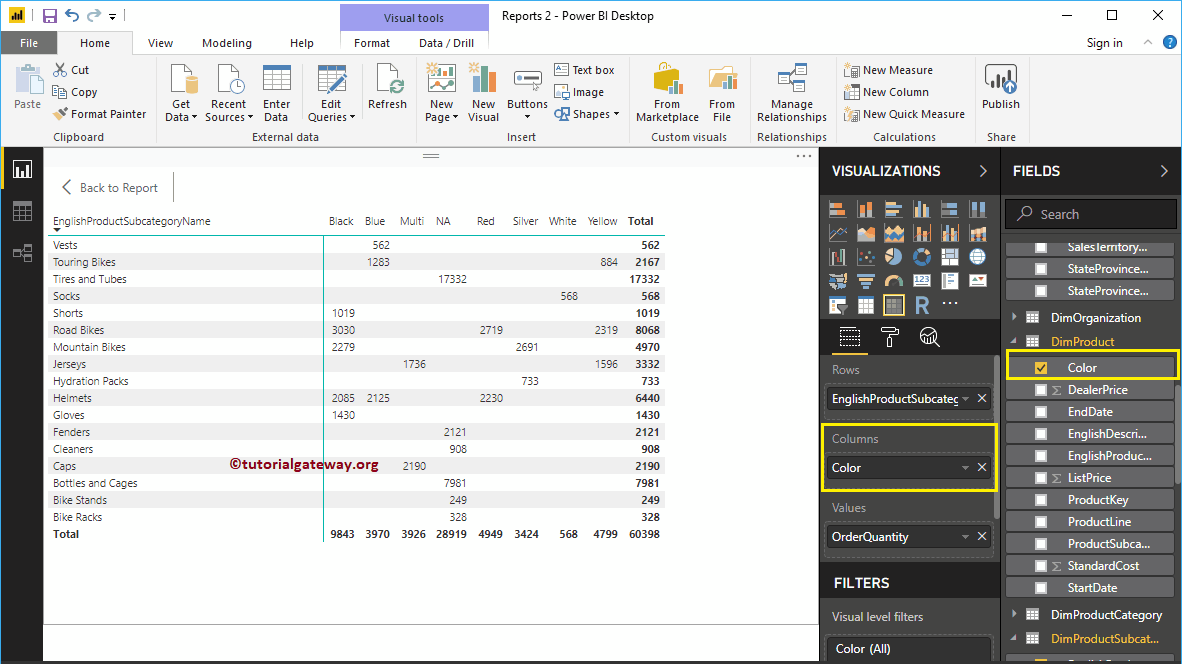
Let me add the Product Color to the Column Group
Create a Matrix in Power BI Approach 3
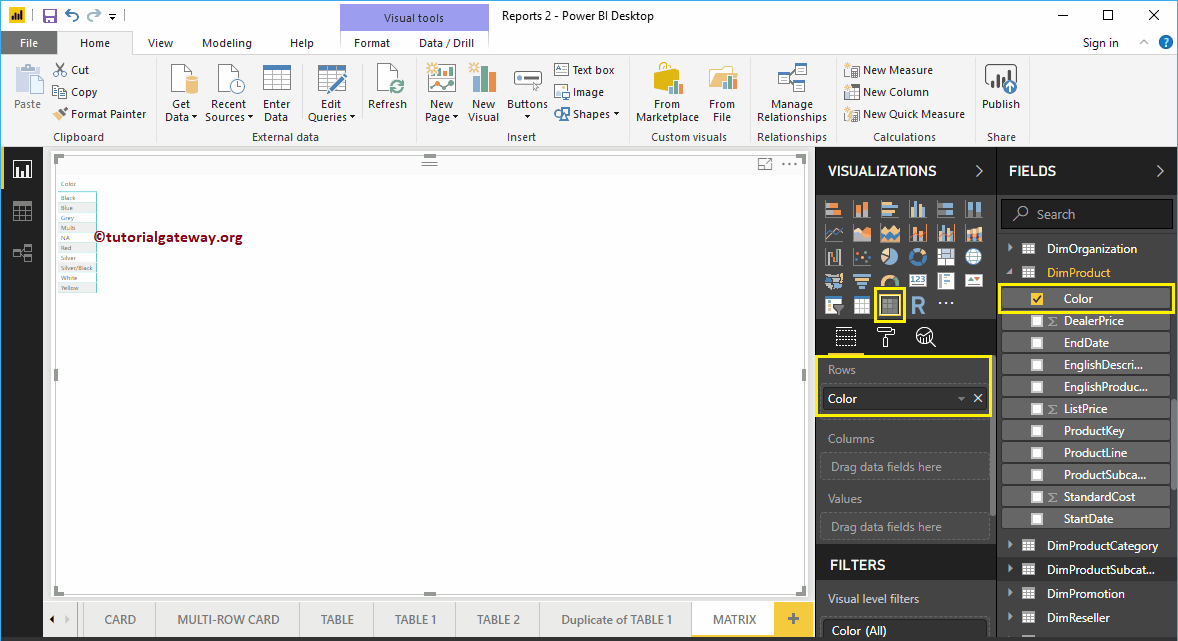
First, click on the Matrix present in the Visualization section. It automatically creates a Matrix with dummy data. Next, let me add the product Color as the Row Group.
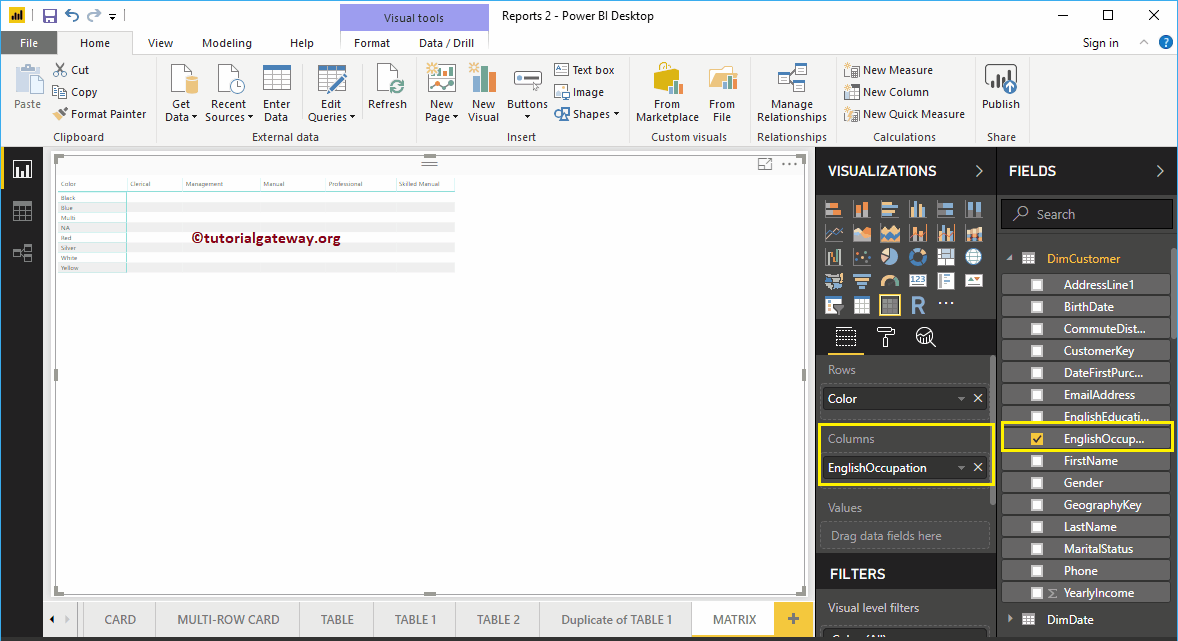
Next, drag and drop the English Occupation to the Column Groups. Now, you can see the Matrix.
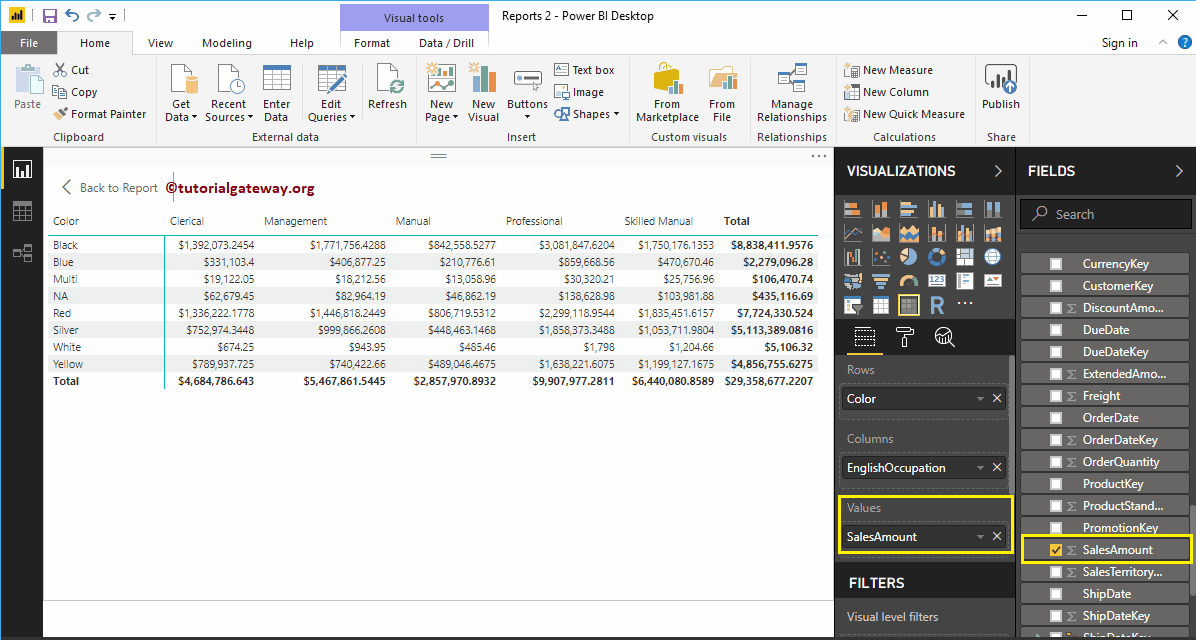
Next, let me drag the Sales Amount to the Values section. It automatically enables the Subtotals and grand totals.
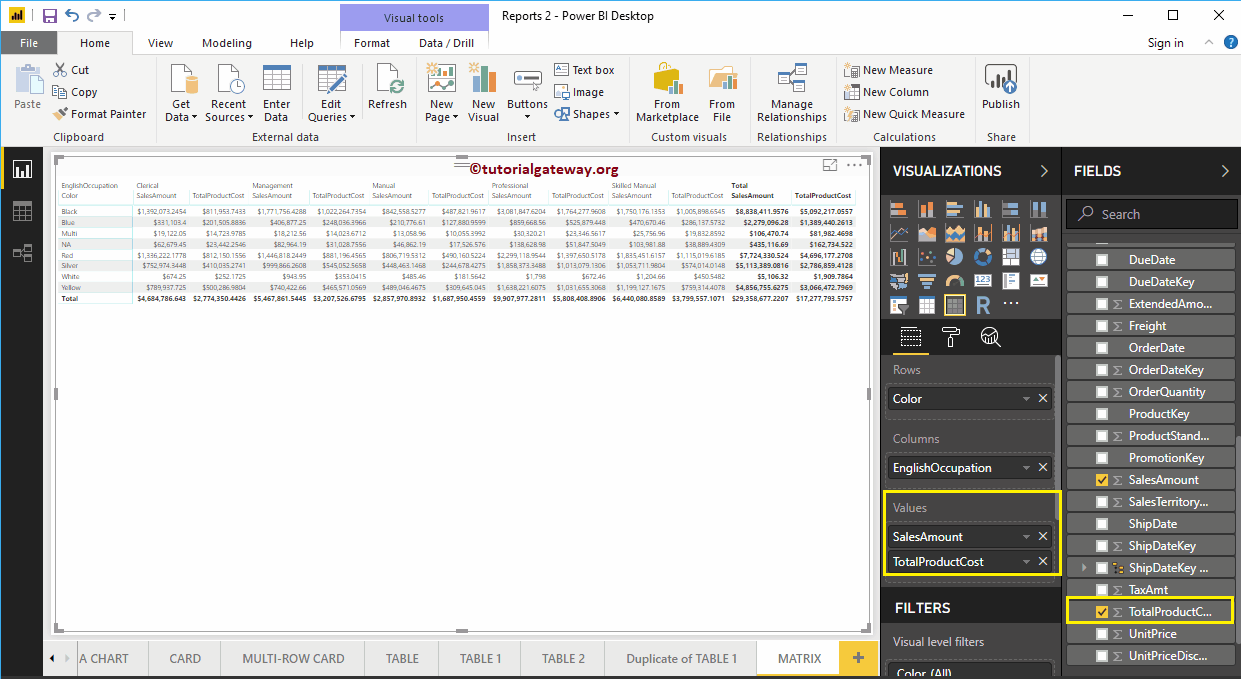
For this Power BI Matrix demonstration purpose, we are adding one more metric field, i.e., Total Product Cost to the Values section.
Let me do some quick formatting to this Power BI Matrix
NOTE: I suggest you refer to Format a Matrix article to understand the formatting options.
How to Format Power BI Matrix report with an example?. The Power BI Formatting Matrix includes changing the Matrix Grid Colors, Row formatting, Column formatting, row and column colors, Matrix Title text, and background color, etc.
To demonstrate these Power BI matrix formatting options, we are going to use the Matrix that we created earlier. Please refer to Create a Matrix in Power BI article to understand the steps involved in creating a Power BI Matrix.
How to Format Power BI Matrix
Please click on the Format button to see the list of Matrix formatting options that are available in Power BI.

Format Power BI Matrix General Settings
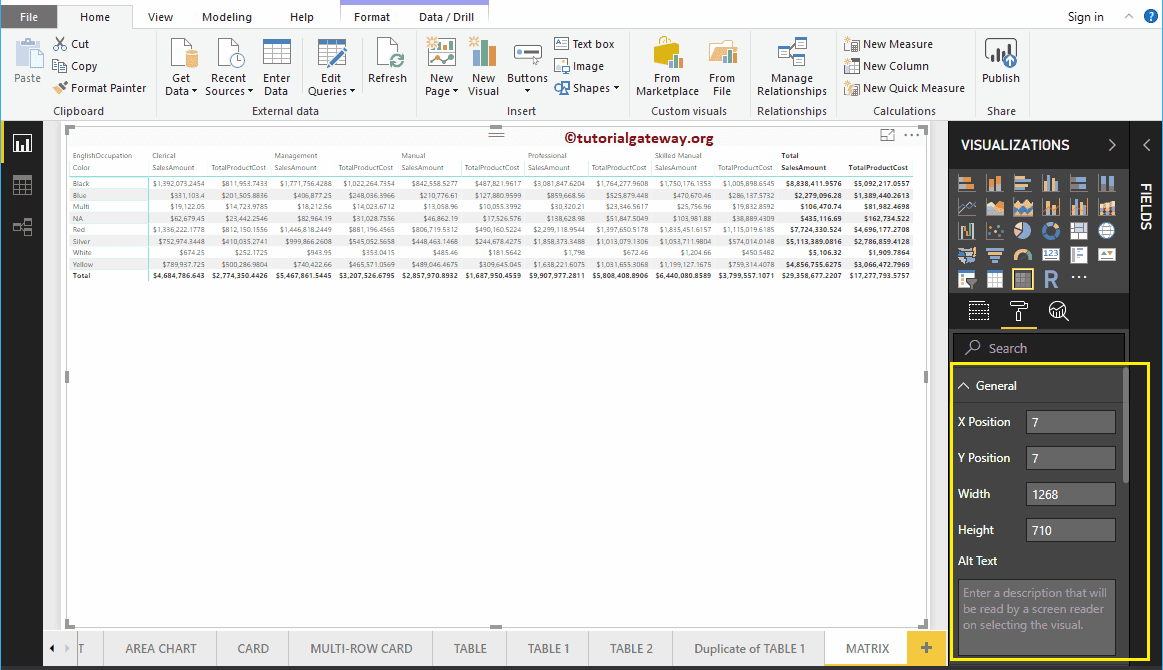
Use this General Section to Change the X, Y position, Width and height of a Matrix
Format Power BI Matrix Style
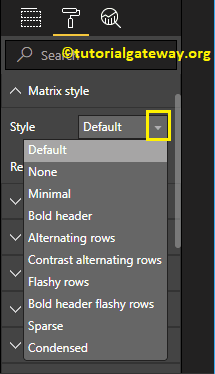
From the below screenshot, you can see the list of styles that are available to style this Matrix. Please select any style as per your requirement.
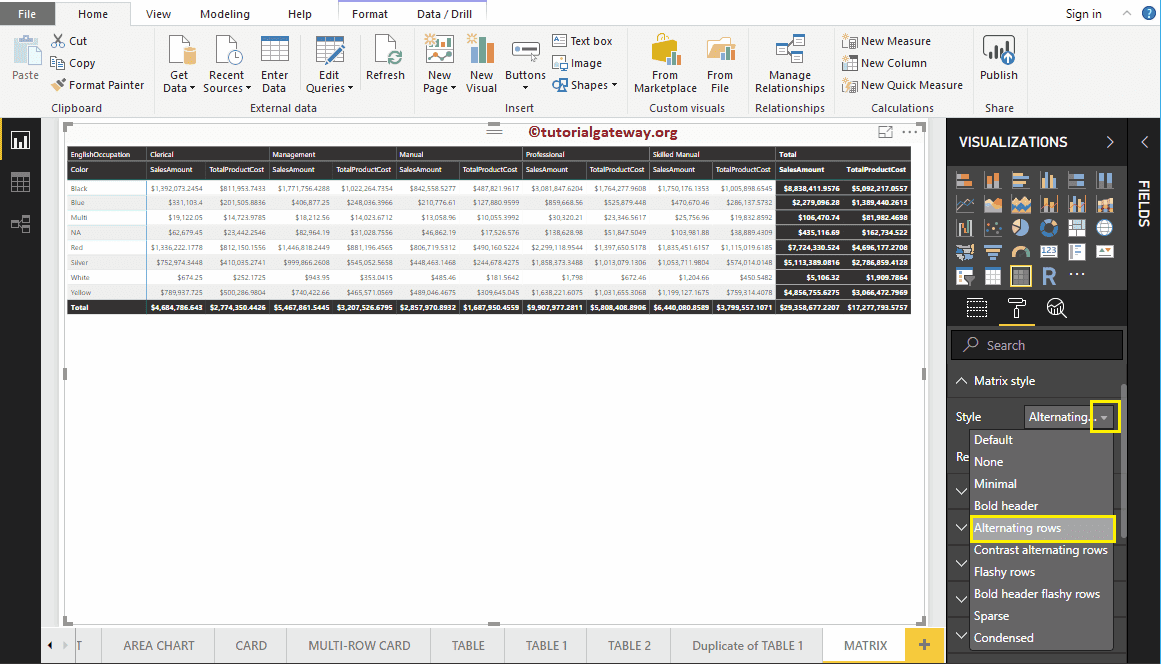
For now, we are selecting the Alternating Rows option from the drop-down list. It adds alternative row colors and adds Black color to Header, Subtotals, and Grand totals.
The following are the list of options that are available for you to format the Power BI Matrix Grid.
- Vert Grid: Toggling this property from Off to On add Vertical Grid to the Matrix. Nothing but enabling Vertical line to separate each column.
- Horiz Grid: Add Horizontal Grid. Nothing but enabling Horizontal line to separate each row.
- Horiz Grid Color: Changing the Color of a Matrix Horizontal Grid.
- Horiz Grid thickness: Matrix Horizontal Grid Line width
- Row Padding: Space between the rows.

As you can see from the below screenshot, w changed the grid color to gold, grid thickness to 2, and row padding to 10
- Outline Color: Color after the Header, and row group. We are using the default green as the Outline color.
- Outline Weight: Matrix Line width. We changed the line stroke to 4
- Text Size: Font size of table values. Let me change the text size to 9

As you can see from the below screenshot, we enabled the Vertical Grid and assigned some random colors.
- Vert Grid Color: Change the Color of a Matrix Vertical Grid.
- Vert Grid thickness: Matrix Vertical Grid Line width or stroke

To adjust the space, we renamed the column names under the values section. As you can see, we changed the Sales Amount names as Sales and Total Product Cost as Cost

Format Column Headers of a Matrix in Power BI
This section is to alter the Header Colors. As you can see from the screenshot below, we changed the Font color to White, Background color to green. Next, Font Family to Cambria, Outline to Top + Bottom (Outline added to the top and bottom of a Header), Text Size to 15, and Header text alignment to center.

Format Row Headers of a Matrix in Power BI
This section is used to alter or format the Row Headers section. Here, we changed the Font color to White, Background color to Red, Outline to Top + Bottom (Outline added to the top and bottom of each row), Font Family to Cambria, Text Size to 15, and text alignment to center.

As you can see from the above screenshot, though, we changed the Background color of total rows (Row Headers), only Total background color has changed. It is because of the Banded Row Style property that we explain in the next step
Format Values of a Matrix in Power BI
You can use this section to change the Matrix values. As you can see from the screenshot below, we changed the Font colors and Back color of the even and odd rows.

Banded Row Style: By default, it set to On. It means the Row Header color will be the same as the remaining Row fields.
Let me set this Off. It changes the Row Header Background Color to the Purple. It is because, we applied this color in the above step, i.e., Row Headers section

Show On Rows: Enabling this option show the totals on Rows

As you can see, we removed the Outline and Changed the Font to Cambria, and Text size to 13

Format Subtotals of a Matrix in Power BI
Use this subtotal section to alter the text and background color of subtotals. By toggling Row subtotals, column subtotals to Off, you can remove the Totals completely.

Format Grand Total of a Matrix in Power BI
Use this Grand Total section to alter the text and background color of Total. As you can see from the below screenshot, we changed the Totals Font color to white, Background color to purple, Font Family to Cambria, and Text Size to 14.
Apply to labels: By toggling this option to On apply the Background Color to the Header of the Total. As you can see, Power Bi has changed the background color of the text of a header of Total
Format Power BI Matrix – Field Formatting
Use this section to format individual columns in a Matrix.
For example, you can use this section to assign a completely different color to one column. Here, we are selecting Sales.

For the Format Power BI Matrix demo purpose, we changed the background color to Pink for this column only.

Format Power BI Matrix – Conditional Formatting
Use this section to format Metric columns (Numeric) in a Matrix. For example, adding a background color to a complete column, or adding data bars, etc. We will write a separate article to explain these settings

Format Power BI Matrix Title
By toggling the Matrix option from Off to On, you can enable the Matrix title.
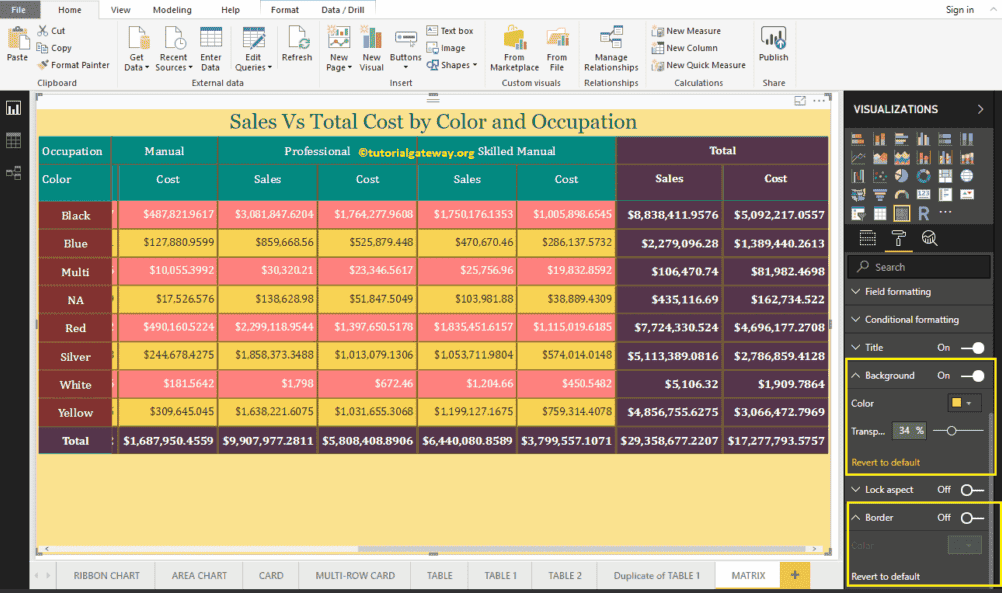
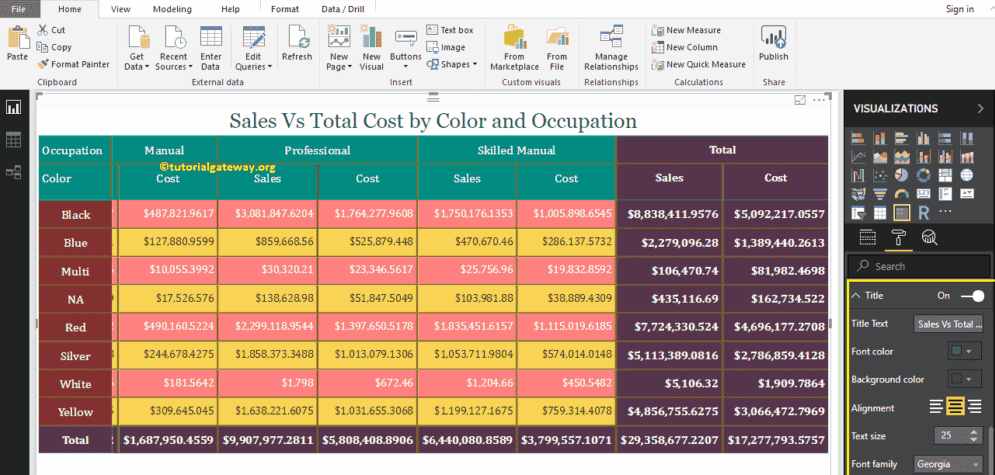
From the screenshot below, you can see we added the Title Text as Sales Vs. Total Product Cost by Product Color and Occupation. Next, we changed the Font Color to Green, Font Family to Georgia, Text Size to 25, and Title Alignment to center. If you want, you can add the background Color to the Matrix title as well.

Format Power BI Matrix Background Color, and Borders
You can add a Background color to a Matrix by toggling Background option to On. For the Format Matrix demonstration purpose, we added sky pale yellow color with 34% transparency.
Similarly, by toggling Border option from Off to On, you can add Borders to a Matrix.