In Power BI, you can create a custom table or calculated table from the existing table. In this article, we show you how to create calculated tables in Power BI with an example.
To demonstrate this Power BI Calculated Tables, we are going to use the SQL Data Source that we created in Connect Power BI to SQL Server article. So, please refer to the same.
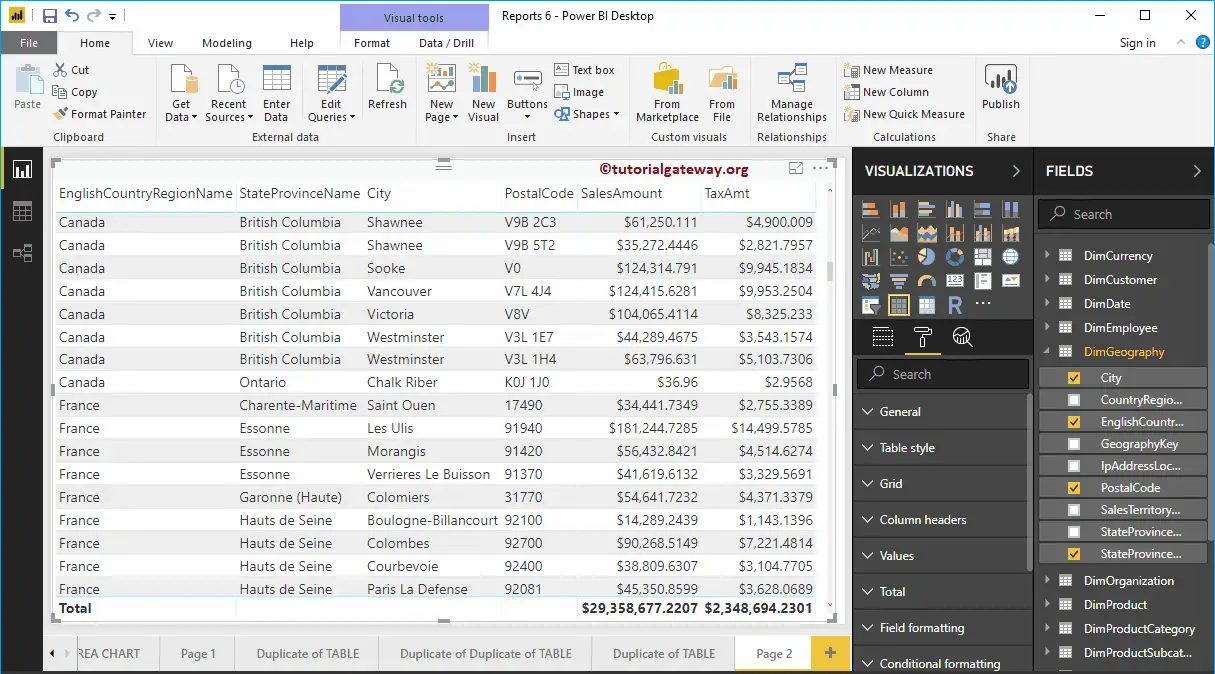
How to Create Calculated Tables in Power BI
In order to add the calculated table, please click on the New Table option under the Modeling tab.
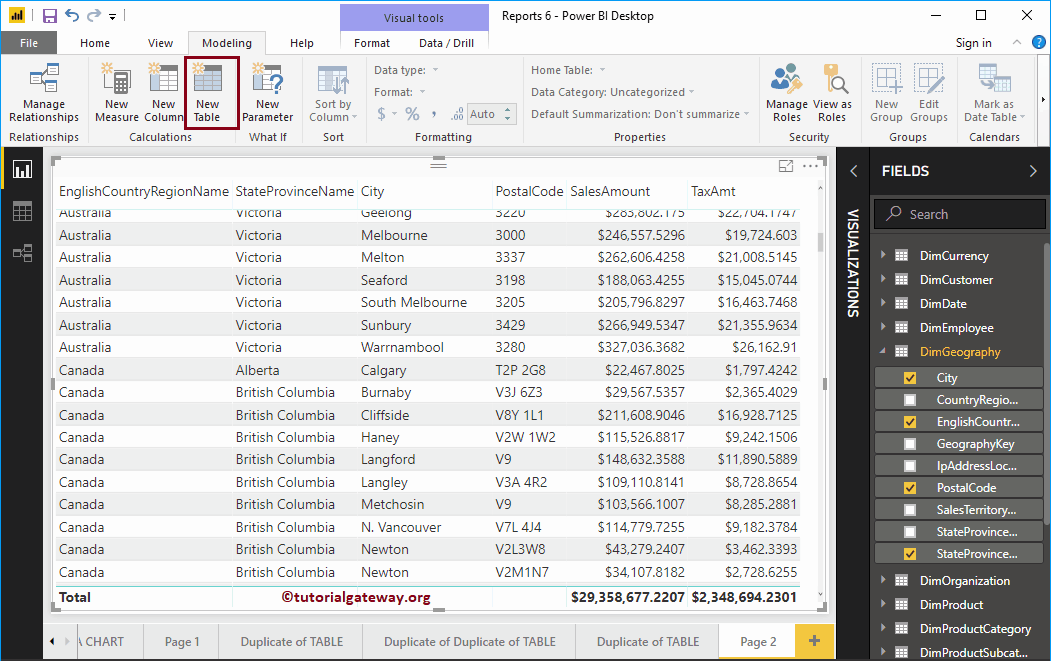
It will open the Power BI DAX formula bar to write DAX expression, as we have shown in the screenshot below.
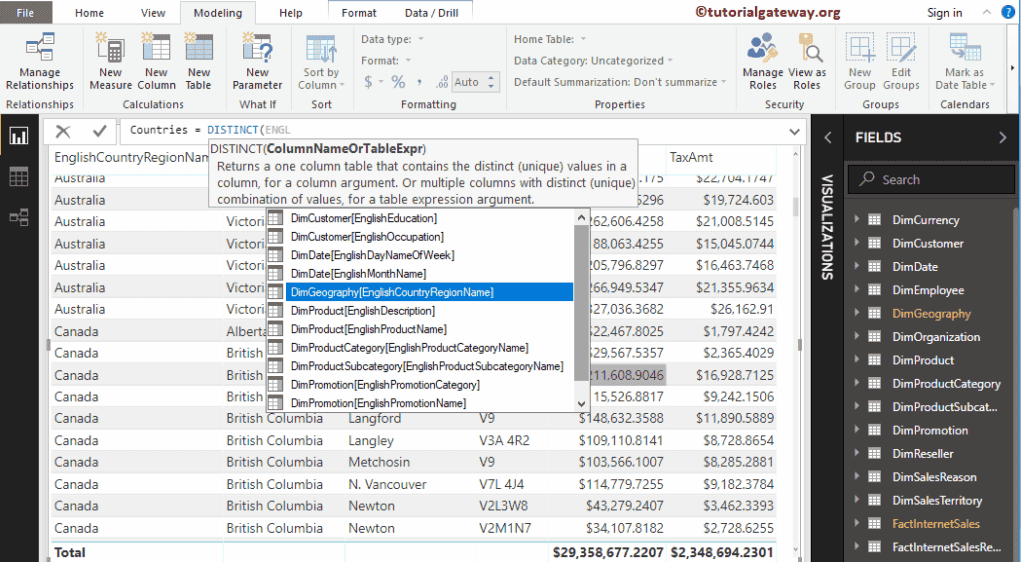
Let me rename the default table name as Countries
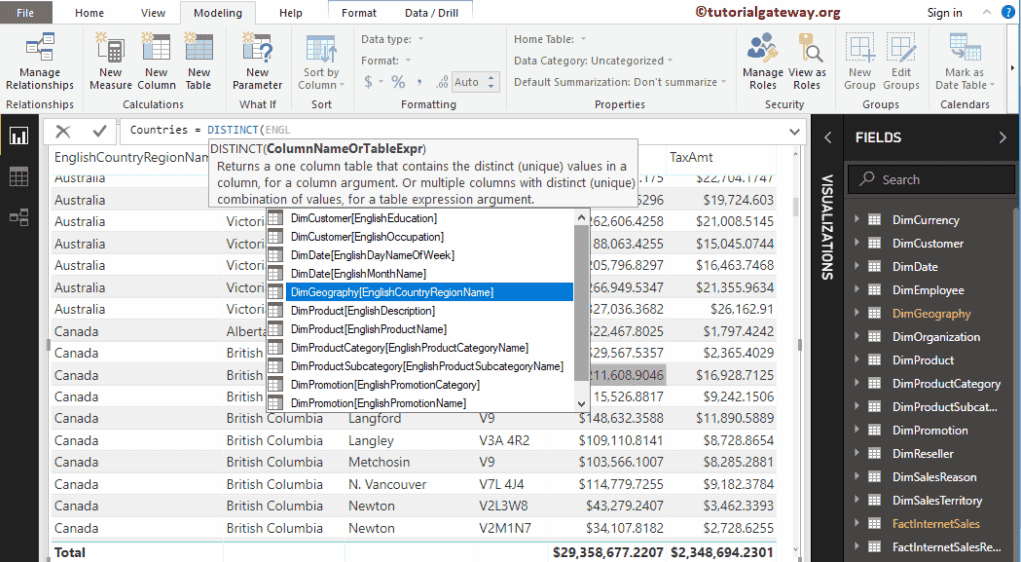
For this Calculated Tables demo purpose, we are selecting Countries from the DimGeography table. As you can see from the screenshot below, while I was typing, Power BI IntelliSense is showing the suggestions.
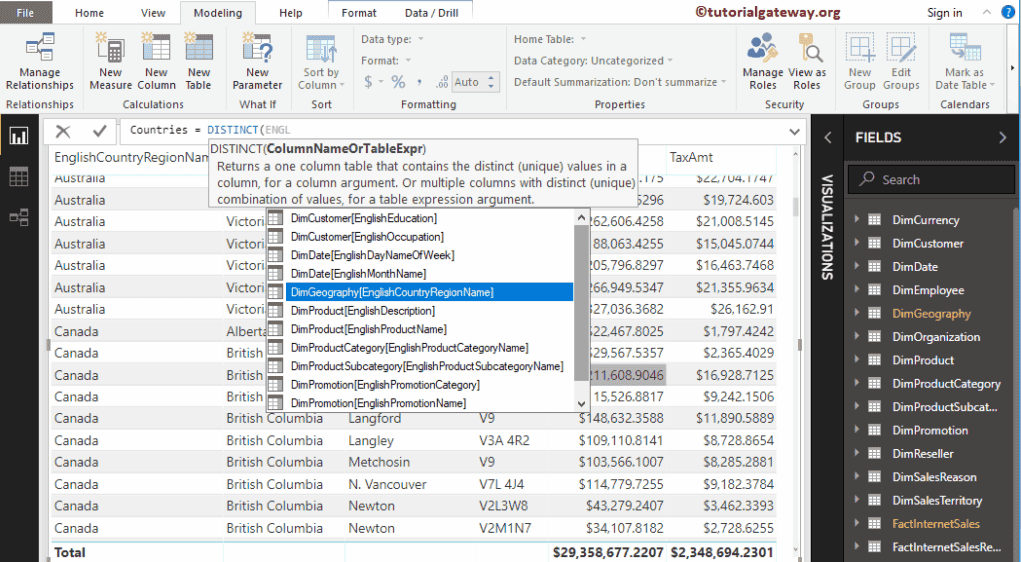
From the screenshot below, you can see, we are selecting the DISTINCT (non-duplicates or unique) countries’ names from the Countries column.
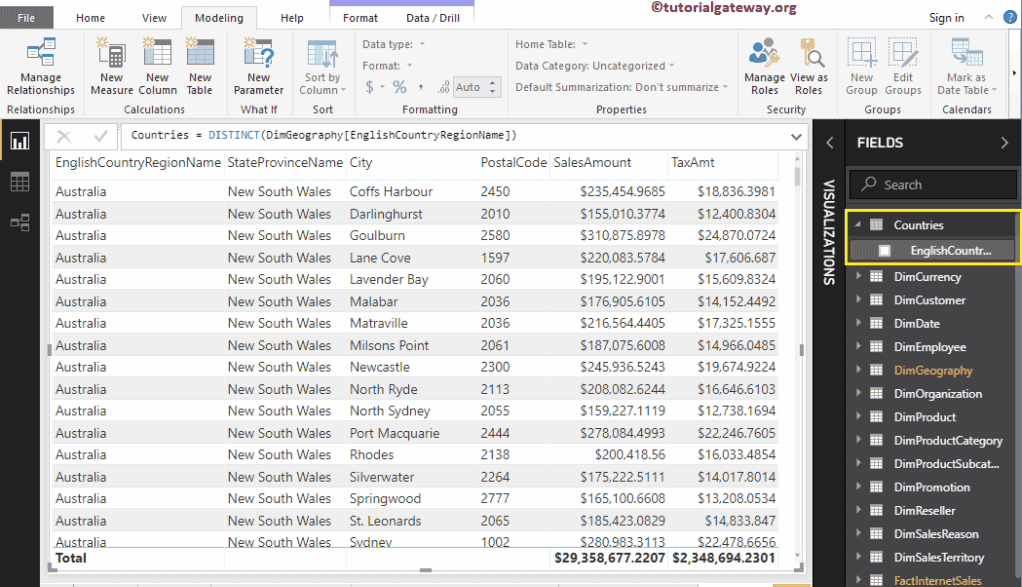
By clicking the enter or any key for that matter will create a new table called Countries holding distinct country names.
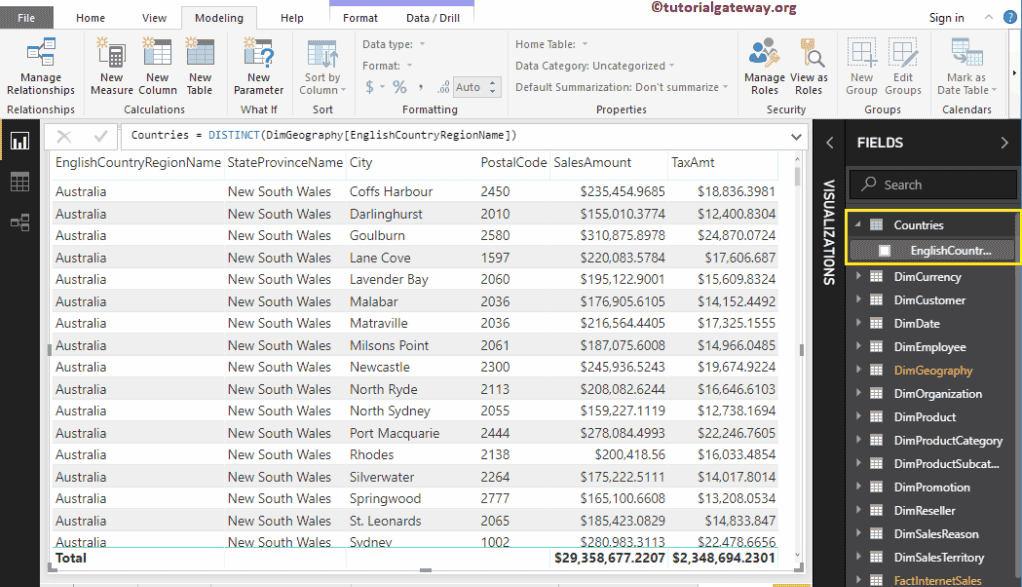
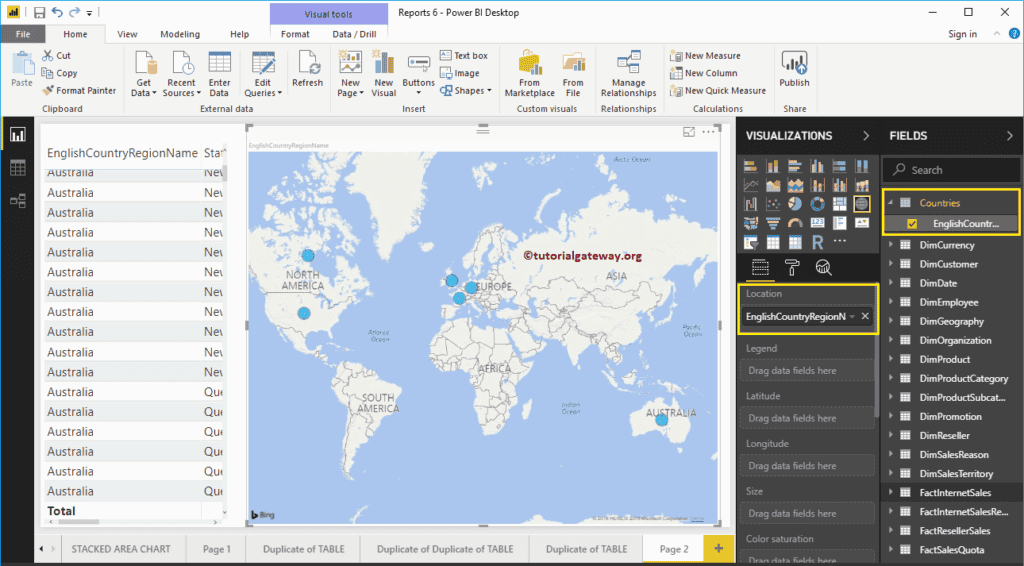
Let me create a Map using that calculated table that we created earlier.
